Article
J. Braz. Chem. Soc., Vol. 22, No. 6, 1082-1088, 2011. Printed in Brazil - ©2011 Sociedade Brasileira de Química 0103 - 5053 $6.00+0.00
A
*e-mail: [email protected]
Scanning Electrochemical Microscopy: Study of the Deposition and Stripping
Mechanism of Lead in the Presence of Copper
M. Fátima B. Sousa,* E. M. S. Sanchez and Rodnei Bertazzoli
Faculdade de Engenharia Mecânica, Universidade Estadual de Campinas, Rua Mendeleiev 200, Cidade Universitária Zeferino Vaz, Barão Geraldo, 13083-860 Campinas-SP, Brazil
Este artigo descreve a utilização da microscopia eletroquímica de varredura (SECM) no modo geração pelo substrato/coleta pela ponta (SG/TC), com o objetivo de elucidar aspectos mecanísticos da deposição eletrolítica e redissolução anódica de íons Pb2+ na presença de Cu2+, utilizando-se
um eletrodo de carbono vítreo como substrato. Um pico anódico foi observado entre os principais picos correspondentes à redissolução dos metais puros. A posição, intensidade e forma deste pico foram investigadas e foi veriicado que eram função da razão entre as concentrações de Pb2+ e
Cu2+. Os resultados sugerem que o pico é devido à dissolução do chumbo depositado sobre cobre,
resultante de uma deposição em regime de subtensão. A SECM forneceu informações adicionais para o entendimento dos mecanismos de redissolução que não seriam obtidas a partir da análise apenas da resposta voltamétrica.
This paper describes the application of scanning electrochemical microscopy (SECM) in the substrate-generation/tip-collection (SG/TC) mode to elucidate mechanistic aspects of the deposition and stripping of Pb2+ ions in the presence of Cu2+ into a glassy carbon substrate electrode. A stripping
peak was observed between the main peaks corresponding to the pure metals. Its position, height and shape were investigated, and the peak intensity was found to depend on the Pb2+/Cu2+ concentration
ratio. The results suggested that this peak was due to the dissolution of lead deposited in copper, as a result of an underpotential deposition. The scanning electrochemical microscope provided additional information towards the understanding of the stripping mechanisms in analytical studies. In particular, the SECM-tip response yielded direct evidence about the speciation of some of the compounds evolved during stripping. This information was not available from the voltammetric response of the substrate electrode alone.
Keywords: scanning electrochemical microscopy, lead underpotential deposition, copper, stripping voltammetry
Introduction
Mechanistic and kinetic studies of electrochemical processes at solid-liquid interfaces such as electrodeposition, dissolution and corrosion are subjects of growing interest because of their theoretical and practical importance. A variety of in situ techniques are now available, including the electrochemical quartz crystal microbalance (EQCM),1-3
electrochemical scanning tunnelling microscopy (STM)4,5
and scanning electrochemical microscopy (SECM).6-10
The SECM is a scanning probe microscopy (SPM), and as all SPMs, they operate by scanning or “rastering” a small probe tip over a surface to be investigated. In the SECM, the tip is an ultramicroelectrode (UME), which
can be operated under amperometric or potentiometric conditions. When under potentiostatic control, the tip response is a faradaic current due to the electrolysis of species consumed or generated at the UME. The SECM was irst introduced to study solid-liquid interfaces. In this case, the UME is scanned in an electrolyte solution, very close to a conducting or insulating solid substrate, to provide an image and characterise the topography and the chemical/ electrochemical activity of the solid-liquid interface.11-13
Further advances included applications in liquid-liquid,14
liquid-gas15 and even solid-gas16 interfaces.
study heterogeneous reactions at the substrate surface,17
and homogeneous reactions in the tip-substrate gap,18
as an imaging device19 and for microfabrication.20 The
SECM can be operated in different ways, and the tip-substrate voltammetry is one of its main operational modes.21
In this mode, the tip current (Itip) is recorded against the
substrate potential (Esubstrate), while the substrate is subjected
to a potential sweep and the tip is biased at a ixed potential and held a few micrometers above the substrate surface. The resulting plot is called a tip-substrate voltammogram.
Stripping analysis is a well-known technique for investigating alloy composition. In this study, the SECM was operated in the tip-substrate voltammetry mode, and combined with stripping analysis on the substrate to obtain mechanistic information about the electrodeposition and dissolution of lead in the presence of copper. The objective was to verify whether the proposed formation of a Pb-Cu alloy occurred. In a previous study,22 it was shown that
mechanically-polished glassy carbon electrodes were able to collect lead(II) at open circuit. Once the metallic ion was accumulated at the electrode surface it was reduced under potentiostatic control, and then stripped by scanning the electrode potential as in anodic stripping voltammetry (ASV). In subsequent experiments, the property of the glassy carbon with respect to other metallic ions was checked. When lead and copper were present in the same pre-concentrated solution, a condition not uncommon with environmental samples, a dissolution peak (referred here as the third peak) was observed between the stripping peaks for the pure metals. The intensity of the third peak was found to increase with the Cu2+/Pb2+ ratio, while the intensity of the lead stripping
peak was found to decrease. One of the objectives of the present work was to determine the nature of the species corresponding to the so-called third peak.
Experimental
Instrumentation
The scanning electrochemical microscope used in this study was assembled from commercially-available and home-built components. The tip positioner consisted of a three-dimensional translation stage (model M-462-XYZ-OPT 06 06 06, Newport), controlled by three manual micrometers (model SM-1, Newport), and of three-dimensional piezoelectric microstage (model PZS-100, Burleigh Instruments). The latter was controlled by a three-axis ampliier (model PZ-300, Burleigh Instruments). A home-built bi-potentiostat coupled to a triangular wave generator (Oxford Electrodes) was used to control the potentials of the tip and of the substrate independently.
A four-electrode cell coniguration was employed: the tip was a 8 µm-φ carbon iber, sealed in glass; the substrate was a 4 mm-φ glassy carbon electrode sealed in telon; the counter electrode was a platinum gauze; and the reference electrode was a home-made saturated calomel electrode (SCE). All potentials are reported with respect to the SCE. Data was collected from two x-y recorders (Gould series 6000), one for the tip amperometric response (itipvs Esub),
and the other for the substrate voltammogram (isubvs Esub).
The SECM cell23 was designed to position the substrate
electrode perpendicular to the tip, and to hold approximately 5 mL of solution. The substrate electrode was inserted from a hole in the bottom of the cell, and held in place with a SQ 14 joint and one o-ring to avoid solution leakage. The cell also had an optical window to allow an undistorted view through the solution and was used to facilitate tip alignment.
Reagents
Analytical grade chemicals purchased from Aldrich and Sigma (both from UK) were used without further puriication. All solutions were prepared using water puriied by a Whatman RO 50 and Stillplus system; 0.1 mol L-1 HCl
was used as supporting electrolyte, and stock solutions of 1×10⁻³ mol L-1 Pb(NO
3)2 and 1×10
-2 mol L-1 Cu(NO 3)2
were diluted to achieve the required concentrations. Pure argon was used to deoxygenate and to promote stirring of the solution.
Tip-substrate voltammetry
just touched the centre of the substrate surface. Then it was moved 70 µm back with the piezoelectric microstage.
Stock solutions of Pb2+ and Cu2+ were added to the
electrolyte. The Cu2+/Pb2+ concentration ratio ranged from
0 to 100 with a 6×10⁻⁷ mol L-1 Pb2+ concentration. A low of
argon was allowed to pass through the solution while the substrate potential was held at –0.7 V for 20 min in order to plate the metals. After this period of time, the tip-substrate distance was then readjusted with the piezocontroller down to about 15 µm above the substrate surface. The argon bubbling was then turned off, the tip was biased at a chosen potential (from −0.7 V to –0.3 V), and the substrate potential was then cycled (once or repeatedly) between –0.7 V and –0.3 V or between –0.7 V and 0.0 V. The forward scan resulted in the dissolution of the selected metal. The tip current was recorded against the substrate potential to produce a tip-substrate voltammogram and a substrate voltammogram. Before each successive experiment, the tip and the substrate were cleaned by applying to both an anodic potential with respect to lead and/or copper. When measuring depositable species this cleaning step is necessary to avoid the microelectrode overgrown by the deposit, thus changing the active area of the electrode. In doing so the measurements were reproducible and did not require additional renewal.
Results and Discussion
Intermetallic effects often occur in the voltammetric determination of heavy metals in environmental samples and have been widely reported.24-27 They can manifest
themselves in many ways such as amalgam (alloy) formation, catalytic effects and peak overlap. These intermetallic effects can distort the voltammetric response and affect the accuracy of the quantification, so it is necessary to be aware of their occurrence when analysing samples containing multiple metallic species.
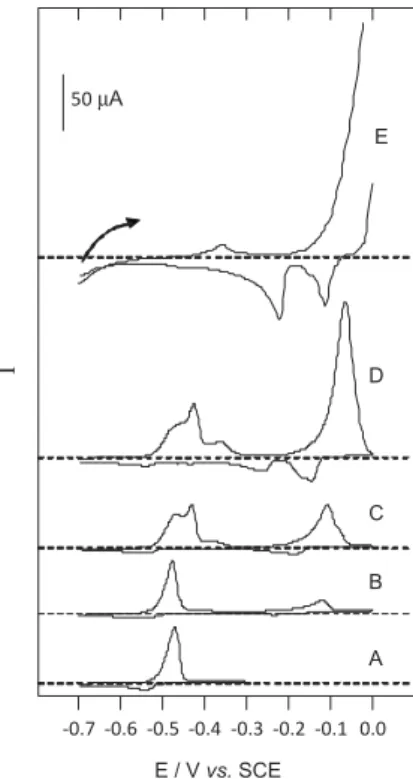
Figure 1(A-E) illustrates how the electrodeposition and stripping of lead are affected by an intermetallic effect caused by an increasing concentration of Cu2+ in the plating
solution (ranging from 6.0×10⁻⁷ mol L-1 for Cu2+/Pb2+ = 1
to 6.0×10⁻⁵ mol L-1 for Cu2+/Pb2+ = 100). The presence
of copper affected the lead stripping peak even for a 1:1 ratio. In Figure 1B it can be seen that a very small shoulder appears in the anodic direction. Further increase in the Cu2+
concentration led to a split of the main peak, whilst the peak around −0.36 V became more and more pronounced. For a 100:1 ratio, the lead stripping that peaked at potentials lower than −0.36 V have completely disappeared (Figure 1E). The hypothesis is that the splitting of the lead stripping peak was due to the presence of lead deposited on
three different substrates: glassy carbon, copper and lead itself. It must be pointed out that the accumulation time in voltammogram E was only 2.5 min, against 20 min for all the other voltammograms, in order to allow the view of any lead stripping peak.
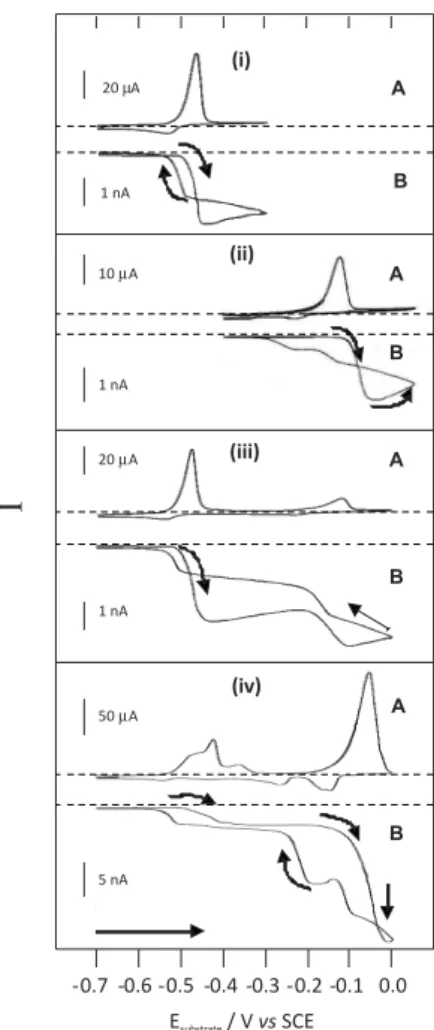
Experiments were carried out in the generation/collection mode where the faradaic current lowing through the biased tip is recorded while cycling the potential of the substrate. Figure 2 shows typical substrate voltammograms (A) and tip amperometric response (B) recorded for increasing Cu2+/Pb2+ ratio. The tip was kept approximately 15 µm above
the substrate surface and its potential was held at –0.7 V. This distance was selected based on experimental SECM approach curves and theoretical parameters correlating the tip-substrate distance with the tip radius.28
After a plating period of 20 min (–0.7 V) under stirring conditions, the substrate potential was swept from –0.7 V to 0.0 V (or –0.4 V to 0.05 V in the case of copper alone) at 50 mV s-1. Experiments were performed with lead (i),
copper (ii) and lead-plus-copper (iii and iv) solutions. The choice of tip potential allowed selecting the species that will be detected by the tip. Typically one chooses a tip potential so as to reduce the species of interest. In this way any metal released by the substrate diffuses in the tip-substrate gap and is plated on the tip as soon as it reaches the tip. Figure 1. Cyclic voltammograms obtained in 0.1 mol L-1 HCl with glassy
carbon electrode 4 mm φ, at 50 mV s-1, after 20 min electrodeposition
(A, B, C and D), and 2.5 min (E). Concentrations were: (A) Pb2+
6×10⁻⁷ mol L-1, (B) Pb2+ + Cu2+ (1:1), (C) Pb2+ + Cu2+ (1:3), (D) Pb2+ + Cu2+
When the potential of the substrate electrode was scanned from cathodic towards anodic potentials, the SECM system was in the substrate-generation/tip-collection mode (the substrate is a generator and the tip is a collector). The electrochemical process at the substrate (oxidation of the metallic deposit) was opposite to that at the tip (reduction of lead and copper ions generated at the substrate/solution interface), and the cathodic current recorded at the tip tended to a maximum value. In this mode, the tip was immersed in a thin diffusion layer generated by the process occurring at the substrate electrode. On the reverse scan both substrate and tip acted as collectors and there was a noticeable decrease of the tip current as the reactions at the substrate consumed the same reactants as those occurring on the tip:
Pb2+ + 2e− Pb (1)
Cu2+ + e− Cu+ (2)
Cu+ + e− Cu (3)
It is known that copper deposition in acidic medium occurs according to the following relative rate: Cu2+ + e− Cu+ (fast) and Cu+ + e− Cu (slow).
In solution free of complexing species the kinetics of the couple are still considered rapid. But in a chloride medium, copper ions are able to form complexes, and these complexes present more negative reduction potentials than the free ion and the complex form predominating in solution for Cu(II) and Cu(I) are respectively CuCl+ and CuCl
2−.
The tip amperometric responses show pseudo plateaux rather than current peaks for lead and copper species because the amount of ions delivered from the substrate into the thin layer between substrate ant tip is high (20 min deposition) taking into account the diameter of the tip (microelectrode) and the diameter of the substrate. So a pseudo-steady state is achieved during the tip-collection.
Since the tip-substrate gap is very thin, the diffusion time between the substrate and the tip is very short and the detection is practically instantaneous. Assuming a diffusion coeficient circa 10-5 cm2 s-1 for a 15 µm gap, the diffusion
time is roughly d2/D = (15×10-4)2 / (10-5) = 225×10-3 s. With
a 50 mV s-1 scan rate, this diffusion time corresponds to
about 11 mV on the potential axis. This is a very small value; therefore any species released by the substrate will show up as a peak on the tip-substrate voltammogram almost at the same potential as the dissolution process occurs. These results show that the SECM response reproduces the diffusion coeficient of the metallic ion being stripped. The multiple-step reduction for copper at higher concentration, both onto the substrate and the tip (Figure 2(iv)) relects the presence of Cu(I) and Cu(II) complex species formed in the acidic-chloride media. 29,30
According to Shah et al.,32 the dissolution peak for
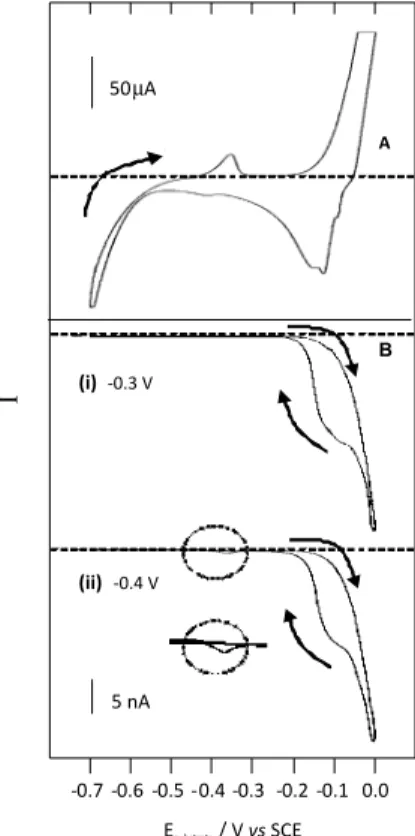
Pb-Cu alloys lies at a potential between those for pure copper and pure lead. It is therefore reasonable to assume that the species stripping around –0.36 V is a Pb-Cu alloy. The cyclic voltammogram in Figure 3 was recorded after 20 min of electrodeposition at –0.7 V in a Cu2+/Pb2+ = 100:1,
0.1 mol L-1 HCl solution. The potential range chosen, −0.7 V to –0.3 V, did not permit the stripping of copper (see voltammogram E in Figure 1) since voltammograms A and B in Figure 1 indicated that the plating of lead and copper on the glassy carbon substrate occured at potentials around –0.5 V and –0.2 V, respectively. Based on these indings, the tip was held at different potentials between –0.4 V and –0.7 V. If the peak about –0.36 V was due to the dissolution of a Pb-Cu alloy, the stripped copper would have been collected by the carbon iber tip held at potentials higher than –0.5 V. This did not occur. The carbon iber tip started collecting the species released by the substrate only when it was held at potentials below −0.5 V, as expected if Figure 2. Substrate cyclic voltammograms (A), and tip amperometric
response (B) obtained for the stripping of lead and copper from the glassy carbon electrode. In 0.1 mol L-1 HCl with (i) 6.0×10⁻⁷ mol L-1 Pb2+,
(ii) [Pb2+]/[Cu2+] = 1:1 and (iii) [Pb2+]/[Cu2+] = 1:8. Tip potential, −0.7 V,
the stripped species was only lead ion. The hypothesis of an alloy formation can thus be eliminated. The saturation in the reduction current in Figure 4A was due to the evolution of hydrogen at the copper-coated carbon substrate.
The results obtained suggest the phenomena of underpotential deposition where the peak at –0.36 V is due to the dissolution of lead accumulated in underpotential deposition (UPD) onto a copper layer. In a UPD process, a submonolayer to several monolayers of a metal adatom deposits onto another metallic substrate at potentials positive to the reversible Nernst potential. In other words, UPD describes the formation of metallic monolayers at potentials higher than those required for bulk deposition. The formation of an overlayer before the bulk deposition potential is possible because the adatom-substrate bond is thermodynamically more favourable to the adatom-adatom bond. For this reason, UPD is usually limited to a
monolayer in extent, and the resulting structure of the UPD adlayer is strongly inluenced by the substrate. A typical monolayer is saturated at a higher concentration level.
The next experiments were designed in order to test this hypothesis. The voltammogram in Figure 4A was recorded between –0.7 and 0.0 V, after the substrate was exposed for 20 min to the plating solution at −0.7 V.
In order to obtain a better-deined stripping peak just about –0.36 V, it was necessary to increase the sensitivity of the measurement. This resulted in the saturation of the current due to oxidation of copper in 4 A. In Figure 4B (i), the carbon iber tip is held at –0.3 V. Under these conditions only copper was collected, even during the reverse scan, when the tip was already covered with copper, because the tip potential (−0.3 V) was not negative enough to reduce Pb2+. The tip amperometric response 4B (ii) (tip at –0.4 V)
obtained subsequently (i.e. with the carbon iber tip covered with copper from the previous experiment) showed the collection of the species stripped at –0.36 V.
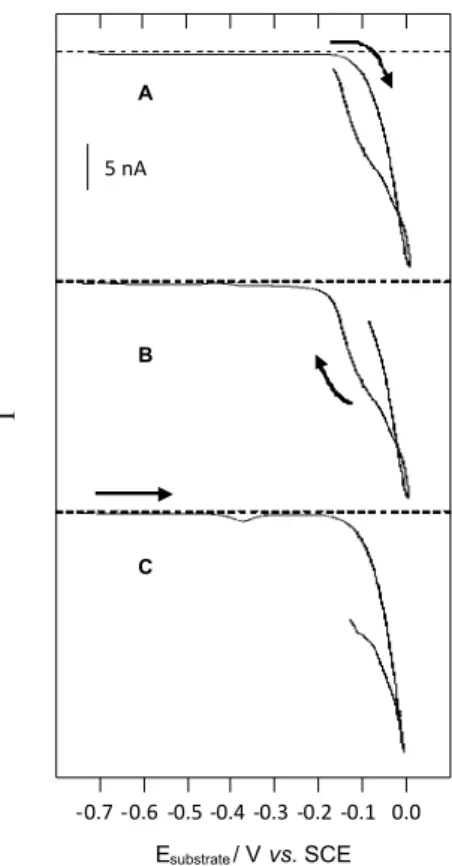
Tip amperometric responses (Figure 5) were recorded at the same time as a cyclic voltammogram similar to that in Figure 4A. The tip was held at –0.4 V. In (5A) Figure 3. Substrate cyclic voltammogam (A) and tip amperometric
response (B) recorded at 50 mV s-1 in HCl 0.1 mol L-1, between −0.7 V
and −0.3 V. The metallic layer was electrodeposited for 20 min on the glassy carbon electrode from a 0.1 mol L-1 HCl + 6×10⁻⁷ mol L-1
Pb2+ + 6×10⁻⁵ mol L-1 Cu2+ solution. Tip potentials are indicated below to
each tip-substrate voltammograms. Dashed lines indicate the zero current. [Cu2+]/[Pb2+] = 100:1, 0.1 mol L-1 HCl solution.
Figure 4. (A) Substrate cyclic voltammogram obtained in 0.1 mol L-1
HCl with glassy carbon electrode 4 mm φ, at 50 mV s-1, after 20 min
electrodeposition from 6×10⁻⁷ mol L-1 Pb2+ + Cu2+ (100:1), in 0.1 mol L-1
and (5B), details of the forward and reverse scan were observed, starting the collection with the carbon iber tip clean, i.e., free of any metallic deposit. Without the presence of copper over the tip, the forward scan (5A) did not register any response to the specie stripped at –0.36 V. However, in the reverse scan (5B), when the tip contained a deposit of copper, the presence of that specie was detected. This fact was not observed in the reverse scan when the tip was held at –0.3 V (Figure 4B (i)). In (5C), the collection of the specie stripped at –0.36 V was detected in the forward scan, when with the carbon iber was covered with copper.
Based on these data, it can be concluded that the species stripped around –0.36 V is actually lead deposited over copper, from solutions containing Pb2+ ions in the presence
of Cu2+ ions, at given concentration ratios at underpotential
conditions, instead of an alloy Pb-Cu.
Another experiment was made aiming to conirm this statement. It consisted in performing a deposition in a 100:1 Cu2+/Pb2+ solution, holding the substrate potential at
–0.4 V. This experiment was carried out with both the bare glassy carbon electrode and the glassy carbon electrode covered with copper. When stripping the deposit obtained
under both conditions, the presence of the stripping peak at –0.36 V was observed.
On the other hand, the two irst lead stripping peaks that were present in lower Cu2+/Pb2+ ratios can be also attributed
to the dissolution of lead deposited on different substrates: on glassy carbon (the peak with higher overpotential) and on lead itself. An explanation to this phenomenon would be that as copper deposits on the glassy carbon, the area available to lead deposition diminishes. Thus, a growing process (lead on lead) rather than a nucleation process (lead on glassy carbon) is favoured. By comparing these data with those obtained when applying a chemical uptake of the ions by the glassy carbon surface, prior to the electrolytic reduction,22 an important difference is observed: the lead
stripping peak at –0.52 V did not present any division with the presence of copper ion in the pre-concentrated solution. It is present as a single peak for lower Cu2+/Pb2+
concentration ratios, or it is completely replaced for the peak at –0.36 V, which gradually grows with the Cu2+/Pb2+
concentration ratio. A possible reason to this fact would be that when a chemical collection is applied, each ion occupies a speciic physical location at the glassy carbon surface, and the same happens to the metallic deposit, for pre-concentrated solutions at lower Cu2+/ Pb2+ concentration
ratios. However, for higher concentration ratios, there must be a migration and reorganization of the metallic atoms after the reduction.
Conclusions
The SECM is a very versatile SPM technique that has come out as a simple and powerful electrochemical tool for probing physicochemical interfacial processes. This technique combines the capabilities of UME electrochemistry with those of SPM. This work is just a modest sample of its potential as an effective method to carry out mechanistic studies of electrodeposition/stripping process of metals. The rather simple experiments presented here demonstrated quite clearly the underpotential deposition of lead in copper and how the increasing concentration of copper in the pre-concentrated medium affected the proile and position of the lead stripping peak. This information must be considered when performing experiments involving simultaneous determination of lead and copper by applying techniques related to ASV, using glassy carbon electrodes.
Acknowledgments
The authors would like to thank the Fundação de Amparo à Pesquisa do Estado de São Paulo (FAPESP) Figure 5. Consecutive tip-amperometric response obtained at the same
for its inancial support and Guy Denault (University of Southampton) for the SECM equipment and for providing technical assistance.
References
1. Benito, D.; Gabrielli, C.; Garcia-Jareño, J. J.; Keddam, M.; Perrot, H.; Vicente, F.; Electrochim. Acta2003, 48, 4039. 2. Baek, Y.; Frankel,G. S.; J. Electrochem. Soc. 2003, 150, B1. 3. Wang, K.; Pickering, H. W.; Weil, K. G.; Electrochim. Acta
2001, 46, 3835.
4. Randler, R. J.; Kolb, D. M.; Ocko, B. M.; Robinson, I. K.; Surf. Sci.2000, 187, 447.
5. Polewska, W.; Behm, R. J.; Magnussen, O. M.; Electrochim. Acta2003, 48, 2915.
6. Macpherson, V.; Unwin, P. R. In Scanning Electrochemical Microscopy; Bard, A. J.; Mirkin, M. V., eds., Marcel Dekker: New York, 2001, pp. 521-592.
7. Bragato, C.; Daniele, S.; Baldo, M. A.; Denuault, G.; Ann. Chim.
2002, 92, 153.
8. El-Giar, E. M.; Said, R. A.; Bridges, G. E.; Thomson, D. J.;
J. Electrochem. Soc. 2000, 147, 586.
9. Fushimi, K.; Seo, M.; Electrochim. Acta2001, 47, 121. 10. Katemann, B. B.; Inchauspe, C. G.; Castro, P. A.; Schulte, A.;
Calvo, E. J.; Schuhmann, W.; Electrochim. Acta2003, 48, 1115. 11. Bard, A. J.; Fan, F. R. F.; Kwak, J.; Lev, O.; Anal Chem. 1989,
61, 132.
12. Engstrom, R. C.; Pharr, C. M.; Anal. Chem. 1989, 61, 1099A. 13. Frank, M. H. T.; Denuault, G.; J. Electroanal. Chem. 1993, 354,
331.
14. Shao, Y.; Mirkin, M. V.; J. Electroanal. Chem. 1997, 439, 137. 15. Barker, A. L.; Gonsalves, M.; Macpherson, J. V.; Slevin, C. J.;
Unwin, P. R.; Anal. Chim. Acta1999,385, 223.
16. Jones, C. E.; Macpherson, J. V.; Barber, Z. H.; Somekh, R. E.; Unwin, P. R.; Electrochem. Commun. 1999,1, 55.
17. Yi-Fu, Y.; Denuault, G.; J. Electroanal. Chem. 1996, 418, 99. 18. Treichel, A.; Mirkin, M. V.; Bard, A. J.; J. Phys. Chem.1994,
98, 5751.
19. Bard, A. J.; Li, X.; Zhan, W.; Biosens. Bioelectron.2006,22, 461.
20. Shiku, H.; Uchida, I.; Matsue, T.; Langmuir1997, 13, 7239. 21. Yi-Fu, Y.; Denuault, G.; J. Chem. Soc., Faraday Trans.1996, 92,
3791.
22. Bartlett, P. N.; Denuault, G.; Sousa, M, F. B.; Analyst2000,
125, 1135.
23. http://www.chinstruments.com/chi900.html accessed in November 2010.
24. Agraz, R.; Miguel, J.; Sevilla, M. T.; Hernandez, L.; Anal. Chim. Acta1993,273, 205.
25. Shuman, M. S.; Woodward, G. P.; Anal. Chem. 1976,48, 1979. 26. C-Sánchez, C.; P-Peña, J.; G-Caballero, M. D.; H-Melian, J. A.;
H-Brito, J. J.; Anal. Chim. Acta1996,320, 19.
27. Agraz, R.; Miguel, J.; Sevilla, M. T.; Hernandez, L.;
Electroanalysis1996,8, 565.
28. Bard, A. J.; Fu-Ren, F.; Mirkin, M. V. In Electroanalytical Chemistry: A Series of Advances; Bard, A. J.; Rubinstein, I., eds., Marcel Dekker, Inc.: New York, 1994, vol. 18, p. 234. 29. Kariuki, S.; Dewald, H. D.; Electroanalysis1996,8, 307. 30. Nila, C.; Gzález, I.; J. Electroanal. Chem. 1996, 401, 171. 31. Itagaki, M.; Takaki, M.; Watanabe, K.; J. Electroanal. Chem.
1997, 440, 139.
32. Shah, S.; Grugel, R. N.; Lichter, B. D.; J. Appl. Electrochem. 1991, 21, 1013.
Submitted: August 11, 2010
Published online: February 15, 2011