Fish assemblages in a coastal bay adjacent to a network of marine protected
areas in southern Brazil
Baía Norte (North Bay) in Santa Catarina State is
considered a typical coastal bay and is surrounded by
a network of Marine Protected Areas. The objectives
of this study were to describe the composition of
the demersal ish assemblage, identify seasonal
and spatial structures on a ine scale and evaluate
the role of habitat descriptors and abiotic variables
afecting the ish assemblage structure. Seasonal
samplings were conducted in 2005, using bottom
trawls in six pre-established areas in Baía Norte in
summer, fall, winter and spring. Simultaneously
with each trawl, environmental data were collected
with a multiparameter probe. Temporal and spatial
diferences in ish abundance were tested by a
PERMANOVA. To illustratethe diferences detected
graphically we ran a canonical analysis of principal
coordinates (CAP). The inluence of environmental
variables on the ish fauna was evaluated using a
Distant Based Linear Model (DistLM) with Akaike’s
information criterion (AIC). A total of 9,888
specimens, distributed in 27 families and 62 species,
were collected. Citharichthys spilopterus was the
most abundant species. PERMANOVA detected
diferences for abundance between seasons, areas
and interaction among all the factors. The DISTLM
selected temperature and pH. The results highlight
seasonality as an important factor in the structuring
of ish fauna of the study place.
AbstrAct
André Pereira Cattani
1*, Fábio Gonçalves Daura Jorge
2, Gisela Costa Ribeiro
1, Leonardo Liberali
Wedekin
3, Paulo César de Azevedo Simões Lopes
4, Gabriel Martín Rupil
1, Henry Louis Spach
11 Centro de Estudos do Mar, Universidade Federal do Paraná
(Av. Beira Mar S/N Caixa Postal 50002, 83255-000, Pontal do Paraná, Paraná, Brasil) 2 Universidade do Estado de Santa Catarina
(Avenida Madre Benvenuta, 2007 - Itacorubi, Florianópolis, SC, 88035-001) 3 Socioambiental Consultores Associados, Meio Ambiente
4 Universidade Federal de Santa Catarina
(R. Eng. Agronômico Andrei Cristian Ferreira, s/n - Trindade, Florianópolis, SC, 88040-900)
*Corresponding author: [email protected]
Descriptors:
Norte Bay, Ichthyofauna, Santa Catarina
Island.
A Baía Norte em Santa Catarina, é considerada
como uma típica baía costeira, rodeada por uma
rede de Áreas Marinhas Protegidas. Este estudo teve
como objetivos descrever a composição e estrutura
da comunidade de peixes, testar a inluência dos
padrões espaciais e sazonais e avaliar a inluência
das variáveis abióticas nos padrões de abundância.
Amostragens sazonais foram realizadas por meio de
arrasto de fundo em seis áreas predeinidas da Baía
Norte no verão, outono, inverno e primavera no ano
de 2005. Simultaneamente, foram coletados dados do
ambiente com uma sonda multiparâmetro. Diferenças
temporais e espaciais na abundância de peixes foram
testados por uma análise PERMANOVA. Para
visualizar graicamente as diferenças encontradas
na PERMANOVA, foi realizada a análise canônica
de coordenadas principais (CAP). Para avaliar a
inluência de variáveis ambientais sobre a fauna de
peixes, foi aplicado um DISTLM usando critério de
informação de Akaike (AIC). Foram coletados 9.888
espécimes, distribuídos em 27 famílias e 62 espécies.
Citharichthys spilopterus
foi a espécie dominante. A
PERMANOVA detectou diferenças na abundância
entre estações, áreas e interação entre todos os
fatores. O DISTLM selecionou a temperatura e pH.
Os resultados enfatizam a sazonalidade como um
fator importante para a estruturação da fauna de
peixes do local de estudo.
resumo
Descritores:
Baía Norte, Ictiofauna, Ilha de Santa
Catarina.
INTRODUCTION
Fish distribution patterns are shaped on diferent time scales that range from circadian or nictemeral cycles to interannual variations (MACI; BASSET, 2009), and interfere with ecological processes such as recruitment and reproduction (GARCIA et al., 2001; GREENWOOD;
HILL, 2003; JAUREGUIZAR et al., 2004). In spatial terms, ish assemblage composition is organized on hierarchical scales, varying from meters to thousands of kilometers. On a regional scale (hundreds to thousands of kilometers), diferent factors structure an assemblage and these include the latitudinal temperature gradient, width and length of the estuary, vegetation cover (swamps and marshes), tidal range, rainfall and distance between estuaries and interfere with larval dispersal and species recruitment processes (BLABER, 2000; HARRISON; WHITIFIELD, 2006; SHEAVES; JOHNSTON, 2009; VILAR et al., 2013). On a local scale, salinity, dissolved oxygen and transparency are key factors afecting the occurrence of assemblages (BARLETTA et al., 2005; VILAR et al., 2011; 2013).
Human inluence also alters spatio-temporal distribution patterns of ish assemblages. In estuarine and lagoon habitats, ish assemblages are potentially impacted by many anthropogenic activities with direct inluence on food resources, distribution, diversity, reproduction, abundance, growth, survival and behavior of both resident and migratory species (MCDOWALL, 1988; ELLIOT; QUINTINO, 2007; BREHMER et al., 2013). Estuaries and coastal ecosystems are areas susceptible to the waste dumping and sewage discharge of a growing human population in the coastal zone (KENNISH, 1990), and are, further, still sufering from the efects of overishing and tourism, as well as urbanization, agriculture, aquaculture and industrial development (RAZ-GUZMA; HUIDOBRO, 2002). Because of their position in the catchment area, these environments are among the most impacted by human activities (CABRAL et al., 2001; LOBRY et al., 2003).
Studies of the composition and structure of ish assemblages and the spatial and temporal variations in estuarine and coastal environments on the Brazilian coast are focused mainly in subtropical and temperate areas (BARLETTA et al., 2005). A recent comparative study of the ish assemblages in ive estuaries along the Brazilian coast (Curuçá, Santa Cruz, Piraquê-Açú, Paranaguá and Lagoa dos Patos) found higher variability between estuaries than between the samples within each estuary, and showed that the composition of the assemblages
is structured by both environmental factors (physical, hydrological and geographical characteristics of estuaries) and biological factors (larval recruitment and dispersal ability of species) (VILAR et al., 2013).
In southern Brazil, studies on ish assemblages in coastal environments, particularly estuaries, are more numerous in relation to the coast of the states of Rio Grande do Sul (GARCIA; VIEIRA, 2001a; GARCIA et al., 2001b; RAMOS; VIEIRA, 2001; GARCIA et al., 2003; BURNS et al., 2006) and Paraná (SPACH et al., 2004; OTERO et al., 2006; FALCÃO et al., 2006; SPACH et al., 2006; 2007; CONTENTE et al., 2011). The
state of Santa Catarina has a strong ishing vocation but studies on ish assemblages on its coast are less common (MONTEIRO-NETO et al., 1990; RIBEIROet al., 1997; 1999; BARREIRO et al., 2009, VILAR et al., 2011; RIBEIROet al., 2014). This study was, therefore, designed to ill the current information gap, as well as to contribute to the understanding of ecological processes involving the ish assemblage in the Baia Norte, a coastal bay adjacent to a network of Marine Protected Areas on the central coast of Santa Catarina State. The main objectives were to: (1) describe the composition of the demersal ish assemblage; (2) identify seasonal and spatial structures on a ine scale; and (3) evaluate the role of habitat descriptors and abiotic variables afecting the ish assemblage structure. Ultimately, this information may provide support for future management plans and/or actions for the adjacent MPAs in the area; and increase ecological knowledge of ish assemblages on tropical and subtropical coasts.
MATERIAL AND METHODS
Study area
The North Bay (Baia Norte) of the island of Santa Catarina (27°30’ S; 48°35’ W), southern Brazil (Fig. 1), is considered a typical coastal bay (SORIANO-SIERRA; SIERRA DE LEDO, 1998). It is a protected bay delimited by a mosaic of rocky shores, sandy beaches and mangrove areas. Its oceanographic parameters are similar to those of the adjacent open waters (SIMONASSI et al., 2010). Tidal and drift currents as well as the inlow of freshwater exercise considerable inluence on the dynamics of this ecosystem. The bay has a surface area of approximately 200 km2, average depth of 5 m and a maximum depth
is silt and mud. The tidal range is of approximately 1 m (SORIANO-SIERRA, 1999).
Our study area is surrounded by three Marine Protected Areas with diferent degrees of restriction: the Arvoredo Marine Biological Reserve (Arvoredo Reserve), the Anhatomirim Environmental Protection Area (Anhatomirim EPA) and the Carijós Ecological Station (Carijós Station). The Arvoredo Reserve is a no-take reserve created in 1990 (Decree 99142), located in adjacent coastal waters. The Carijós Station (Decree 94656), created in 1987, is also very restrictive to any resource use and visitation, and covers mainly mangrove and estuarine habitats within Baia Norte. The Anhatomirim EPA was created in 1992 (Decree 528) with the main purpose of protecting a resident Guiana dolphin population in North Bay (padronizar North Bay or Baia Norte!). It is a multiple-use protected area, which means that some resource use is permitted inside the MPA, but under speciic regulations.
Sampling
Seasonal samplings were conducted in 2005. Using a 6-meter boat, bottom trawls were performed for 30 minutes in six pre-established areas in the North Bay (Figure 1) in the four seasons. The central month of each season was chosen as the sampling period, with samples taken on four non-consecutive days (at weekly intervals). Six trawls were performed on each day. Thus, 96 samples were obtained (6 trawls X 4 days X 4 months). Simultaneously with each trawl, salinity, temperature and pH were measured by means of a multiparameter probe. Rainfall data were provided by the Empresa de Pesquisa
Agropecuária e Extensão Rural de Santa Catarina (EPAGRI). Trawl net mesh sizes were 2.5 cm between opposite knots at the codend and 4 cm at the mouth, width of 8.65 m and height of 1.80 meters (15.57 m2 opening).
Statistical analysis
Sampling months were grouped into four seasons: summer (December, January and February); fall (March, April and May); winter (June, July and August); and spring (September, October and November).
For data analysis, the analytical model used was complex: X = μ + Sea + Sec + Are (Sec) + Sea * Are (Sec) + e, where X = dependent variable; μ = mean; Sea = season, Sec = Sector, Are = area; e = error or residue. This model was used to test the diferences between environmental parameters and population parameters of ish between seasons (summer, winter, fall and spring), between areas (A, B, C, D, E and F) and sectors (north = areas A, B and C; south = areas D, E and F). The factors season and sector were ixed and the factor area was random, nested within the factor sector.
Temporal and spatial diferences in ish abundance were tested by a multivariate analysis of variance using permutations (PERMANOVA - Permutational multivariate analysis of variance) (ANDERSON et al., 2008). A pairwise PERMANOVA was applied to a posteriori comparisons between factors showing signiicant diferences in PERMANOVA (p-value <0.05).
For graphical illustration of the diferences detected we ran a canonical analysis of principal coordinates (CAP), which generates graphic clusters through permutation (ANDERSON et al., 2008). Within the CAP analysis,
correlation Spearman at 0.4 was set to determine which species (vectors) were responsible for the clusters.
The diferences in environmental parameters were also tested by a PERMANOVA. To evaluate the inluence of environmental variables on the variability of ish data and to select the best explanatory model, we applied a DISTLM (Distance-Based Linear Model) using Akaike’s
information criterion (AIC) (ANDERSON et al., 2008). A stepwise procedure was adopted to test the importance of the independent variables. Environmental data were log-transformed (log (x + 1)) and biotic data were square root transformed (CLARKE; WARWICK, 1994). Redundancy Analysis (dbRDA - distance-based redundancy analysis) was used to examine the inluence of predictor variables on the spatial distribution of samples (ANDERSON et al., 2008). In all analyses, 9999 permutations were made. The similarity index used for abundance data was the Bray-Curtis coeicient. The PERMANOVA for environmental variables was run on the basis of the similarity matrix obtained by Euclidean distance.
To assess the taxonomic diferences between seasons in the area and determine the seasons with higher taxonomic complexity, we calculated the indices of Average Taxonomic Distinctness (Delta+ or AvTD) and Variation in Taxonomic Distinctness (Lambda+ or VarTD) with the presence/absence matrix (CLARKE; WARWICK, 1994).
To observe graphically whether the values of Average Taxonomic Distinctness and Variation in Taxonomic Distinctness of the seasons are within the expected taxonomic ranges, we constructed a funnel plot of AvTD and VarTD. We also prepared a biplot graphic display with both indices on each axis of the graph. A 95% probability ellipse of species was superimposed on the biplot graphic display.
Taxonomic diferences between the seasons were tested by univariate PERMANOVA, with the species richness, values of AvTD and VarTD as dependent variables and seasons as ixed factor.
RESULTS
Environmental variables
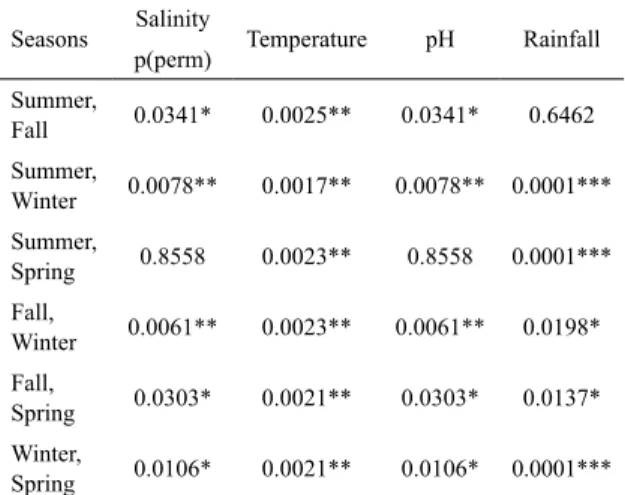
The PERMANOVA run individually for each environmental variable (salinity, temperature, pH and rainfall) detected signiicant diferences (p < 0.05) among
seasons, with no diferences among areas and sectors. In the paired comparison by pairwise PERMANOVA, in relation to salinity and pH, except for the summer and
spring, signiicant diferences were detected between the other seasons (Table 1). For rainfall, there were no diferences, except between summer and fall, and for temperature, there were diferences between the four seasons.
Table 1. Pairwise PERMANOVA on the basis of the Euclidean distance of salinity, temperature and rainfall, log transformed log (X + 1) and pH, comparing the seasons (summer, winter, fall and spring).
Seasons Salinity Temperature pH Rainfall p(perm)
Summer,
Fall 0.0341* 0.0025** 0.0341* 0.6462 Summer,
Winter 0.0078** 0.0017** 0.0078** 0.0001*** Summer,
Spring 0.8558 0.0023** 0.8558 0.0001*** Fall,
Winter 0.0061** 0.0023** 0.0061** 0.0198* Fall,
Spring 0.0303* 0.0021** 0.0303* 0.0137* Winter,
Spring 0.0106* 0.0021** 0.0106* 0.0001***
p < 0.05*; p < 0.01***; p < 0.0001***
Higher mean values of salinity were observed in the fall (mean ± SD, 36.21 ± 1.47), followed by summer (35.25 ± 0.85), spring (35.21 ± 0.88) and winter (32.67 ± 3.24) (Figure 2a). In descending order, higher mean values of temperature were found in summer (25.60 ± 0.62), spring (24.18 ± 1.03), fall (22.48 ± 1.44) and winter (19.4 ± 1.24) (Figure 2b). Regarding the pH, higher mean values were registered in spring (8.56 ± 0.08), winter (8.19 ± 0.08), fall (7.5 ± 0.49) and summer (7.21 ± 0.64) (Figure 2c). Regading rainfall, higher mean values were veriied in winter (212.95 ± 40.6 mm), followed by fall (174.8 ± 84.04 mm), summer (126.3 mm ± 1.77) and spring (86.2 mm ± 5.92) (Figure 2d).
Fish assemblage
Figure 2. Mean values (standard errors on the bars) for salinity, temperature, pH and rainfall comparing the seasons and the six collection areas (A,
B, C, D, E and F) in the North Bay
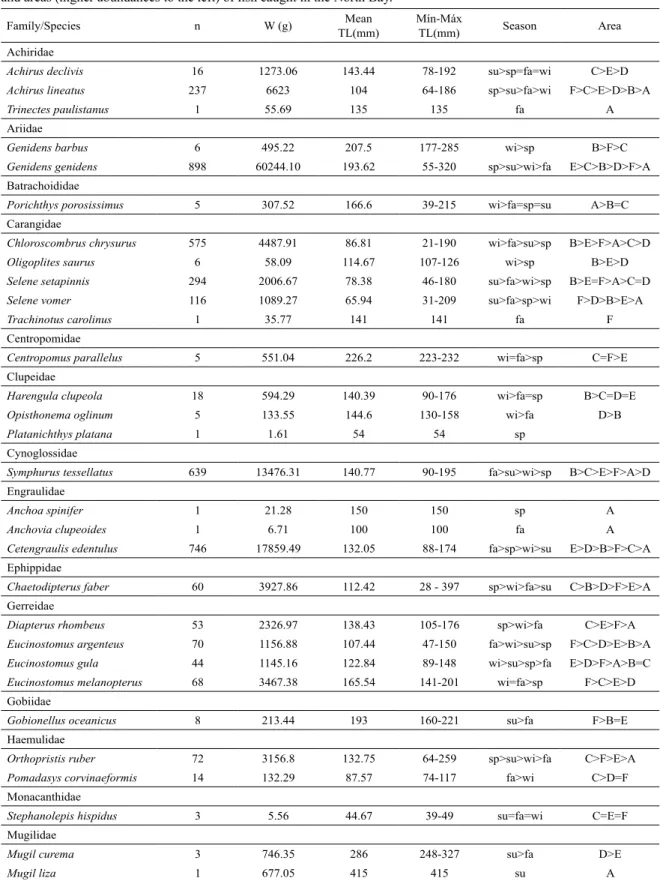
Sciaenidae (1,820), Carangidae (992), Ariidae (904), Engraulidae (748), Cynoglossidae (639), Achiridae (254), Triglidae (252), Gerreidae (235) and Pristigasteridae (191). As for the weight, the greatest catches (ten dominant families) were found for Paralichthyidae (63,865.2 g), Ariidae (60,739.2 g), Sciaenidae (33,238.9 g), Engraulidae (17,887.5 g), Cynoglossidae (13,476.3 g), Trichiuridae (8,526.24 g), Gerreidae (8,096.39 g), Achiridae (7,951.75 g), Carangidae (7,677.71 g) and Triglidae (5,481.44 g).
In descending order, Citharichthys spilopterus, Genidens genidens, Stellifer rastrifer, Cetengraulis edentulus, Symphurus tessellatus, Chloroscombrus chrysurus, Micropogonias furnieri, Etropus crossotus, Selene setapinnis and Ctenosciaena gracilicirrhus were dominant in number of individuals, representing 80% of the total catch (abundance), while the catch of C. spilopterus alone corresponded to approximately 30% of
the total. Anchoa spinifer, Anchovia clupeoides, Macrodon ancylodon, Mugil liza, Ophichthus gomesii, Paralichthys brasiliensis, Platanichthys platana, Trachinotus carolinus
and Trinectes paulistanus were caught only once (Table 2).
The total catch in weight was 254,075.78 g (Table 2).
G. genidens, C. spilopterus, C. edentulus, S. tessellatus, M. furnieri, S. rastrifer and E. crossotus corresponded,
in descending order, to approximately 70% of the total weight. G. genidens and C. spilopterus amounted to 45%
of the total catch in weight.
A total of 29 species were caught in all the seasons and 12 species in only one of the seasons. There was a greater richness in the fall (50 species), followed by the
spring (45 species), winter (43 species) and summer (41 species) (Table 2).
Regarding areas, 25 species occurred in the six areas and 11 species presented exclusive occurrence in a single area. The highest species richness occurred in area C (44 species), followed by areas F (42), E (41), A (40) and B and D (38 species each). Six species occurred exclusively in area A and only two species in area F. In the other areas, there was only one exclusive species (Table 2)
PERMANOVA detected signiicant diferences (p < 0.05) for total abundance among seasons, areas and
interaction between all factors (seasons, areas and sector), with the higher abundance mean values in areas C and E in the fall and lower menans in area A in the winter and area D in the summer (Table 3 and Figure 3). In paired comparisons (pairwise PERMANOVA) within each season, major diferences between areas were observed in the spring, followed by winter, fall and summer (Table 4).
Diferences in mean values of abundance among seasons by PERMANOVA as well as species that have contributed to such diferences can be observed graphically in the canonical analysis of principal coordinates (CAP). The canonical correlation of the two axes obtained by the analysis was δ1 = 0.8052 and δ2 = 0.7909. There was a
Table 2. List of species, number of individuals (n), weight (W), mean, minimum and maximum total length (TL), season
and areas (higher abundances to the left) of ish caught in the North Bay.
Famíly/Species n W (g) Mean TL(mm)
Mín-Máx
TL(mm) Season Area Achiridae
Achirus declivis 16 1273.06 143.44 78-192 su>sp=fa=wi C>E>D
Achirus lineatus 237 6623 104 64-186 sp>su>fa>wi F>C>E>D>B>A
Trinectes paulistanus 1 55.69 135 135 fa A
Ariidae
Genidens barbus 6 495.22 207.5 177-285 wi>sp B>F>C
Genidens genidens 898 60244.10 193.62 55-320 sp>su>wi>fa E>C>B>D>F>A
Batrachoididae
Porichthys porosissimus 5 307.52 166.6 39-215 wi>fa=sp=su A>B=C
Carangidae
Chloroscombrus chrysurus 575 4487.91 86.81 21-190 wi>fa>su>sp B>E>F>A>C>D
Oligoplites saurus 6 58.09 114.67 107-126 wi>sp B>E>D
Selene setapinnis 294 2006.67 78.38 46-180 su>fa>wi>sp B>E=F>A>C=D
Selene vomer 116 1089.27 65.94 31-209 su>fa>sp>wi F>D>B>E>A
Trachinotus carolinus 1 35.77 141 141 fa F
Centropomidae
Centropomus parallelus 5 551.04 226.2 223-232 wi=fa>sp C=F>E
Clupeidae
Harengula clupeola 18 594.29 140.39 90-176 wi>fa=sp B>C=D=E
Opisthonema oglinum 5 133.55 144.6 130-158 wi>fa D>B
Platanichthys platana 1 1.61 54 54 sp
Cynoglossidae
Symphurus tessellatus 639 13476.31 140.77 90-195 fa>su>wi>sp B>C>E>F>A>D
Engraulidae
Anchoa spinifer 1 21.28 150 150 sp A
Anchovia clupeoides 1 6.71 100 100 fa A
Cetengraulis edentulus 746 17859.49 132.05 88-174 fa>sp>wi>su E>D>B>F>C>A
Ephippidae
Chaetodipterus faber 60 3927.86 112.42 28 - 397 sp>wi>fa>su C>B>D>F>E>A
Gerreidae
Diapterus rhombeus 53 2326.97 138.43 105-176 sp>wi>fa C>E>F>A
Eucinostomus argenteus 70 1156.88 107.44 47-150 fa>wi>su>sp F>C>D>E>B>A
Eucinostomus gula 44 1145.16 122.84 89-148 wi>su>sp>fa E>D>F>A>B=C
Eucinostomus melanopterus 68 3467.38 165.54 141-201 wi=fa>sp F>C>E>D
Gobiidae
Gobionellus oceanicus 8 213.44 193 160-221 su>fa F>B=E
Haemulidae
Orthopristis ruber 72 3156.8 132.75 64-259 sp>su>wi>fa C>F>E>A
Pomadasys corvinaeformis 14 132.29 87.57 74-117 fa>wi C>D=F
Monacanthidae
Stephanolepis hispidus 3 5.56 44.67 39-49 su=fa=wi C=E=F
Mugilidae
Mugil curema 3 746.35 286 248-327 su>fa D>E
Muraenidae
Gymnothorax ocellatus 3 625.61 489.33 480-498 sp>fa B>E
Ophichthidae
Ophichthus gomesii 1 84.27 441 441 su C
Paralichthyidae
Citharichthys spilopterus 2955 55281.16 120.41 40-198 wi>fa>sp>su E>C>B>D>F>A
Etropus crossotus 340 8583.99 94.32 55-132 fa>wi>sp>su D>C>F>B>E>A
Paralichthys brasiliensis 1 0 482 482 wi
Pristigasteridae
Pellona harroweri 191 2814.9 101.86 57-175 fa>sp>su>wi B>C>A>F>D>E
Rhinobatidae
Zapteryx brevirostris 2 1073.4 412 360-464 fa=sp A=C
Sciaenidae
Ctenosciaena gracilicirrhus 273 4153.93 100.97 62-138 fa>su>sp>wi E>C>A>F>D>B
Cynoscion jamaicensis 42 520.23 99.52 60-180 fa>su>wi C>A>B>E>D>F
Cynoscion leiarchus 5 117.24 131.2 113-147 su>fa D>E
Cynoscion microlepidotus 115 997.06 87.89 41-199 su>fa E>C>B>D>A>F
Isopisthus parvipinnis 16 551.33 136.88 66-190 fa>su>sp>wi A>C>B=F
Macrodon ancylodon 1 0.68 55 55 A
Menticirrhus americanus 56 5358.68 186.07 88-408 su>sp=fa=wi F>C>B>D>E>A
Micropogonias furnieri 448 10278.52 118.53 55-223 su>sp>fa>wi B>C>D>E>F>A
Odontoscion dentex 2 26.1 98.5 78-119 su B
Paralonchurus brasiliensis 106 1322.85 111.89 45-194 sp>su>wi>fa A>B>C=D
Stellifer brasiliensis 5 27.21 84.8 70-97 su=sp>fa A>B
Stellifer rastrifer 747 9858.69 99.08 33-178 fa>su>sp>wi C>B>F>A>E>D
Umbrina coroides 3 3.09 46.33 45-47 wi A
Serranidae
Diplectrum radiale 31 2458.53 176.84 139-213 wi>fa>sp=su E>F>C=D>A
Sparidae
Archosargus rhomboidalis 21 2696.67 192.52 131-245 su>sp=wi>fa E>C>F
Stromateidae
Peprilus paru 41 1336.7 98.1 24-220 fa>sp>su>wi B>A>E>D>C=F
Synodontidae
Synodus foetens 21 1864.93 231.81 114-309 fa>sp>wi>su E>C>F>D
Tetraodontidae
Lagocephalus laevigatus 34 457.26 83.5 47-148 sp>su>wi B>D>A=C=F>E
Sphoeroides sp. 2 26.45 84 80-88 sp F
Sphoeroides greeleyi 6 94.83 90.67 56-106 sp D
Sphoeroides spengleri 34 210.88 64 28-113 sp>fa>su C>E>F>A=D>B
Sphoeroides testudineus 29 2704 137.38 28-242 sp>fa>su>wi C>D>E>F>B>A
Sphoeroides tyleri 45 262.58 59.04 31-93 wi>fa>sp D>B=E>C>A=F
Trichiuridae
Trichiurus lepturus 93 8526.24 388.4 67-1180 su>sp>fa>wi C>A>F>B>E>D
Triglidae
Prionotus punctatus 252 5481.44 109,71 35-187 su>fa>sp>wi E>B>F>C=D>A
TOTAL 9888 254075.78
Table 3. PERMANOVA based on Bray-Curtis similarity for total abundance (transformed into square root) of ish caught in
the North Bay. Factors: season = Ses, sector = Sec and area = Are (Sec). df = degrees of freedom; MS = sum of mean squares.
Source df MS Pseudo-F p(perm)
Sea 3 8501.4 3.5741 0.0001
Sec 1 10110 1.8125 0.303
Are(Sec) 4 5578.2 3.9197 0.0001
Sea x Sec 3 2914.2 1.2252 0.2164
Sea x Are(Sec) 12 2378.6 1.6714 0.0001
Res 72 1423.1
Table 4. Pairwise PERMANOVA comparing areas in each season based on Curtis similarity for total abundance (transformed
into square root) of ish caught in the North Bay.
Winter Spring Fall Summer
Area P(perm)
A, B 0.0283* 0.0305* 0.8261 0.0832
A, C 0.0315* 0.0277* 0.082 0.1478
A, D 0.0275* 0.0296* 0.0252* 0.4508
A, E 0.0302* 0.03* 0.0599 0.082
A, F 0.0284* 0.029* 0.1188 0.1661
B, C 0.0306* 0.027* 0.0853 0.0286*
B, D 0.0285* 0.0292* 0.0286* 0.0831
B, E 0.0267* 0.0274* 0.0257* 0.1142
B, F 0.0288* 0.028* 0.0269* 0.374
C, D 0.0287* 0.0847 0.1143 0.3432
C, E 0.0597 0.0307* 0.0596 0.1967
C, F 0.0266* 0.0293* 0.2641 0.0876
D, E 0.1685 0.0871 0.14 0.457
D, F 0.0305* 0.2917 0.0573 0.3632
E, F 0.0615 0.2063 0.2596 0.7462
p < 0.05*.
Figure 3. Mean values (standard error on the bars) of the square root of the abundance of ish caught in winter, fall, spring and summer in areas A,
were responsible for such diferences (Figure 4). In relation to the areas, the CAP plot demonstrated a clear separation of samples taken in areas A, B and C and a grouping of areas D, E and F (Figure 5). The high abundance of
E. melanopterus and A. lineatus in these three areas (D, E
and F) and of L. laevigatus in area B were responsible for the pattern observed (Figure 5). The canonical correlation of the two axes given by the analysis was de δ1 = 0.8282
and δ2 = 0.6727.
Figure 4. Results of the canonical analysis of principal coordinates (CAP) for the species of the North Bay that contributed to the
diferences between seasons (Summer = Su; Fall = Fa; Winter = Wi; Spring = Sp). Vector of species based on Spearman correlation values > 0.5.
The linear model selected by DISTLM included the temperature and pH as determinants for the variation of numerical abundance. Despite the signiicance of all the predictor variables in the model, the higher percentages of explanation were observed for the selected variables (Table 6). The graphical response of DISTLM provided by dbRDA pointed to a relationship of temperature with summer and fall samples (axis 1), and of pH with spring samples (axis 2; Figure 6).
Figure 5. Result of the canonical analysis of principal coordinates (CAP) for the species of the North Bay that contributed to the
diferences between areas. Vector of species based on Spearman correlation values > 0.5 (p > 0.5).
Table 5. Result of the DISTLM analysis with p-value of the permutation and the percentage of explanation of variables for the selected model.
Variable P (Perm) Proportion
Rainfall 0.0074 2.49E-02
Temperature 0.0002 4.92E-02
pH 0.0001 4.63E-02
Salinity 0.0299 2.21E-02
Table 6. Result of univariate PERANOVA for richness,
taxonomic distinctness (AvTD) and variation in taxonomic distinctness (VarTD) for the North Bay, with season as factor.
Source df MS Pseudo-F p (perm)
Richness Season 3 106.4 0.73123 0.5686 Res 92 145.29
AvTD Season 3 0.64927 0.79938 0.7209 Res 92 0.81222
VarTD Season 3 3.8144 0.5753 0.6506
Res 92 6.6302
Figure 6. Result of the redundancy analysis based on the linear
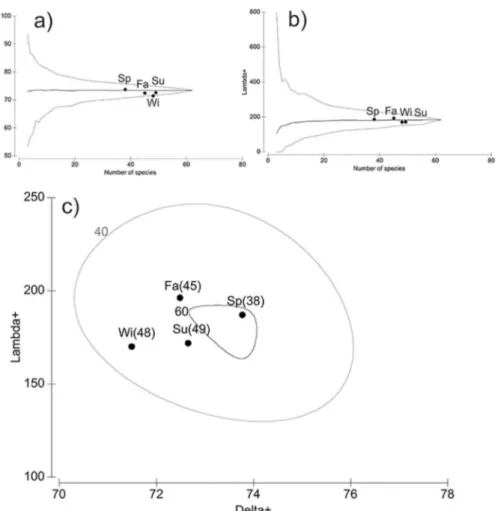
Regarding the indices of average taxonomic distinctness (Delta+) and variation in taxonomic distinction (Lambda+), associated with species richness, the PERANOVA indicated no signiicant diferences for any of the variables and a similar taxonomic structure among seasons (Table 6). This is conirmed by the graphic result of the indices Lambda+ and Delta+, whose values were within the 95% conidence interval, calculated in 1000 simulations for each index (Figures 7a and 7b). Nevertheless, for Delta+, we observed that the fall, winter and summer samples were below the values expected (Figure 7a). For Lambda+, winter and summer samples were below the average (Figure 7b). The biplot graph of both indices showed that the Delta+ and Lambda+ of the spring were high (Figure 7c). For this last index, the value is greater than in summer and winter and lower than in fall. The location of the spring samples within the ellipse of 95% probability of occurrence of 60 species (S = 60) is a relection of the high variation in taxonomic distinctness, despite having the highest average taxonomic distinctness, when compared with the other months. On the other hand, winter samples had a lower average taxonomic distinctness, i.e., a lower diversity in taxonomic structure; the variability is lower due to the low variance in the taxonomic distinction.
DISCUSSION
In North Bay, seasonality was pronounced, given the signiicant diferences in salinity, temperature, pH, and rainfall during the sampling year. Regarding rainfall index, an uncommon pattern was observed in 2005, with high levels of rainfall in winter. Despite this, the seasonal pattern expected for the area was maintained, since it is a temperate region with clear distinction between the warm seasons (spring and summer) and cold seasons (fall and winter). Spatially, the environmental parameters showed no signiicant variation. When evaluating their inluence on ish abundance, by means of DistLM, it was observed that all parameters especially temperature and pH signiicantly inluenced the abundance. Temperature is directly related to seasonality and has a direct efect on the metabolic and reproductive processes of ish fauna. In its turn, pH variation is more conditioned by the inlow of freshwater, mainly from mangrove areas, which are rich in humic and fulvic acids, responsible for the acidiication of water (DAY; YAÑES-ARANCIBA, 1982; SIMONASSI et al., 2010). This pattern is consistent with the result of dbRDA,
whose positive correlation of pH has been associated with springtime, a period with the lowest indices of rainfall for the year sampled and hence a lower inlow of freshwater into the system.
With respect to the structure of assemblages, the dominance of a few species of demersal ish has also been registered in other studies on the southeastern and southern coasts of Brazil (ROSSI-WONGTSCHOWSKI; PAES, 1993; ARAÚJO et al., 2002; HOSTIM-SILVA et al., 2002; SCHWARZ JR. et al., 2006; AZEVEDO et al., 2007; QUEIROZ et al., 2007; BARLETTA et al., 2008; PINHEIRO et al., 2009; CARTAGENA et al., 2011). The dominance of a few species seems to be an ecological pattern of demersal assemblages or an efect of the selectivity of the ishing gear. The common predominance of the families Ariidae and Sciaenidae was not observed in North Bay. Despite the high occurrence of these families, there were higher abundances of Paralichthyidae and Sciaenidae.
Seasonal diferences in the abundance of the demersal ish fauna of the southeastern and southern regions are often observed (ROSSI-WONGTSCHOWSKI; PAES, 1993; HOSTIM-SILVA et al., 2002; ARAÚJO et al., 2002; AZEVEDO et al., 2007; QUEIROZ et al., 2007; BARLETTA et al., 2008; PINHEIRO et al., 2009; CARTAGENA et al., 2011), except for the ish fauna of the Pinheiros Bay, located in the Paranaguá estuarine complex (CEP) (SCHWARZ JR. et al., 2006). However, the lack of statistical seasonal diferences in ish abundance in the Pinheiros Bay does not seem to be a pattern for CEP, in view of signiicant temporal diferences on the main axis (east-west) of CEP (BARLETTA et al., 2008). Diferences between the spatial scales adopted in these studies seem to have inluenced seasonal patterns. In North Bay, high abundances were registered in the fall period and are probably a pattern for ish of the Southeastern and Southern coasts. The reproductive patterns, according to which the main species of the families Sciaenidae and Clupeidae spawn during the spring and summer, while recruiting in shallow areas, but which are still not part of demersal assemblages, might also explain such diferences. In autumn and winter, recruited ish have reached maturity and occupy deeper areas of estuaries (PINHEIRO et al., 2009), increasing the probability of capture by trawl.
Figure 7. Average taxonomic distinctness (AvTD - DELTA +) and variation in taxonomic distinction (VarTD - LAMBDA +) (b) calculated for the
North Bay per season (Summer = Su; Fall = Fa; Winter = Wi; Spring=Sp). For both indices, the expected average represented by the central dotted line and the 95% conidence interval limit is given by the surrounding funnel-shaped solid line. Biplot graphic display or LAMBDA+ and DELTA+ (c). The ellipse represents the value of the 95% conidence interval of the probability of inding 40 and 60 species, respectively.
abundance of approximately 40%. On the southeastern and southern coasts of Brazil, G. genidens, C. chrysurus
and P. puncatus are abundant (over 1%) in demersal
assemblages (AZEVEDO et al., 2007; QUEIROZ et al., 2007; BARLETTA et al., 2008. However, we registered high abundances of C. spilopterus in North Bay (the most abundant species in this area) and a low occurrence of S. rastrifer, which is not consistent with these ish surveys.
Although C. spilopterus is not commonly recorded in the demersal ish fauna of the southeastern and southern coasts of Brazil, it is a shallow-water species, living especially in estuarine areas (FIGUEREDO; MENEZES, 2000; FROSE; PAULY, 2014).
The highest abundance of C. spilopterus was found in fall and winter in North Bay. In Guaratuba Bay, this
was observed in the spring and summer, with spawning occurring in mangrove areas, in late spring and early summer (CHAVES; VENDEL, 1997). The high catch of
C. spilopterus may be associated with the presence of the mangroves of Itacorubi and Ratones on the bay’s shores. This is conirmed by the highest occurrences of this species in areas C and E, which are close to these mangroves.
were registered in all four seasons, mainly in summer and spring. Higher abundances of G. genidens occurred in the headwaters of the east-west axis of the Paranaguá Estuarine Complex, in fall and winter (BARLETTA et al., 2008). The numerous presence of G. genidens in shallow estuarine areas was also veriied in Sepetiba Bay (AZEVEDO et al., 1999; 2007). It is a predominantly estuarine species, inhabiting areas near rivers and displaying the ability to withstand high variations in salinity (FIGUEREDO; MENEZES, 1978; FROESE; PAULY, 2014). The highest abundances occurred in areas B, C and E, associated with the rivers Biguaçú (area B), Ratones (C, E) and Itacorubi (E). As for the sizes, higher values of total length (TL) were observed in fall and winter, which might coincide with the species’ reproductive activity.
C. chrysurus is another species with high abundances
in North Bay. It is a pelagic species occurring in estuaries and bays (MENEZES; FIGUEREDO, 1980; FROESE; PAULY, 2014). High abundances were also reported in the Paranaguá Estuarine Complex (BARLETTA et al., 2008) and in inner regions of Sepetiba Bay in spring and summer (ARAÚJO et al., 2002; AZEVEDO et al., 2007). The greatest abundance occurred in the winter in area B. Although diferences in abundance between seasons are distinct from those given by other studies, depths were shallow in both areas. The high incidence of pelagic species in shallow areas of Pinheiros Bay (SCHWARZ JR. etal., 2006) has already been observed. Thus, the high prevalence of this species may be related to the shallow depth of the sampled sites.
It may thus be concluded that seasonality has a structuring efect on the ish assemblage in North Bay. However, it remained unclear which is the main regulatory mechanism of assemblages. Although seasonal diferences are directly relected in the physical and chemical parameters of the water column, which, in turn, inluence the patterns of distribution and occurrence of demersal assemblages (BLABER; BLABER, 1980; MARSHALL; ELLIOT, 1998; BLABER, 2000; WHITFIELD et al., 2012), in North Bay, environmental gradients were not well-delimited, as is usually observed in estuarine areas. Possibly the ecological processes of reproduction, spawning and recruitment have greater inluence on the patterns of dominance, given the high abundance of smaller sized individuals of a few species. The results presented here highlight the importance of North Bay as a nursery of ish of commercial importance and others that may potentially feed the ish stocks of the network of
ACKNOWLEDGMENTS
We wish to thank the isher Lourenço for his help in data collection, as well as many other people for their help in the ield and the laboratory, specially Carlos Espírito Santos. FAPESC (Fundação de Amparo à Pesquisa e Inovação do Estado de Santa Catarina) provided inancial support for the data collection. CNPq provided a master’s scholarship for FDG and LLW and CAPES provided a PhD scholarship for APC.
REFERENCES
ANDERSON M. J.; GORLEY R. N.; CLARKE K. R. PERMANOVA + for PRIMER: guide to software and statistical methods. Plymouth: PRIMER-E, 2008.
ARAÚJO, F. G.; AZEVEDO, M. C. C.; PESSANHA, A. L.
M.; SILVA, M. A.; GOMES, I. D.; CRUZ-FILHO, A. G. Environmental inluences on the demersal ish assemblages in the Sepetiba Bay, Brazil. Estuaries, v. 25, n. 3, p. 441-450, 2002.
AZEVEDO, M. C. C; ARAÚJO, F. G.; CRUZ-FILHO, A. G.; GOMES, I. D.; PESSANHA, A. L. M. Variação espacial e temporal de bagres marinhos (Silurifomres, Ariidae) na Baía de Sepetiba, Rio de Janeiro. Rev. Bras. Biol., v. 59, n. 3, p. 443-454, 1999.
AZEVEDO, M. C. C.; ARAÚJO, F. G.; CRUZ-FILHO, A. G.; PESSANHA, A. L. M.; SILVA, M. A.; GUEDES, A. P. P. Demersal ishes in a tropical bay in southeastern Brazil: Partitioning the spatial, temporal and environmental components of ecological variation. Estuar. Coast. Shelf Sci., v. 75, n. 4, p. 468-480, 2007.
BARLETTA, M.; AMARAL, C. S.; CORRÊA, M. F. M.; GUEBERT, F.; DANTAS, D. V.; LORENZI, L.; SAINT-PAUL, U. Factors afecting seasonal variations in demersal ish assemblages at an ecocline in a tropical-subtropical estuary. J. Fish. Biol., v. 73, n. 6, p. 1314-1336, 2008. BARLETTA, M.; BARLETTA-BERGAN, A.; SAINT-PAUL,
U.; HUBOLD, G. The role of salinity in structuring the ish assemblages in a tropical estuary. J. Fish. Biol., v. 66, n. 1, p. 45-72, 2005.
BARREIROS, J. P.; BRANCO, J. O.; FREITAS JUNIOR, F; MACHADO, L. F.; HOSTIM-SILVA, M.; VERANI, J. R. Space-time distribution of the ichthyofauna from Saco da Fazenda Estuary, Itajaí, Santa Catarina, Brazil. J. Coastal. Res., v. 25, p. 1114-1121, 2009.
BLABER, S. J. M. Tropical estuarine ishes: ecology, exploitation and conservation. Oxford: Blackwell Science, 2000. 372 p. BLABER, S. J. M.; BLABER, T. G. Factors afecting the
distribution of juvenile estuarine and inshore Fish. J. Fish. Biol., v. 17, n. 2, p. 143-162, 1980.
BREHMER, P.; LAUGIER, T.; KANTOUSSAN, J.; GALGANI, F.; MOUILLOT, D. Does coastal lagoon habitat quality afect ish growth rate and their recruitment? Insights from ishing and acoustic surveys. Estuar. Coast. Shelf Sci., v. 126, p. 1-6, 2013.
between the Patos and Mirim coastal lagoons in southern Brazil. Neotrop. Ichthyol., v. 4, n. 1, p. 69-72, 2006. CABRAL, H. N.; COSTA, M. J.; SALGADO, J. P. Does the
Targus estuary ish community relect environmental changes? Clim. Res., v. 18, p. 119-126, 2001.
CARTAGENA, B. F. C.; HOSTIM-SILVA, M.; SPACH, H. L. Distribuição espacial da ictiofauna demersal no Saco dos Limões (Baía Sul, Florianópolis, SC). Bioikos, v. 25, n. 2, p. 117-128, 2011.
CHAVES, P. T. C.; VENDEL, A. L. Indicadores reprodutivos das espécies de Citharichthys Bleeker (Teleostei,
Pleuronectiformes) na Baia de Guaratuba, Paraná, Brasil. Rev. Bras. Zool., v. 14, n. 1, p. 73-79, 1997.
CLARKE, K. R.; WARWICK, R. W. Change in marine communities: an aproach to statistical analysis and interpretation. Plymouth: Plymouth Marine Laboratory, 1994. 144 p.
DAY JR, J. W.; YÁÑEZ-ARANCIBIA, A. Coastal lagoon and estuarines: ecosystem approach. Ciênc. Interam., v. 22, n. 1-2, p. 11-26, 1982.
ELLIOTT, M.; QUINTINO, V. The Estuarine Quality Paradox, Environmental Homeostasis and the diiculty of detecting anthropogenic stress in naturally stressed areas. Mar. Pollut. Bull., v. 54, n. 6, p. 640-645, 2007.
ENTE, R. F.; STEFANONI, M. F.; SPACH, H. L. Feeding ecology of the Brazilian silverside Atherinella brasiliensis
(Atherinopsidae) in a sub-tropical estuarine ecosystem. J. Mar. Biol. Assoc. U. K., v. 91, n. 6, p. 1197-1205, 2011. FALCÃO, M. G.; SARPÉDONTI, V.; SPACH, H. L.; OTERO,
M. E. B.; QUEIROZ, G. M. L. N.; SANTOS, C. A ictiofauna em planícies de maré das Baías de Laranjeiras e de Paranaguá, Paraná, Brasil. Rev. Bras. Zoocienc., v. 8, n. 2, p. 125-138, 2006.
FIGUEIREDO, J. L.; MENEZES, N. A. Manual de Peixes Marinhos do Sudeste do Brasil. II. Teleostei (1). São Paulo: Museu de Zoologia da Universidade de São Paulo, 1978, 110 p.
FIGUEIREDO, J. L.; MENEZES, N. A. Manual de peixes mari-hos do sudeste do Brasil. VI. Teleostei (5). São Paulo: Museu de Zoologia da Universidade de São Paulo, 2000. 116 p. FROESE, R. D.; PAULY, D. FishBase. World Wide Web
electronic publication. Available: < http://www.ishbase.org/ home.htm>. Accessed: 15 Oct. 2014.
GARCIA, A. M.; RASEIRA, M. B.; VIEIRA, J. P.; WINEMILLER, K. O.; GRIMM, A. M. Spatiotemporal variation in shallow-water freshwater ish distribution and abundance in a large subtropical coastal lagoon. Environ. Biol. Fishes., v. 68, n. 3, p. 215-228, 2003.
GARCIA, A. M.; VIEIRA, J. P. O aumento da diversidade de peixes no estuário da Lagoa dos Patos durante o episódio El Niño 1997-1998.Atlântica, v. 23, p. 133-152, 2001a. GARCIA, A. M.; VIEIRA, J. P.; WINEMILLER, K. O. Dynamics
of the shallow-water ish assemblage of the Patos Lagoon estuary (Brazil) during cold and warm ENSO episodes. J. Fish. Biol., v. 59, n. 5, p. 1218-1238, 2001b.
GREENWOOD, M. F. D.; HILL, A. S. Temporal, spatial and tidal inluences on benthic and demersal ish abundance in the Forth estuary. Estuar. Coast. Shelf Sci., v. 58, n. 2, p. 211-225, 2003.
HARRISON, T. D.; WHITFIELD, A. K. Temperature and salinity as primary determinants inluencing the biogeography of ishes in South Africa estuaries. Estuar Coast. Shelf Sci., v. 66, n. 1-2, p. 335-345, 2006.
HOSTIM-SILVA, M.; VICENTE, M. J. D.; FIGNA, V.; ANDRADE, J. P. Ictiofauna do rio Itajaí Açu, Santa Catarina, Brasil. Notas Téc. Facimar, v. 6, p. 127-135, 2002.
JAUREGUIZAR, A. J.; MENNI, R.; GUERREIRO, R.; LASTA, C. Environmental factors structuring ish communities of the Rio de la Plata estuary. Fish. Res., v. 66, n. 2/3, p. 195-211, 2004.
KENNISH, M. J. Ecology of estuaries. Boca Raton: CRC Press, 1990.
LOBRY, J.; MOURAND, L.; ROCHARD, E.; ELIE, P. Structure of the Gironge estuarine ish assemblages: a comparison of European estuaries perspective. Aquat. Living Resour., v. 16, n. 2, p. 47-58, 2003.
MACI, S.; BASSET, A. Composition, structural characteristics and temporal patterns of ish assemblages in non-tidal Mediterranean lagoons: A case study. Estuar. Coast. Shelf Sci., v. 83, n. 4, p. 602-612, 2009.
MARSHALL, S.; ELLIOTT, M. Environmental Inluences on the Fish Assemblage of the Humber Estuary, U.K. Estuar. Coast. Shelf Sci., v. 46, n. 2, p. 175-184, 1998.
MC DOWALL, R. M. Diadromy in ishes, migrations between freshwater and marine environments. Portland: Timber Press, 1988.
MENEZES, N. A.; FIGUEIREDO, J. L. Manual de peixes marinhos do sudeste do Brasil. IV. Teleostei (3). São Paulo: Museu de Zoologia da Universidade de São Paulo, 1980. 96 p.
MONTEIRO-NETO, C.; BLACHER, C.; LAURENT, A. A. S.; SNIZEK, F. N.; CANOZZI, M. B.; TABAJARA, L. L. C. Estrutura da comunidade de peixes de águas rasas na região de Laguna, Santa Catarina, Brasil. Atlântica, v. 12, n. 2, p. 53-69, 1990.
OTERO, M. E. B.; SPACH, H. L.; PICHLER, H. A.; QUEIROZ, G. M. N.; SANTOS, C.; SILVA, A. L. C. O uso de atributos das assembleias de peixes para avaliar a integridade biótica em habitats rasos das Baías de Antonina e Paranaguá, Paraná. Acta Biol. Par., v. 35, n. 1-2, p. 69-82, 2006.
PINHEIRO, H. T.; MARTINS, A. S.; ARAÚJO, J. N.; PINTO, A. S. S. Evidence of seasonal changes in community structure for a coastal ecosystem in the central coast of Brazil, south-west Atlantic. J. Mar. Biol. Ass. U. K., v. 89, n. 2, p. 217-224, 2009.
QUEIROZ, G. M. L. N., SPACH, H. L., SOBOLEWSKI-MORELOS, M.; SCHWARZ JUNIOR, R. A ictiofauna demersal de áreas com diferentes níveis de ocupação humana, no estuário de Paranaguá. Arq. Cienc. Mar., v. 40, n. 2, p. 80-91, 2007.
RAMOS, L. A.; VIEIRA, J. P. Composição especíica e abundância de peixes de zonas rasas dos cinco estuários do Rio Grande do Sul, Brasil. Bol. Inst. Pesca, v. 27, n. 1, p. 109-121, 2001.
RAZ-GUZMAN, A.; HUIDOBRO, L. Fish communities in two environmentally diferent estuarine systems of Mexico. J. Fish Biol., v. 60, p. 1-14, 2002.
da Conceição e área costeira adjacente, Ilha de Santa Catarina, SC, Brasil. Aquitaine Océan, v. 1, n. 3, p. 270-281, 1997. RIBEIRO, G. C.; CLEZAR, L.; SILVA, M. H. Comunidade ictíica,
sua variação espacial e sazonal na Lagoa da Conceição e área costeira, Ilha de Santa Catarina, SC, Brasil: o ecossistema da Lagoa da Conceição. Ser. Fepema, v. 4, p. 261-273, 1999. RIBEIRO, G. C.; SOETH, M.; ANDRADE, V. K.; SPACH, H.
L.; CATTANI, A. P. Nycthemeral and Monthly Occupation of the Fish Assemblage on a Sheltered Beach of Baía Norte, Florianópolis, Santa Catarina State, Brazil. Braz. J. Oceanogr., v. 62, n. 3, p. 209-223, 2014.
ROSSI-WONGTSCHOWSKI, C. L. D. B.; PAES, E. T. Padrões espaciais e temporais da comunidade de peixes demersais do litoral norte do Estado de São Paulo, Ubatuba, Brasil. Publ. Esp. Inst. Oceanogr., v. 10, p. 169-188, 1993.
SCHWARZ JR, R.; FRANCO, A. C. N. P.; SPACH, H. L.; SARPEDONTI, V.; PICHLER, H. A.; QUEIROZ, G. M. N. L. Composição e estrutura da ictiofauna demersal na Baía dos PInheiros, Paraná. Braz. J. Aquat. Sci. Technol.,v. 10, n. 1, p. 27-39, 2006.
SHEAVES, M.; JOHNSTON, R. Ecological drivers of spatial variability among ish fauna of 21 tropical Australian estuaries. Mar. Ecol. Prog. Ser., v. 385, p. 245-260, 2009. SIMONASSI, J. C.; HENNEMANN, M. C. TALGATTI, D.;
MARQUES JR, A. N. Nutrient variations and coastal water quality of Santa Catarina Island, Brazil. Biotemas, v. 23, n. 1, p. 211-223, 2010.
SORIANO-SIERRA, E. J. O Ecossistema da Lagoa da Conceição. Florianópolis: Fepema, 1999. p. 25-34.
SORIANO-SIERRA, E. J.; SIERRA DE LEDO, B. Ecologia e gerenciamento do manguezal de Itacorubí. Florianópolis: NEMAR, 1998. 396 p.
SPACH, H. L.; FÉLIX, F. C.; HACKRADT, C. W.; LAUFER, D. C.; MORO, P. S.; CATTANI, A. P. Utilização de ambientes rasos por peixes na Baía de Antonina, Paraná. Biociências, v. 14, n. 2, p. 125-135, 2006.
SPACH, H. L.; GODEFROID, R. S.; SANTOS, C.; SCHWARZ JR, R.; QUEIROZ, G. M. L. Temporal variation in ish assemblage composition on a tidal lat. Braz. J. Oceanogr., v. 52, n. 1, p. 47-58, 2004.
SPACH, H. L.; SANTOS, C.; PICHLER, H. A.; IGNÁCIO, J. M.; STOIEV, S. B.; BERNARDO, C. Padrões estruturais da assembleia de peixes em duas áreas do Canal da Cotinga, Baía de Paranaguá, Paraná, Brasil. Bioikos, v. 21, n. 2, p. 57-67, 2007.
VILAR, C. C.; JOYEUX, J. C.; GIARRIZZO, T.; SPACH, H. L.; VIEIRA, J. P.; VASKE-JUNIOR, T. Local and regional ecological drivers of ish assemblages in Brazilian estuaries. Mar. Ecol. Prog. Ser., v. 485, p. 181-197, 2013.
VILAR, C. C.; SPACH, H. L.; JOYEUX, J. C. Spatial and temporal changes in the ish assemblage of a subtropical estuary in Brazil: environmental efects. J. Mar. Biol. Assoc. U. K.,v. 91, n. 3, p. 635-648, 2011.