Coastal Vulnerability Assessment using geoindicators: case study of Rio
Grande do Sul coastline
Geoindicators are means adopted for the measurement
of geological processes and phenomena that occur
at or near the Earth’s surface and vary signiicantly
over periods of 100 years or less. These tools have
focused on assessing geological impacts and risks
over the last three decades. However, the use of
geoindicators is not widely known and has not been
as greatly exploited as have most environmental
indicators. The objective of this study is to
contribute to the difusion of information about and
the application of geoindicators. We have deined,
in terms of geoindicators, parameters and aspects
of coastal environments that are commonly studied
or monitored. The geoindicators proposed were
designed for assessing coastal physical vulnerability
in the case of the coastal beaches of Rio Grande
do Sul, Brazil. Four geoindicators were deined
and tested: the height and morpho-ecological state
of the foredunes, shoreline position, and washout
concentrations. An additional sócio-environmental
indicator was included, sanitary quality. These
indicators were brought together to constitute a
Physical Vulnerability Index that represented seven
locations along the coastline assessed. In addition,
the indicators and Index values were used to generate
a cartographic map that could be understood by the
public and used by decision makers.
Abstract
Priscila Emerich Souza
1*, João Luiz Nicolodi
21 University of Copenhagen, Department of Geosciences and Natural Resource Management
(Øster Voldgade 10, 1350 København K, Område III, Building: 03-1-369)
2 Universidade Federal do Rio Grande, Instituto de Oceanograia
(CAMPUS CARREIROS 96201-900 - Rio Grande, RS - Brasil Caixa-Postal: 474) *Corresponding author: [email protected]
Descriptors: Environmental indicators, Physical
vulnerability, Environmental assessment.
Geoindicadores são medidas de processos e
fenômenos geológicos que ocorrem perto ou sobre
a superfície da Terra e que variam signiicantemente
durante um período de até 100 anos. Nas últimas três
décadas, o uso de geoindicadores foi direcionado
para avaliações de impactos e riscos geológicos. Seu
uso, porém, ainda é pouco difundido e explorado
em relação aos demais indicadores ambientais.
Este estudo tem por objetivo contribuir à difusão
de informação e aplicabilidade dos geoindicadores.
Deinimos como geoindicador um parâmetro
ou aspecto comumente estudado ou monitorado
nos ambientes costeiros. Os geoindicadores aqui
propostos foram testados com vistas à avaliação
da vulnerabilidade física costeira das praias do
Rio Grande do Sul, Brasil. Quatro geoindicadores
foram deinidos e aplicados: altura e estado
morfo-ecológico de dunas frontais, posição de linha
de costa e concentração de sangradouros. Além
destes indicadores de caráter físico, outro de caráter
socioambiental foi incluído, qualidade sanitária. Os
indicadores foram agregados para gerar um Índice
de Vulnerabilidade Física para sete localidades ao
longo do litoral costeiro do Rio Grande do Sul. Um
mapa cartográico de linguagem acessível ao público
comum e aos tomadores de decisão foi gerado a
partir dos indicadores e do Índice.
Resumo
Descritores:
Indicadores ambientais, Vulnerabilidade
física, Avaliação ambiental.
INTRODUCTION
Coastal vulnerability includes a range of attributes that characterize the fragility of coastal stretches in the face of disasters and natural phenomena (TABAJARA et al., 2005). Therefore, coastal vulnerability assessments should comprise attributes that vary in content, that is, attributes
that represent diferent conditions or parameters that may
not be directly related to each other, but that contribute to the same purpose when considered together and analyzed within the same perspective.
In the ield of the geosciences, there are three main
concepts that guide vulnerability assessments: (1) Physical Vulnerability, which is closely related to susceptibility; (2) Social Vulnerability, which is related to how prepared society or individuals are to deal with or adapt to a hazard; (3) Social and Physical Vulnerability, which is related to the susceptibility and sensitivity of the environment to a particular hazard, and results from the social context (MULER, 2012). For the purposes of this study, we focus on the concept of physical vulnerability.
Geoindicators are valuable tools for physical
vulnerability assessments because, by deinition, they
derive from intrinsic and natural characteristics of the environment, and imply sensitive response to environmental changes. In the words of BERGER and IAMS (1996), geoindicators are “measures of geological processes and phenomena that occur at or near the Earth’s surface and
are subject to changes that are signiicant for understanding
environmental changes over periods of 100 years or less”. These geological tools have focused on assessing geological impacts and risks during the last three decades. In Brazil, the term “geoindicator” has not always been employed, but the concept is implicitly present in many
studies that assess the inluences of geological process on
humans and vice versa in various environments (CANIL, 2007; COLTRINARI, 2001; LOLLO; RHÖM, 2006; MULER, 2012; RUFINO, 2002; SOUSA et al., 2011; ZUQUETTE et al., 2004).
The purpose of this study is to present a physical vulnerability assessment explicitly using accepted
geoindicators. To do so, the geoindicators were deined in
accordance with the standard procedure compiled in the checklist by the COGEOENVIRONMENT working group of 1992. In addition to its individual performance, each
geoindicator deined was grouped and evaluated within
an Index, returning to the concept that “vulnerability represents an arrangement of attributes”. The study was
undertaken for the case of the coastline of Rio Grande do Sul, Southern Brazil.
Study Area
The method proposed is of general application and can be used for any coastal environments around the world. However, the tests were set for the coastal zone of Rio Grande do Sul state (RS) in order to validate the proposal and illustrate its applicability. Thus, the relevance of the
geological features and thresholds considered are speciic
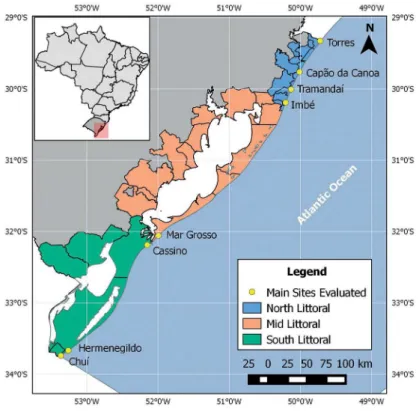
for this area and should be adapted whenever necessary. The study area includes the entire coastal zone of RS, extending from the mouth of the Mampituba River to the Arroio Chuí inlet over approximately 620 kilometers (mainly NE-SW). This beach is one of the longest and most continuous sandy beaches in the world (TOMAZZELLI; VILLWOCK, 1992). Only four inlets break the continuity of the entire coast. In addition, the coast can be divided into four sections for Coastal Management purposes, North Littoral, Mid Littoral (East and West) and South Littoral (Figure 1).
This shoreline extends in front of a coastal plain formed by two main depositional systems, (1) an alluvial fan system and (2) four transgressive-regressive lagoon-barrier type systems that are laterally juxtaposed. The deposition and readjustment of the sediments to the shapes of the sandy-barriers (Barriers I, II, III and IV) and their
preservation have occurred under climatic luctuations
and mean sea level variations during the Quaternary (TOMAZELLI et al., 2007).
The area generally consists of unconsolidated
Quaternary deposits, mainly ine and well-sorted sand.
Modal hydrodynamics consist mainly of swell waves
of moderate to high energy with signiicant height and
period of 1.5 m and 7-9 seconds, respectively. Tidal regime is semi-diurnal with a mean amplitude of 0.25 m. Nevertheless, storms originating in the south induce storm surges, which result in excessive sea level elevation up to 1.3 m. Morphodynamic stages of dissipative and intermediate beaches are predominant (TOLDO JR. et al., 2007).
MATERIAL AND METHODS
The choice of a speciic indicator occurs as a
Figure 1. Littoral of RS and its sections: north, mid and south.
the deviations of the current conditions regarding the desired or legal standards (MAGALHÃES JÚNIOR, 2011).
The eligibility criteria are related to the quality and usability of the indicator. The quality of the indicator depends on the accuracy and precision of the synthesized information. Thus, a parameter is an indicator if it meets the following criteria: (1) it isrelevant to the needs of the potential users (managers, visitors and local communities) and the aims of the proposed study, as in this case of the Shore Environment Physical Vulnerability Assessment; (2) it is representative, or if the particular information encompasses all phenomena; (3) it is sensitive enough to detect any changes at the monitored sites and provide information regarding the trends of properties or impacts;
and (4) it has deinedboundaries or thresholds that may allow the users to assess the observed values.
In its turn, the operability criterion meets the characteristics that make data acquisition and data processing possible. Thus, the following parameters are important: (1) data availability, which means that the required data should be available or easily measured by using existing instruments, monitoring programs and available analytical tools within a time scale that is
compatible with management; (2) cost, which means that the cost of the acquisition of the data, design and application of the indicator should match the available
inancial resources of environmental monitoring or
management; (3) credibility because the information
must have a scientiic basis and be trustworthy; (4)
comprehensibility, which means that information should also be presented in a comprehensible language because it
should relect properties of public interest.
Speciically, geoindicators are helpful for determining
what is occurring in the environment, describing catastrophic and gradual events, and supplying suggestions regarding what an administration can do to face these processes. According to BERGER (1997), geoindicators may help answer four basic questions: What is happening to the environment? Why is it happening? Why is it important? What can be done about it?
To answer these questions and properly deine common
parameters in terms of geoindicators, the checklist-chart proposed by the Working Group on Geoindicators, which
deined 27 geoindicators in 1995, was used. Although all
Choice and Verification
The identiication of parameters eligible as
geoindicators for assessing coastal physical vulnerability was based on a literature review of
technical-academic-scientiic texts. The process of identiication highlighted speciically the characteristics and peculiarities of the
dynamics of the beaches of RS, so that the choice could
relect what plays a major role in the coastal vulnerability
of RS.
A Technical Opinion Poll was held in order to: decrease partiality in the choice of parameters, verify their relevance, assign a numerical value to them, and verify acceptable thresholds in the environment. The last “task”
was only presented to the group of technically qualiied
respondents. This question was based on the DELPHI technique, and the main aspects that are used to predict multiple academic training, expertise, professional experience and naturalness were observed during the process for the selection of the participants. However, the sample size (n) was arbitrary.
The question was applied by means of a questionnaire presented to four groups of participants, (1) researchers and/or professionals of the Coastal Geological Oceanography area (CGO); (2) researchers and post-graduate students of the Geosciences (related areas); (3) students of and graduates in oceanography; (4) students in any area of study and beach-goers. The consulting process was conducted individually to prevent one respondent’s opinion from interfering with another’s.
The questionnaire included an introductory section with directions, concepts and descriptions that were necessary for understanding the research and another
section where the respondent could efectively indicate
the following: (1) his/her degree of knowledge about each geoindicator; (2) the geoindicator’s relevance; (3) the frequency at which the geoindicator should be measured; and (4) a hierarchy ranking the geoindicators, namely, placing them in ascending order by degree of importance.
Items 2 and 3 (the relevance and frequency) were included in the survey to ascertain the author’s proposal. Items 1 and 4 were objectively considered to assign a value to each geoindicator, which was called the weight attribution step. For this step, the hierarchy given by each respondent was weighted according to the degree of
knowledge indicated in the irst item of the questionnaire
(1 – high; 0.75 – intermediate; 0.5 – low; 0.25 – no knowledge). Then, the weighted average (WA) of the hierarchies given for each geoindicator was calculated
(Equation 1):
( )
WAg
Ki
Hi Ki
1
i n i n 1 1$
=
= =/
/
Where:g = geoindicator
n = number of respondents
Hi = degree of hierarchy given by the respondent i
Ki = knowledge index of respondent i
Finally, the inal weight (FW), which is the value given
to the geoindicator for the subsequent index computation, was obtained by normalizing the mean (Equation 2):
( )
FWg
WAg
WAg
2
g k 1=
=/
Where:k = number of geoindicators
Index: grouping the indicators for an
Integrated Assessment
As part of the information process of simplifying and systematizing its essential meaning, the geoindicators
deined were integrated into one index. The index contains
more information than a single indicator, therefore it may objectively and concretely represent some tendency, state or condition undergoing analysis. In addition, this index is
not static; instead it can be adapted to diferent situations or diferent environments when it is observed that the indicators require diferent weights.
All the indicators presented were aggregated into an Index of Vulnerability (Equation 3), which considered both the weights that represent the thresholds of each indicator in the environment (TEg) and the weights assigned based
on the speciied weighting process (FWg):
( )
y
FWg TEg
3
g k 1
$
=
=/
Where:TEg = weight related to the geoindicator g limit in the environment and derived from open source data.
Once the geoindicators were deined and grouped,
the validity of the method was tested by applying it to the RS coast. The characterization of the environmental state was based on academic data and results provided by educational institutions, environmental agencies and the Brazilian Institute of Geography and Statistics (IBGE).
This study does not propose the collection of new data as an objective but relies on many other researchers who have already collected and stored data in the databases of these centers. These data not only enable researchers to propose indicators that have desirable operational characteristics, such as the availability of credible data and/ or data that can be obtained cheaply, but also reinvents the value of data already exploited. Data collection requires
time, efort, an appropriate team and money, and therefore
exploring new approaches by using existing data enriches the work conducted by researchers and institutions engaged in understanding the coastal environment.
Particularly, data on the occurrence of washouts were obtained remotely and in situ by, respectively, analyzing historical images available at Google EarthTM and counting
the number of washouts per kilometer traveled during
ieldwork between April 9 and 12, 2013.
Thematic maps of geoindicators and the index were drawn using the Fepam vector base with the projection
SIRGAS 2000 UTM 22 South. Point shapeiles were built,
and X and Y coordinates were assigned to represent the localities assessed. Cartographic maps were prepared in the ArcGIS 10 (ESRI) environment.
RESULTS
The features chosen to be represented as geoindicators included foredune systems, shoreline position, and washout occurrence. We included a further environmental indicator, the so-called water sanitary quality. Hereafter, we specify each of these by stating their meaning, general relevance, the assigned values and the application to the coastal assessment of RS coast. Checklist-charts were generated for each geo-indicator, but only what was considered essential is presented here. Complete checklist-charts are available in SOUZA’s Master’s dissertation (2014).
Height and morpho-ecological state of the
foredunes
The coast of RS consists mainly of gently sloping
wide beaches, mostly composed of ine sediment, wave-dominated, and inluenced by aeolian processes. Dunes
are likely to occur and interfere in the coastal processes. Exceptions occur where the main wind for aeolian transport (from NE) blows either parallel to the coast or
is directed obliquely ofshore, depleting the foredune sand
stock (CALLIARI et al., 2005).
The balance of the dune system directly inluences the
depositional and erosional processes of the beach, protecting
the coast against wave attack and tidal looding. Dune
height and its morpho-ecological state (shape and vegetation cover) are both relevant parameters that can indicate how vulnerable the dunes are to erosion and degradation. The former parameter neither presupposes nor excludes the latter, therefore both constituted the geoindicator for foredunes. The
deinition of height and morpho-ecological state of foredunes
as a geoindicator is presented in Table 1.
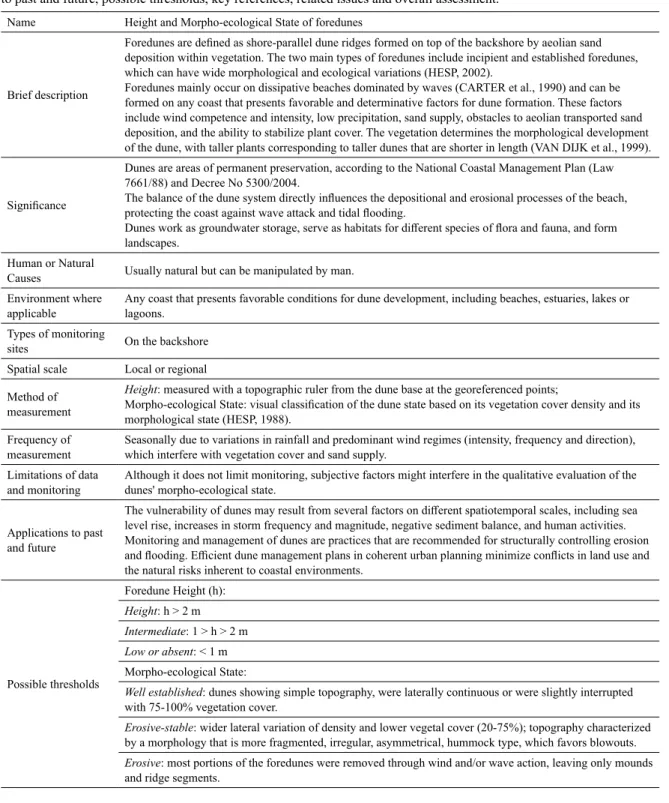
These geoindicators could only be applied to some beaches of the north littoral, where both dune height and morpho-ecological state were available – data by TABAJARA et al. (2005) and CALLIARI (2005). In general, few vulnerable scenarios were observed because there were more high and well-established foredunes (Figure 2). However, exceptions were observed at Capão da Canoa and at Cidreira where foredunes of intermediate
height and up to 3 m, respectively, were classiied as
stable-erosive in terms of morpho-ecological state.
Shoreline Position (SP)
Shoreline position (SP) is part of the 27
geoindicators-list proposed by the GEOIN initiative in 1996. It relects
coastal retreat/accretion, and thus is broadly associated with coastal physical vulnerability to decrease/increase of sediment supply, sea level changes, extreme weather
events, etc. Following the SP deinition used in other
studies undertaken on the coast of Rio Grande do Sul (TOLDO JR et al., 1999; ESTEVES et al., 2002; TOLDO JR et al., 2005; ALBUQUERQUE, 2013), we consider the shoreline position as the intersection of the mean sea-level at the beachface.
Some studies on the Brazilian coast have discussed the shoreline position in terms of a qualitative indicator (LINS-DE-BARROS, 2005; RUDORFF; BONETTI, 2010). Although SP is closely related to erosion rates, which are often measured in coastal surveys, we lack studies that use these quantitative measurements and discuss them as indicators. The general concept of SP as
a geoindicator is well-deined in BERGER and IAMS
(1996). Our objective here was to examine the literature to provide further information that suits the particular characteristics of our study area and therefore enables a
credible assessment of it to be made. Table 2 speciies
Table 1. Checklist-chart of foredune geoindicators: geoindicator's name, brief description, signiicance, cause, environment
where applicable, monitoring sites, method and frequency of measurement, limitations of data and monitoring, applications to past and future, possible thresholds, key references, related issues and overall assessment.
Name Height and Morpho-ecological State of foredunes
Brief description
Foredunes are deined as shore-parallel dune ridges formed on top of the backshore by aeolian sand deposition within vegetation. The two main types of foredunes include incipient and established foredunes, which can have wide morphological and ecological variations (HESP, 2002).
Foredunes mainly occur on dissipative beaches dominated by waves (CARTER et al., 1990) and can be formed on any coast that presents favorable and determinative factors for dune formation. These factors include wind competence and intensity, low precipitation, sand supply, obstacles to aeolian transported sand deposition, and the ability to stabilize plant cover. The vegetation determines the morphological development of the dune, with taller plants corresponding to taller dunes that are shorter in length (VAN DIJK et al., 1999).
Signiicance
Dunes are areas of permanent preservation, according to the National Coastal Management Plan (Law 7661/88) and Decree No 5300/2004.
The balance of the dune system directly inluences the depositional and erosional processes of the beach, protecting the coast against wave attack and tidal looding.
Dunes work as groundwater storage, serve as habitats for diferent species of lora and fauna, and form landscapes.
Human or Natural
Causes Usually natural but can be manipulated by man. Environment where
applicable
Any coast that presents favorable conditions for dune development, including beaches, estuaries, lakes or lagoons.
Types of monitoring
sites On the backshore
Spatial scale Local or regional Method of
measurement
Height: measured with a topographic ruler from the dune base at the georeferenced points;
Morpho-ecological State: visual classiication of the dune state based on its vegetation cover density and its morphological state (HESP, 1988).
Frequency of measurement
Seasonally due to variations in rainfall and predominant wind regimes (intensity, frequency and direction), which interfere with vegetation cover and sand supply.
Limitations of data and monitoring
Although it does not limit monitoring, subjective factors might interfere in the qualitative evaluation of the dunes' morpho-ecological state.
Applications to past and future
The vulnerability of dunes may result from several factors on diferent spatiotemporal scales, including sea level rise, increases in storm frequency and magnitude, negative sediment balance, and human activities. Monitoring and management of dunes are practices that are recommended for structurally controlling erosion and looding. Eicient dune management plans in coherent urban planning minimize conlicts in land use and the natural risks inherent to coastal environments.
Possible thresholds
Foredune Height (h):
Height: h > 2 m
Intermediate: 1 > h > 2 m
Low or absent: < 1 m Morpho-ecological State:
Well established: dunes showing simple topography, were laterally continuous or were slightly interrupted
with 75-100% vegetation cover.
Erosive-stable: wider lateral variation of density and lower vegetal cover (20-75%); topography characterized
by a morphology that is more fragmented, irregular, asymmetrical, hummock type, which favors blowouts.
Erosive: most portions of the foredunes were removed through wind and/or wave action, leaving only mounds
Key references
Law 7661 of May 16, 1988; Decree No 5300 of (2004) CALLIARI et al. (2005) CARTER et al. (1990) CARVALHO et al. (2008) DAVIES et al. (1995) HESP (1988, 2002) SEELIGER (1992) TABAJARA et al. (2005) VAN DIJK et al. (1999).
Related
environmental and geological issues:
Sediment supply, grain size and nature, platform width, beach stage, wave energy, energy low in the surf zone, longshore transport;
Erosion/accretion; foredune scarp;
Shore orientation in relation to the predominant wind; direction, intensity and frequency of the predominant wind; aeolian transport efectiveness;
Anthropic pressure: real estate speculation, opening of paths (trampling of vegetation), mining, engineering structures, etc.;
Areas of Permanent Preservation, Conservation Units, and Dune Monitoring Programs: Coastal Management.
Overall Assessment
Studying and monitoring the “height” and “morpho-ecological state” parameters of foredunes under geoin-dicator aggregates with relevant and accessible information (easily and cheaply obtained) for managers of areas that already use some sort of Dune Monitoring Program and for those who are unaware of the degree of vulnerability and importance of these coastal features.
Continued Table 1.
Figure 2. Classiication of North littoral based on foredunes height and morpho-ecological state (i.e. dune shape and vegetation cover). Data after
TABAJARA et al. (2005) and CALLIARI et al. (2005).
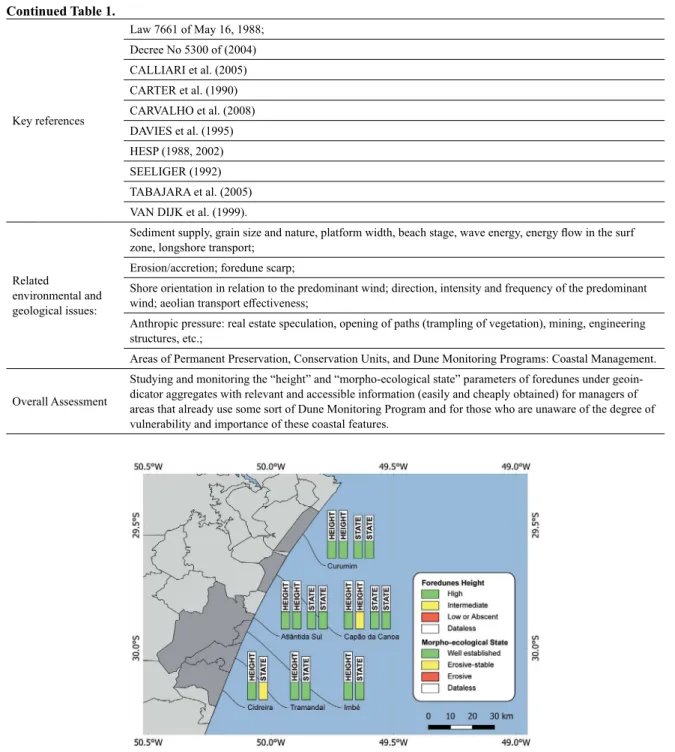
We tested the SP geoindicator concept at Hermenegildo
beach, southern littoral of the RS, which the scientiic com -munity agrees to be undergoing coastal retreat. The data used here were selected from ALBUQUERQUE (2013), who
pro-vides relevant data of the area. The temporal classiication
obtained is presented in Table 3. Values 1, 5 and 10 represent processes of accretion or stability, erosion and severe erosion, respectively.
Washout Concentration (WC)
Washouts, as part of the drainage of coastal plains, are common features of beach environments. Washouts stand out in this study because of their relevance and because they are noticeable on the beach, they interfere with the dynamics
of the beach system – scientiic relevance and management –, and afect or are afected by man – social relevance and
Table 2. Brief checklist-chart of SP geoindicator with information suitable for RS coast: monitoring frequency, limitations and possible thresholds for both quantitative and qualitative evaluations.
Name Shoreline position (SP)
Frequency of measurement Seasonally before and after storm events, or according to usual interval of variability (if known). Limitations of data and monitoring Historical records are short, spatially discontinuous, and have been obtained using variable and
limited methodologies.
Possible thresholds
Quantitative:
Severe Erosion: > 2 m/year
Erosion: 0.5 to 2 m/year
Accretion or stability: < 0.5 m/year Qualitative:
Severe erosion: lack of vegetation, clear beach escarpment, tidal channels exposed in surf zone, etc.;
Erosion: dune escarpment or fragmented, narrow beach, peat, mud or tree pieces exposed on the beach;
Accretion or stability: dune crest established by vegetation, laterally continuous with few or no breaks.
Table 3. Temporal rating of the SP of Hermenegildo beach
according to its rate of retreat within eleven diferent periods
of time: 1, 5 and 10 represent processes of accretion or stability, erosion and severe erosion, respectively.
Period Retreat rate (m/yr) Rating
1947 – 1964 0.2 1
1964 – 1975 0.61 5
1975 – 1996 0.41 1
1996 – 2000 6.29 10
2000 – 2005 2.37 10
2005 – 2006 5.25 10
2006 – 2007 0.11 1
2007 – 2009 0.49 1
2009 – 2010 0.93 5
2010 – 2011 1.41 5
2011 – 2012 0.45 1
Washouts play an important role in coastal evolution by interfering in the variations of sediment volume between the backshore and the sea level during accretion or erosion events (CALLIARI; PEREIRA DA SILVA, 1998). In addition, washouts can constitute a risk factor for
beach-goers because they are “obstacles” to the traic on the
beach (FIGUEIREDO; CALLIARI, 2005) and because they occasionally transport domestic sewage straight to the beach.
Eforts to better understand the dynamics, behavior
and importance of washouts are increasing. Nevertheless,
these eforts have not focused on the geoindicator approach,
represented here by their occurrence in the environment.
Information and characteristics that deine them as a
geoindicator and are needed for its validation, considering the particularities of the RS coast, are systematized in Table 4, which is part of the checklist-chart designed for WC.
We were able to verify WC geoindicator applicability on some stretches of the littoral area of the RS, chosen on the basis of data availability and its similarity to the locations
where the other geoindicators were tested. Along the ive
stretches assessed – Tramandaí-Cidreira, Mar Grosso, Cassino,
Hermenegildo and Chuí –, the classiications obtained were
generally at least moderate (TEg = 5 or 10). This means that the washout concentrations were equal to or higher than one over the two kilometers covered. Only two exceptions were observed along the Mar Grosso and Chuí beaches, which were
classiied with the lowest index (TEg = 1) since no washout
was observed in the measurements in April 2013.
Sanitary Quality (SQ)
Although it did not satisfy the deinition of the proile
of a geoindicator, an environmental indicator named SQ was included in this coastal vulnerability assessment. The indicator was included because of the desire to have a socio-environmental indicator that could both express the pressure of humans on the environment and be dependent
on environment dynamics, which afected the interactions
between the beach and its users.
Environmental conditions or factors can occasionally promote contamination, for example, by the leaching of the contaminants in soils due to mammalian excreta. Nevertheless, improper SQ conditions mainly result from domestic sewage input near to or in watercourses. Tourist
activity during holiday seasons usually intensiies this input.
The guidelines and thresholds we used for SQ
measurements correspond to those speciied by Brazilian
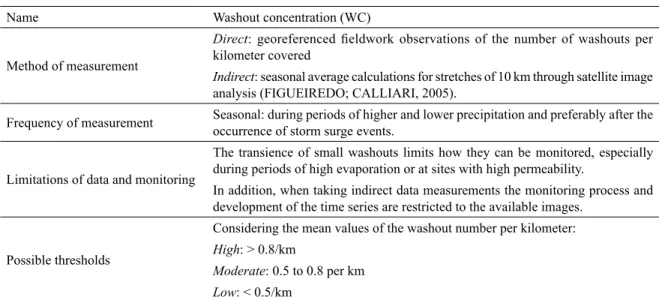
Name Washout concentration (WC)
Method of measurement
Direct: georeferenced ieldwork observations of the number of washouts per
kilometer covered
Indirect: seasonal average calculations for stretches of 10 km through satellite image analysis (FIGUEIREDO; CALLIARI, 2005).
Frequency of measurement Seasonal: during periods of higher and lower precipitation and preferably after the occurrence of storm surge events.
Limitations of data and monitoring
The transience of small washouts limits how they can be monitored, especially during periods of high evaporation or at sites with high permeability.
In addition, when taking indirect data measurements the monitoring process and development of the time series are restricted to the available images.
Possible thresholds
Considering the mean values of the washout number per kilometer:
High: > 0.8/km
Moderate: 0.5 to 0.8 per km
Low: < 0.5/km
Table 4. Brief checklist-chart of WC with information suitable for the coast where the geoindicator was tested: method of measurement, monitoring frequency, limitations and possible thresholds for quantitative evaluations
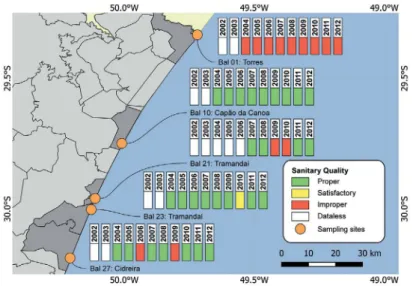
We classiied ive beaches along the north littoral
based on their thermotolerant coliform concentrations. These beaches are part of the monitoring spatial mesh of Fepam’s Bathing Quality Program and therefore they present relatively long-time data series. Our results are spatially and temporally represented in Figure 3 and show that, except for Torres (Bal 1) and for some occurrences in Tramandaí (Bal 21 and 23) and Cidreira (Bal 27), the general conditions of a proper SQ are dominant in this coastal sector.
It is important to note, however, how general this conclusion is, since it is derived from the sum of the performance of samples measured during the summer period. In other words, even at the sites that are considered proper, values that express satisfactory or improper conditions were occasionally observed in one or more measurements. To illustrate this, Figure 4 shows all of the
data for Bal 10 in Capão da Canoa. This igure indicates
that although the synthesis resulted in an overall “proper” value, thermotolerant coliform concentrations were not above 1000 mpb/100 mL only during the summer campaign of 2005-2006.
Technical Opinion Poll
The opinion poll application ratiied the relevance of
the proposed geoindicators because at least 50% of the respondents assigned high relevance to all the geoindicators. The SP and SQ geoindicators were most often regarded as highly relevant and those related to the foredunes were at least considered to have an average degree of relevance.
We calculated weights for each geoindicator based on the hierarchies suggested by the respondents – wherein the
opinion of experts had greater weight. The inal weights
(FW) obtained were: 0.20 for the foredune height; 0.21 for the foredune morpho-ecological state; 0.22 for the shoreline position; 0.18 for the concentration of washouts, and 0.19 for sanitary quality.
Integrated Test
By deining the geoindicators and assigning respective
weights to them (FW), an integrated test was held in seven stretches of the littoral area of the RS. The chosen stretches and the sums of the respective contributions and performance of each geoindicator were 4.26 for Tramandaí and 4.34 for Cidreira; 4.18 for Mostardas and 2.62 for Mar Grosso; 2.62 for Cassino, 7.19 for Hermenegildo and 4.49 for Chuí. This sum represents the Physical Vulnerability
classiication for each place from the integration of diferent
geoindicators and ranges from 1 to 10 in order of increasing vulnerability.
DISCUSSION
The method for deining geoindicators by using a
checklist-chart is objective and brief. Having listed the sort of relevant information that an indicator is expected
to communicate makes the general process of deinition easier. The established objective delimitates the deinition,
which is what this indicator should represent, and guides the
Figure 3. Classiication of North littoral based on sanitary quality indicator. Appropriate conditions prevail, still undesirable classiications occur
on the most popular beaches of RS coast. Data source: Fepam.
Figure 4. Boxplot of sanitary quality from Capão da Canoa: although the SQ synthesis resulted in an overall “proper” value, the graph shows that high thermotolerant coliform concentrations were not uncommon along the monitoring period. Horizontal red line indicates the threshold of accepted concentrations:1000 MPB/100 mL.
Thresholds are dependent on where the geoindicator is to
be applied, so that the peculiarities of diferent places may
be properly considered in the analysis.
Because of the relevance and operability criteria, the proposed geoindicators were derived from the parameters that are commonly studied in coastal environments. They
should facilitate gathering and describing necessary information, and establishing thresholds that could represent three degrees of environmental vulnerability, low, intermediate and high (1, 5 and 10).
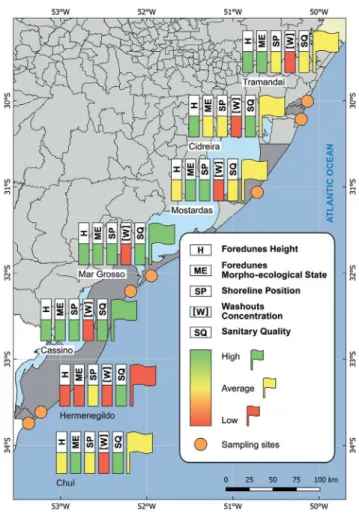
Figure 5. Cartogram of the Physical Vulnerability of the RS coast. Most beaches assessed resulted at least in an intermediate level of physical vulnerability, including those of high demand during the summer. The highest index of vulnerability was attributed to Hermenegildo, a southern small and less popular beach of RS, but with natural high naturally morphodynamic variability.
diiculties encountered in the collection of published
data. Available data were enough to test the applicability of the geoindicators, but it would be preferable to have a more complete (longer) data set to represent a broader environmental trend, so as better to describe the evolution of the indicator with time. For instance, for those geoindicators representing the foredune system, the absence of data on height and morpho-ecological state that were coincident with the same location limited the representation of environmental trends over time. In
Capão da Canoa the foredune height was classiied in the irst scenario with an intermediate degree of vulnerability
and then with a low one.
The thresholds established for the RS coast were arbitrary but not random. The reference values and the gap between them were based on discussions of local academic
and scientiic papers and on Brazilian environmental laws,
including the case of the SQ indicator. In addition, these
thresholds were ascertained in the technical opinion poll, by the respondents of a group of geoscience studies that
agreed with the proposed thresholds. This efort was decisive so that the individual and integrated classiications
generated at the end of the process would be coherent with what is actually observed in the environment.
For example, the SP geoindicator was validated at Hermenegildo beach. It is of common knowledge among local researchers and residents that this beach has been undergoing erosion processes. Although some of the periods analyzed have presented low vulnerability characteristics, the dominant conditions at least have intermediate vulnerability. However, the mean calculation for 65 years indicates an
erosion rate of 1.68 m/year, which its the intermediate vulnerability classiication. When complementing the
evaluation and considering the qualitative attributes proposed
attributes of erosion, such as peat outcrops, urbanization on foredunes, dunes with scarps, narrow beaches and the presence of protection structures. KOERNER (2012) gathered results from many authors and calculated that the retraction rates at Hermenegildo were equal to or less than 0.5 m/year in only one of the six studies mentioned, despite
the methodology employed. This result conirms the overall classiication of “erosion” here that was obtained using the
geoindicator tool.
The deinition of geoindicators does not presuppose that the
same processes should be aggregated into an index - because
they are suicient and can contribute, even individually,
to assessing environmental conditions or trends. However, grouping them into an index promotes a multicriteria analysis when observing the degree of importance of one criterion (a geoindicator) relative to another.
The inal weights obtained through the hierarchy were
not discrepant among themselves. Thus, it is possible that
the results of the integrated test would not be very diferent
if these weighted values were not considered. However, it is still to be recommended that the weights generated should be included because although this weighting may or may not accumulate at the end of the index sum, it is possible and indeed likely that one criterion, among those listed, should be more important than another.
The classiications generated for each one of the seven
selected stretches of the RS coast were satisfactory. We were able to generate a product that was synthetic, with aggregated meaning and easily understood by the public. However, regarding the accuracy and veracity of the information generated, it is noteworthy that the degree of Physical Vulnerability is subject to the data that support the characterization of the environment.
In general, the assessment shows that the beaches of RS, which are continuous and similar, present local
variations that are suicient to justify characterizing diferent degrees of vulnerability (Figure 5). Except at Hermenegildo, where the coniguration of the urbanized
foredunes made the scenario worse, the degree of vulnerability attributed to all the other environments
mainly relected natural conditions, or conditions not triggered a priori by man. This inding is particularly
relevant because it indicates that the environment favors
intermediate vulnerability conditions and acts as a bufer
even for the most populated beaches.
However, how long will the environment function on men’s behalf? The scenario of intermediate vulnerability obtained for the north littoral beaches, for example, is not
alarming. Nevertheless, it must be stressed that this is the most intensely urbanized sector of the entire state coast. Thus, the degree of vulnerability to natural events or phenomena that
afect the coast may become worse due to the interference of
unplanned or poorly executed human activities and result in a greater number of people’s being exposed to danger.
CONCLUSIONS
Selecting, synthesizing and integrating variables that can represent the state and trends of some natural
environments simply and efectively is a complex task,
especially regarding the literature search and review and the subjectivity that accompanies this process. But employing geoindicators is a suitable approach to the systematization of the task. Geoindicators stand out as they consider the natural and dynamic adjustment of
environmental processes irst, rather than the human
pressures alone.
We assessed the coastal vulnerability of the RS coast by using ordinary and well-known local parameters
under an approach diferent than the usual. The choice of
parameters was made based on their relevance and data
availability. We deined them in terms of geoindicators and
assigned thresholds that represent their performance in the environment. Grouping them into an index of physical vulnerability allowed us to represent their existence and interactions in the environment in comprehensible language.
ACKNOWLEDGEMENTS
The irst author would like to thank CAPES for a research fellowship and inancial support from CNPq.
The research for this article is part of Priscila E. Souza’s Master’s thesis supervised by João Nicolodi PhD at the Post-Graduate Programme in Physical, Chemical and Geological Oceanography of the Institute of Oceanography of the Federal University of Rio Grande. We thank Elaine Oliveira
for collecting the data on washouts during the ieldtrip in
2013, and Julia Matrai for helping with the illustrations.
REFERENCES
ALBUQUERQUE, M. G. Análise espaço-temporal das causas da varia-bilidade da linha de costa e erosão na praia do Hermenegildo. 2013. 126 f. Ph.D. Thesis - Universidade Federal do Rio Grande do Sul. Porto Alegre, 2013. http://www.lume.ufrgs.br/handle/10183/72241 BERGER, A. R. Assessing rapid environmental change using
BERGER, A. R.; IAMS, W. J. (eds).Geoindicators: Assessing Rapid Environmental Changes in Earth Systems. Rotterdam: Balkema, 1996. 466 p.
BUSH, D. M.; NEAL, W. J.; YOUNG, R. S.; PILKEY, O. H. Utilization of geoindicators for rapid assessment of coastal-hazard risk and mi-tigation. Ocean. Coast. Manag., v. 42, n. 8, p. 647-670, 1999. CALLIARI, L. R.; PEREIRA, P. S.; DE OLIVEIRA, A. O.;
FIGUEI-REDO, S. A. Variabilidade das dunas frontais no litoral norte e médio do Rio Grande do Sul, Brasil. Gravel, v. 3, p. 15-30, 2005. CALLIARI, L. J.; PEREIRA DA SILVA, R. Erosion Processes
asso-ciated to storm surge and washout along the southern Brazilian coastline. J. Coast. Res., v. 26, p. 1-7, 1998.
CANIL, K. Indicadores para monitoramento de processos morfodi-nâmicos: aplicação na bacia do Ribeirão Pirajussara. 2007. 152 f. Ph.D. Thesis. Universidade de São Paulo. São Paulo, 2007. http://www.teses.usp.br/teses/disponiveis/8/8135/tde-04062007-141138/pt-br.php
CARTER, R. W. G.; NORDSTROM, K. F.; PSUTY, N. P. The study of coastal dunes. In: NORDSTROM, K. F.; PSUTY, N. P.; CAR-TER, R. W. G. (Eds.). Coastal dunes: form and process. Chinches-ter: John Wiley & Sons, 1990 p. 1-16.
CARVALHO, R. V.; SILVA, K. G.; CRIVELLARIO, C. V. L. Gestão ambiental das dunas costeiras: manejo e conservação. Cassino: NEMA, 2008. 28 p.
COLTRINARI, L. Mudanças ambientais globais e geoindicadores. Pesqui. Geociênc., v. 28, n. 2, p. 307-314, 2001.
DAVIES, P.; WILLIANS, A. T.; CURR, R. H. F. Decision making in dune management: theory and practice. J. Coast. Conserv., v. 1, n. 1, p. 87-96, 1995.
ESTEVES, L. S.; TOLDO JR, E. E.; DILLENBURG, S. R.; TOMA-ZELLI, L. J. Long- and Short-Term Coastal Erosion in Southern Brazil. J. Coast. Res., v. 36, p. 273-282, 2002.
FIGUEIREDO, S. A.; CALLIARI, L. J. Sangradouros: distribuição espacial, variação sazonal, padrões Morfológicos e implicações no gerenciamento costeiro. Gravel, v. 3, p. 47-57, 2005. HESP, P. Morphology, dynamics and internal stratiication of some sta
-blished foredunes in Southeast Australia. Sediment. Geol., v. 55, n. 1-2, p. 17-41, 1988.
HESP, P. Foredunes and blowouts: initiation, geomorphology and dy-namics. Geomorphology, v. 48, n. 1-3, p. 248-265, 2002. KOENER, K. F. Alternatinas de manejo para o problema da erosão
cos-teira no Balneário do Hermenegildo. 2012. 148 f. Ph.D. Thesis - Uni-versidade Federal do Rio Grande. Rio Grande do Sul, 2012. http:// repositorio.furg.br/bitstream/handle/1/4035/karl.pdf?sequence=1 LINS-DE-BARROS, F. M. Risco, vulnerabilidade física à erosão
cos-teira e impactos sócio-econômicos na orla urbanizada do municí-pio de Maricá, Rio de Janeiro. Rev. Bras. Geomorf., v. 6, n. 2, p. 83-90, 2005.
LOLLO, J. A.; RHÖM, S. A. Geoindicators for evaluating geological impact on Brazilian urban areas. Proceedings of the 10 th IAEG International Congress. Nottingham: United Kingdom, 2006. p. 1-9.
MAGALHÃES JÚNIOR, A. P. Indicadores ambientais e recursos hí-dricos: realidade e perspectivas para o Brasil a partir da experiên-cia francesa. Rio de Janeiro: Bertrand Brasil, 2001. 688 p. MULER, M. Avaliação da Vulnerabilidade de praias da Ilha de
San-ta CaSan-tarina a perigos costeiros através da aplicação de um Índice Multicritério. 2012. 208 f. Ph.D. Thesis - Universidade Federal de Santa Catarina. Florianópolis, 2012. http://repositorio.ufsc.br/ xmlui/handle/123456789/100603
RUDORFF, F. M.; BONETTI, J. Avaliação da suscetibilidade à erosão costeira de praias da Ilha de Santa Catarina. Braz. J. Aquat. Sci. Technol., v. 14, n. 1, 9-20, 2010.
RUFINO, R. C. Avaliação da qualidade ambiental do município de Tubarão (SC) através do uso de indicadores ambientais. 2002. 123 f. Master’s Dissertation - Universidade Fede-ral de Santa Catarina. Florianópolis, 2002. https://reposi-torio.ufsc.br/bitstream/handle/123456789/82919/189517. pdf?sequence=1
SEELIGER, U. Coastal foredunes of Southern Brazil: physiogra-phy, habitats, and vegetation. In: SEELIGER, U. (Ed.). Coas-tal Plant Communities of Latin America. New York: Acade-mic Press, 1992. p. 367-381.
SOUSA, P. H. G. O.; SIEGLE, E.; TESSLER, M. G. Environ-mental and anthropogenic indicators for coastal risk assess-ment at Massaguaçú beach (SP) Brazil. In: FURMANCZYK, K.; GIZA, A.; TEREFENKO, P. (Eds.). Proceedings of the 11th International Coastal Symposium. J. Coast. Res., n. 64, Special Issue, p. 319-323, 2011.
SOUZA, P. E. Metodologia de deinição de geoindicadores para a avaliação de vulnerabilidade da orla costeira do Rio Gran-de do Sul. 2014. 99f. Master’s Dissertation - UniversidaGran-de Federal do Rio Grande. Rio Grande, 2014. http://www.saope- lotas.furg.br/images/stories/documentosdereferencia/disser-tao_priscila-ps.defesa2print.pdf
TABAJARA, L. L.; GRUBER, N. L. S.; DILLENBURG, S. R.; AQUINO, R. Vulnerabilidade e classiicação das dunas da praia de capão da canoa, litoral norte do Rio Grande do Sul. Gravel, v. 3, p. 71-84, 2005.
TOLDO JR., E. E.; ALMEIDA, L. E. S. B.; BARROS, C. E.; BAITELLI, R.; MARTINS, L. R. S.; NICOLODI, J. L. Hi-drodinâmica e Sedimentologia das Praias Oceânicas do Rio Grande do Sul. In: IANNUZZI, R.; FRANTZ, J. C. (Org.). 50 anos de Geologia do Instituto de Geociências. Porto Alegre: Comunicação e Identidade, 2007. p. 299-315.
TOLDO JR, E. E; ALMEIDA, L.; NICOLODI, J. L.; MARTINS, L. R. Retração e progradação da zona costeira do estado do Rio Grande do Sul. Gravel, v. 3, p. 31-38, 2005.
TOLDO JR, E. E.; ALMEIDA, L. E. S. B.; BARROS, C. E.; BAI-TELLI, R.; MARTINS, L. R. S.; NICOLODI, J. L. Retreat of the Rio Grande do Sul Coastal Zone, Brazil. In: MARTINS, L. R. S.; SANTANA, C. I. (Orgs.). Non Living Resources of the Southern Brazilian Coastal Zoneand Continental Margin. Porto Alegre: UNESCO, 1999. p. 62-68.
TOMAZELLI, L. J.; DILLENBURG, S. R.; VILLWOCK, J. A.; BAR-BOZA, E. G.; BACHI, F. A.; DEHNHARDT, B. A.; ROSA, M. L. C. C. Sistemas Deposicionais e Evolução Geológica da Planície Costeira do Rio Grande do Sul: uma síntese. In: IANNUZZI, R.; FRANTZ, J. C. (Orgs.). 50 anos de Geologia do Instituto de Geociências. Porto Alegre: Comunicação e Identidade, 2007. p. 327-339.
TOMAZZELLI, L. J.; VILLWOCK, J. A. Considerações sobre o am-biente praial e a devira litorânea de sedimentos ao longo do litoral norte do Rio Grande do Sul, Brasil. Pesqui. Geociênc., v. 19, n. 1, p. 3-12, 1992.
VAN DIJK, P.; ARENS, S.; VAN BOXEL, J. Aeolian processes across transverse dunes. II: modelling the sediment transport and proile de -velopment. Earth Surf. Process. Landf., v. 24, n. 4, p. 319-333, 1999. ZUQUETTE, L.V.; PEJON, O. J.; SANTOS COLLARES, J. Q. Land