Spatiotemporal distribution of the benthic macrofauna in an urbanized
subtropical estuary: environmental variations and anthropogenic impacts
This study was conducted in the Itajaí-Açu
river lower estuary in Southern Brazil, in
which we aimed to: (1) analyze spatiotemporal
variations on the macrofauna; (2) search for
relationships between environmental variables
and the assembly and (3) evaluate the influence
of capital dredging upon the assembly. Two
hundred twenty eight samples were performed in
four stations, two of which affected by dredging.
Sediment (sand, silt and clay, organic matter
and carbonate) and water column´s variables
(temperature, salinity, pH, dissolved oxygen,
and turbidity) were also assessed. We applied
Principal Component Analysis for environmental
variables and Hierarchical Clustering for biotic
data. Correlations between environmental and
biotic matrices were tested by Canonical Analysis
of Principal Coordinates. Spatiotemporal
variations in the assembly were tested by
Permutational Multivariate Analysis of Variance.
From the 21.839 organisms sampled, 97% was
represented by the gastropod
Heleobia australis
.
Despite the influence of the river discharge on
the ecosystem, dredging was deleterious to the
assembly, favoring opportunistic organisms such
as
H. australis
.
A
bstrAct
Pedro Rocha Mattos
1*, Tito César Marques de Almeida
11 Universidade do Vale do Itajaí-UNIVALI.
(Rua Uruguai, 458, Centro Bloco D2 Sala 144 Caixa Postal 360, CEP 8302-202, Itajaí, SC, Brazil.)
*Corresponding author: [email protected]
Descriptors:
Estuaries, Macrofauna, Dredging, River
discharge.
Este estudo foi conduzido no baixo estuário do rio
Itajaí-Açu, sul do Brasil, no qual buscamos: (1) determinar a
distribuição espaço-temporal da macrofauna (2) relacionar
o padrão de distribuição da assembleia com as variáveis
ambientais e (3) avaliar a inluência das dragagens de
aprofundamento sobre a estrutura e composição da
assembleia. Duzentas e vinte e oito amostras foram
coletadas em quatro estações localizadas no baixo estuário,
duas delas afetadas pelas dragagens. A composição
do sedimento (areia, silte e argila, matéria orgânica e
carbonato) as variáveis da coluna de água (temperatura,
salinidade, pH, oxigênio dissolvido e turbidez) também
foram analizadas. Utilizou-se de Análise em Componentes
Principais para avaliar a variação espaço-temporal
das forçantes ambientais, e Agrupamento Hierárquico
para a distribuição da assembleia. Correlações entre a
matriz de variáveis ambientais e a estrutura multivariada
da macrofauna foram testadas por meio da Análise
Canônica de Coordenadas Principais. Testamos as
variações espaço-temporais das associações por meio
de Análise de Variância Multivariada Permutacional.
Dos 21.839 organismos coletados, 97% correspondeu
ao gastrópode
Heleobia australis
. Apesar da descarga
luvial mostrar-se uma importante variável reguladora
do ecossistema, as dragagens de aprofundamento foram
deletérias à macrofauna, favorecendo a dominância de
organismos oportunistas tais como
H. australis
.
r
esumo
Descritores:
Estuários, Macrofauna, Dragagens,
Des-carga fluvial.
INTRODUCTION
Estuaries are responsible for a variety of ecological services such as nutrient cycling, food production and biologic control besides providing habitat for many species. The average global value of annual ecosystem services related to estuaries were estimated in US$ 22.832,00/ha/year (CONSTANZA et al., 1997), enforcing the importance of their conservation. It is of great concern that estuarine areas are vulnerable to disturbances such as variations in salinity, high organic matter input and anoxic sediment (ROSA; BEMVENUTI, 2006), which can be associated to anthropic impacts.
Due to their geographical features, estuaries worldwide have historically shown to favor human settlement and great urban centers tend to develop in those areas. As a downside of urbanization, population growth and economic development of coastal areas have been menacing the ecological integrity of many estuaries around the globe. We can outline port facilities and dredging operations as some of the main anthropic activities that
may inlict damage to estuaries (KENNISH, 2002).
The development of many coastal regions depends on the quality and capacity of its ports to keep with international standards. Because of the shallowness of most estuaries, there is the necessity of permanent dredging of the river bed leading access to the port facilities, in order to make a clear and safe way for large ships.
On the other hand, it is known that dredging not only removes sediment, but considerably alters the macrofaunal
assembly inhabiting dredged areas (e.g. STRICKNEY;
PERLMUTTER, 1975; NEWELL et al., 2004; COOPER et al., 2011) and disposal sites (e.g. BOLAN; REES, 2003; VIVAN et al., 2009).
Dredging can modify soft bottom habitats, compromising ecosystem biodiversity and functionality
(SKILLETER et al., 2006) and the impacts associated
to dredging include alterations in the structure and composition of benthic assembly, favoring the dominance of opportunistic organisms. The impacts related to dredging and recovery times of the macrofauna are highly variable
(HARVEY et al., 1998) and resilience times can last from
a few months (CRUZ-MOTA; COLLINS, 2004) to more than a decade after the disturbances (FRASER et al., 2006).
Now days, most of the literature concerning the impacts of soft-bottom dredging is focused on maintenance dredging and disposal sites. Less attention is been given
to impacts inlicted by capital dredging at dredged sites
(WARE et al., 2010).
The soft-bottom macrofauna is fundamental for maintaining aquatic ecosystems, as they play an important role in sediment stability, organic matter cycling and turbidity control, besides being an important source of food for larger organisms, many of which are of
considerable economic value (THRUSH; DAYTON,
2002). For example, the gastropod Heleobia australis
(D’Órbigny, 1835) is one of the main food sources of
estuarine ish commercially exploited in southern Brazil
(BEMVENUTI, 1997). The tanaid Monokalliapseudes schubarti (GUTU 2006) is abundant in subtropical estuaries, and is consumed by many species of birds and
ish (FREITAS-JÚNIOR et al., 2013). Polychaetes are also
abundant in subtropical estuaries, acting as an important
part of the trophic web (FAUCHALD; JUMARS, 1979;
PAGLIOSA; BARBOSA, 2006; SANTI; TAVARES, 2009).
The Itajaí-Açu river estuary in Southern Brazil is one of the greatest urban centers along the coast of the Santa Catarina state sheltering one of the largest port complexes
in the country and also many ish processing industries
(PEREIRA, 2003). The main sources of pollution of the river are sanitary waste, garbage and industrial wastewater mainly from textile, metallurgy and galvanoplastic industries spread around the water basin (PEREIRA-FILHO et al., 2010).
Dredging of the Itajaí-Açu river channel has occurred since 1835, although the operations became more intense with the increase in maritime commerce in the 1960´s
(CARVALHO, 1996). The irst dredging to deepen the
navigation channel occurred in 1978 and successive events took place in 1983, 1996, and 2006 while maintenance dredging since 2000 has been removing around 2x10⁶m³
per year (INPH, 2012). Although the estuary has been target of several environmental researches throughout the years, only a few aimed to analyze the impacts of dredging operations on the benthic assemblages, such as VIVAN et al. (2009).
In spite of the above mentioned, the present study evaluated the impacts of a capital dredging that took place in 2011, altering the depth of the navigation channel from -12m to -14m removing around 8x10⁶m³ of sediment.
Our goals were to: (1) determine the spatio-temporal distribution of the macrofaunal assembly inhabiting the low Itajaí-Açu river estuary, (2) to relate the distribution pattern to the environmental variables and (3) to evaluate
the inluence of capital dredging upon the structure and
MATERIAL AND METHODS
Study area
The Itajaí-Açu river estuary is located on a coastal plain, being characterized as salt wedge type. Monthly average river discharge is around 230 m3/s, and tide
pattern is mixed semi-diurnal, with average interval of 0.8m (SCHETTINI, 2002). The Itajaí-Açu River represents 90% of the freshwater input to the estuary, draining a 15500 km² water basin (PEREIRA-FILHO et
al., 2010). Climate at the low estuary can be deined as
moist-subtropical, characterized by evenly distributed rainfall along the year and average air temperature above 18º C (GAPLAN, 1986).
Data collection and sampling design
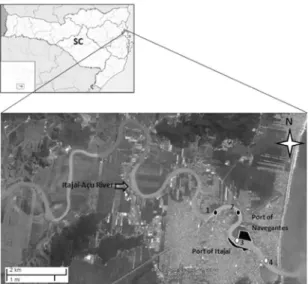
We established four sampling stations along the low estuary with 1500m spacing, two of which were established upstream from the port complex and were not dredged (station 1: 26°53’11.4’’S; 48°41’02.62’’W and station 2: 26°53’25.51’’S; 48°40’04.62’’W) the other two corresponded to the dredged navigation channel (station 3: 26°53’58.6’’S; 48°39’41.26’’W and station 4: 26°54’31.07’’S; 48°39’4.68’’W). All sampling stations were located on urbanized areas, virtually deprived of riparian vegetation (Figure 1).
2011 due to technical issues. Capital dredging occurred from May 2011 to December 2011 except for September
2011 when a major lood interrupted the operations.
Thus for the statistical analysis we considered two
ixed and orthogonal factors: station (4 levels) and time
(19 levels) (Figure 2), in order to test the null hypothesis
of no spatio-temporal diferences in the assemblages of
dredged and non-dredged stations.
Figure 1. Study area and the sampling stations (1-4) along the low estuary. Stations 1 and 2 were located upstream from the port area and were not dredged while stations 3 and 4 were amidst the dredged area.
A total of 19 monthly sampling campaigns were conducted from December 2010 to October 2012, although
there was no sampling efort from January 2011 to April
Figure 2. Sampling design totalizing 228 samples. Stations 1 and 2 were located upstream from the port area and were not dredged while stations 3 and 4 were amidst the dredged area.
Sampling was conducted in triplicates, for a total of 228 samples. We used a 0.042 m2 Van-Veen grab for all
samples.
Sampled organisms were washed through 0.5 mm
mesh sieves. Retained individuals were ixed in 4%
formalin solution and preserved in 70% ethanol. Sorting
and identiication were conducted with a stereoscopic
microscope.
A fourth sample was performed at each station/ time for granulometric analysis, performed according to Suguio (1973). Sediment composition was expressed by the percentages of sand, silt and clay (mud), organic matter and carbonate.
Data for temperature (ºC), salinity, pH, dissolved oxigen (mg/L) and turbidity (NTU) were measured with
a Mulatiparameter Water Quality Sonde YSI 6600 V2™,
and river discharge data were courtesy from the National Agency of Electric Energy (ANEEL), and expressed as monthly average m3/s.
Data analysis
was normalized by the standard deviation (CLARKE; WARWICK, 1994; CLARKE; GORLEY, 2006).
The structure of the macrofauna was represented by the average and associated standard-error of the indicators of abundance (N) and species richness (S) through space and time.
For similarity analysis, we eliminated all taxa with relative abundance lower than 0.01%. The Bray-Curtis
coeicient (CLARKE; GORLEY, 2006) was used to
calculate similarities among the abundances (log10(x+1) transformed), and a Permutational Multivariate Analysis of Variance (PERMANOVA) was applied on the resulting resemblance matrix, considering the two factors previously described. For the interpretation of
signiicances, we considered permutation p-values, as the permutation number (9999) was considered high (ANDERSON, 2005).
Aiming to visualize patterns of spatio-temporal variation among similarities of macrofauna composition, we performed a Hierarchical Clustering analysis (CLUSTER) applied on the above described resemblance matrix.
Also, in order to identify the main species responsible for the separation of groups evidenced by the CLUSTER diagram, we performed a Similarity Percentages analysis (SIMPER), only considering the taxa which contributed for the accumulated dissimilarity of 90%.
At last, we evaluated the correlation between the biotic and abiotic matrices through Canonical Analyses of
Principal Coordinates (CAP). Signiicances of correlations
were tested through 9999 permutations (ANDERSON, 2005).
All analyses were performed using the PRIMER 6© version 6.1.11 and PERMANOVA +© version 1.0.1
softwares.
RESULTS
Abiotic variables
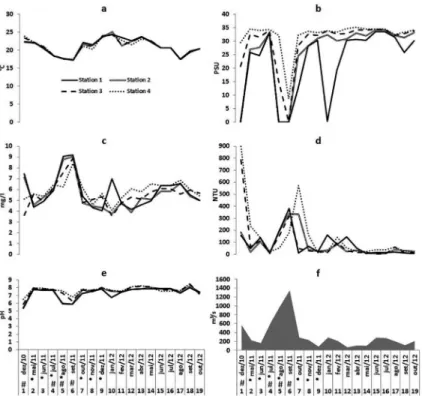
Temperature showed a seasonal pattern, ranging from
17°C in August 2011 to 24°C in January 2012 (Figure 3a).
Average overall salinity considering all sampling stations was 27.4 with a gradient of increasing salinity towards the river mouth, and was reduced in all stations
during the lood event in September 2011. Maritime inluence was strongest at stations 3 and 4, and in January
2012 there was a great drop in salinity at station 1 (Figure 3b).
Dissolved oxigen and turbidity followed the river discharge trend. At station 4, turbidity was higher during dredging, mainly in October 2011 (Figure 4c and Figure 4d).
The pH showed a gradient of variation similar to that observed for salinity, with higher values towards the river mouth and raging from 5 to 8 throughout the study (Figure 4e).
River discharge showed great oscillation in short periods of time, ranging from 1348 m³/s in September 2011 to 68.5m³/s in March 2012 and with an overall average of 325.7 m³/s. River discharge was higher than 400m³/s (which we considered intense river discharge) in December 2010,
July, August and September 2011 (Figure 4f).
With relation to the sediment variables (sand, mud, organic matter and carbonate) there was considerable
luctuation throughout the study, without a clear pattern.
Sand percentage was above 50% during dredging at stations 3 and 4, while stations 1 and 2 showed higher
content of sand during the lood event (Figure 5a). The
percentages of mud behaved inversely, becoming higher
at stations 3 and 4 during the lood (Figure 5b).
Carbonate and organic matter followed the same trend observed for mud, although never counting for more than 20% of sediment composition.
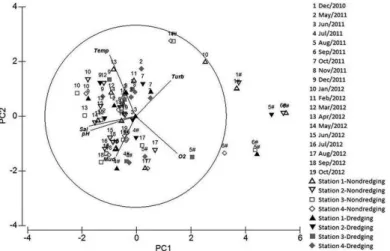
The two irst axes of the PCA explained 71.9% of
the variation among samples. Salinity, pH and dissolved oxygen had the strongest weight in the formation of axis 1 which explained 50.7% of total variation. Temperature had the strongest weight in the formation of axis 2 which explained 21.2% of total variation (Table 1). Overall,
the ordination of samples evidenced the efect of river
discharge along axis 1, with samples from December 2010, August 2011 and September 2011 (river discharge greater than 400m³/s) showing lower salinity and pH. The increase in turbidity and dissolved oxygen during those periods corroborates that suggestion. Along axis 2 we could
notice the efect of seasonality upon the environmental
variables, with lower temperatures associated to colder months. Along axis 2 it was also possible to notice the
efect of dredging, with a tendency of coarser sediment
and elevated turbidity during the operations (Figure 5).
Biotic variables
A total of 21839 organisms were sorted and identiied
Figure 3. Environmental variables and river discharge along the sampling stations. Stations 1 and 2 were located upstream from the port area and were not dredged while stations 3 and 4 were amidst the dredged area. a= temperature, b= salinity, c= dissolved oxigen, d= turbidity and e= river discharge. * indicates capital dredging while # indicates river discharge above 400m3/s.
Figure 4. Sediment composition along the sampling stations. a= sand; b= silt/clay; c= carbonate; d= organic matter. *indicates capital dredging while # indicates river discharge above 400m3/s. Stations 1 and 2 were located upstream from the port area and were not dredged while stations 3
and 4 were amidst the dredged area.
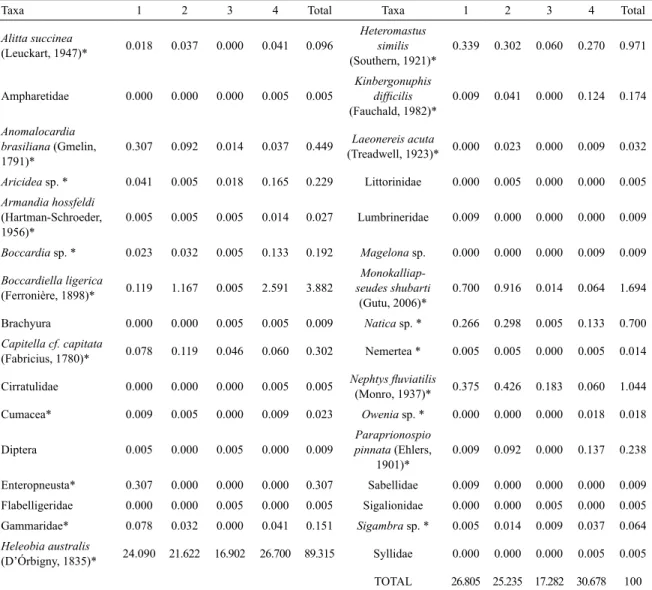
The gastropod Heleobia australis (D’Órbigny, 1835) accounted for almost 90% of all sampled organisms. Other representative taxa were the annelids Heteromastus similis
(Southern, 1921) (1%), Nephtys luviatilis (Monro, 1937) (1%), Boccardiella ligerica (Ferronière, 1898) (3,9%) and the tanaid Monokalliapseudes shcubarti (Gutu, 2006) (1,7%).
The greatest total relative abundance (30.6%) was observed at station 4, close to the river mouth while the lowest was observed at station 3 (17.2%). Stations 1 and 2 (upstream from the port facility) showed similar total relative abundances (26.8% and 25.2%, respectively).
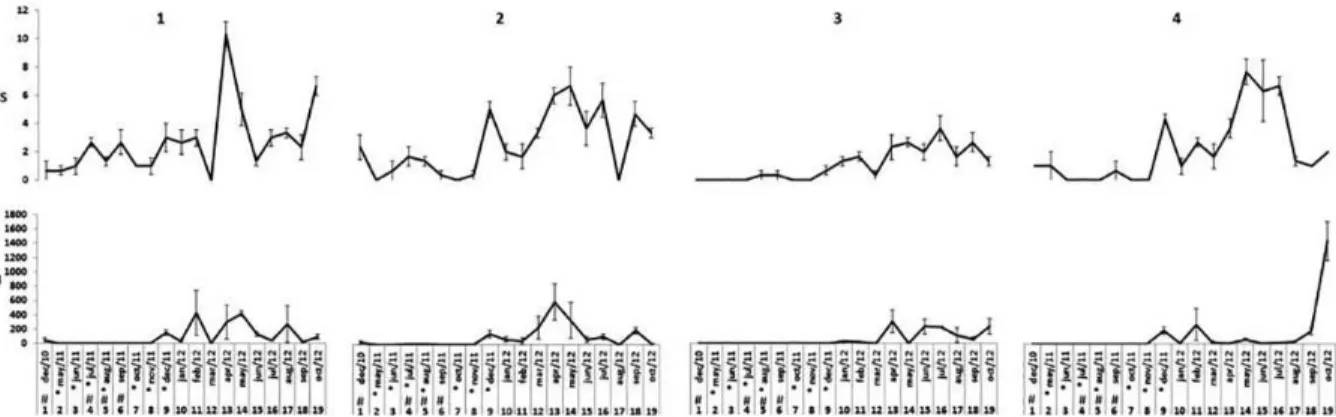
Overall, the species richness (S) showed higher average
Figure 5. Principal Components Analysis (PCA). Salinity, pH and dissolved oxigen had the strongest weight in the formation of axis 1 which explained 50.7% of the distribution of samples. Temperature had the strongest weight in the formation of axis 2 which explained 21.2% of the variation. Stations 1 and 2 were located upstream from the port area and were not dredged while stations 3 and 4 were amidst the dredged area. Temp=temperature, Turb=turbidity, Sal=salinity, Mud=silt and clay, O2=dissolved oxigen and # means river discharge above 400m3/s. The illed
symbols represent dredging activity.
Table 1. Environmental variables and respective corre-lations to the principal components of the PCA, which explained 71.9% of the distribution of samples.
Variable PC1 PC2
Temp 0.286 0.674
Sal 0.515 -0.109
O2 -0.458 -0.407
pH 0.498 -0.157
Turb -0.386 0.39
Mud 0.215 -0.439
Temp: Temperature, Sal: Salinity, O2: Dissolved oxygen, Turb: Turbidity, Mud: silt and clay.
The greatest richness was observed at station 1 with about 10 species in April 2012. Richness was reduced at stations 1 and 2 when river discharge was above 400m³/s, although
stations 3 and 4 appeared to be more drastically afected
coinciding with dredging activity. Station 3 showed the lowest values of species richness after 13 months of post dredging surveys, with an average number lower than 4 (Figure 6).
With relation to average density (N) we observed great variation at the monthly scale. Maximum density was recorded at station 4 in October 2012, with around 1400/0.042m². Excluding that period of time, average density was higher at stations 1 and 2. All stations showed lower densities when river discharge was above 400m³/s and also during dredging operations, although stations 1 and 2 had more prominently peaks of abundance and richness after the disturbances (Figure 6).
The PERMANOVA indicated signiicance for factors
station and time, as well as for the interaction of factors,
indicating diferent temporal variation at each sampled
station (Table 3). The diagram obtained through CLUSTER analysis corroborated the PERMANOVA results.
Two groups (I and II) were clear after the analysis. Group I was characterized mostly by samples taken during the dredging activity. Except from time 9 all samples from the dredged stations 3 and 4 during the operations belong to group I. Stations 1 and 2 had three times more samples taken during the dredging allocated at group II. With relation to river discharge, all sampling stations had the majority of samples taken during river discharge above 400m/s allocated in group I (Figure 7).
The SIMPER analysis showed an average dissimilarity of 95.35% between groups I and II, and seven species contributed to 90.32% of that dissimilarity. Group I had a greater abundance of N. luviatlis and lowest numbers for the other six species. Group II had lower abundance of N. luviatlis and greater abundance of the other species compared to group II, specially H. australis, which showed the higher dissimilarity between the groups and also the highest dissimilarity/standard deviation ratio (Table 4).
Biotic/abiotic interaction
The CAP analysis evidenced signiicant correlations
between the biotic and abiotic matrices (p=0,0002). The
two irst canonical correlations were 0.63 and 0.42 and the
Table 2: Relative abundance (%) along the four sampling stations (1-4). Bold* taxa were selected to statistical analysis.
Taxa 1 2 3 4 Total Taxa 1 2 3 4 Total
Alitta succinea
(Leuckart, 1947)* 0.018 0.037 0.000 0.041 0.096
Heteromastus similis
(Southern, 1921)*
0.339 0.302 0.060 0.270 0.971
Ampharetidae 0.000 0.000 0.000 0.005 0.005
Kinbergonuphis
diicilis (Fauchald, 1982)*
0.009 0.041 0.000 0.124 0.174
Anomalocardia brasiliana (Gmelin, 1791)*
0.307 0.092 0.014 0.037 0.449 Laeonereis acuta
(Treadwell, 1923)* 0.000 0.023 0.000 0.009 0.032
Aricidea sp. * 0.041 0.005 0.018 0.165 0.229 Littorinidae 0.000 0.005 0.000 0.000 0.005
Armandia hossfeldi
(Hartman-Schroeder, 1956)*
0.005 0.005 0.005 0.014 0.027 Lumbrineridae 0.009 0.000 0.000 0.000 0.009
Boccardia sp. * 0.023 0.032 0.005 0.133 0.192 Magelona sp. 0.000 0.000 0.000 0.009 0.009
Boccardiella ligerica
(Ferronière, 1898)* 0.119 1.167 0.005 2.591 3.882
Monokalliap-seudes shubarti
(Gutu, 2006)*
0.700 0.916 0.014 0.064 1.694
Brachyura 0.000 0.000 0.005 0.005 0.009 Natica sp. * 0.266 0.298 0.005 0.133 0.700
Capitella cf. capitata
(Fabricius, 1780)* 0.078 0.119 0.046 0.060 0.302 Nemertea * 0.005 0.005 0.000 0.005 0.014
Cirratulidae 0.000 0.000 0.000 0.005 0.005 Nephtys luviatilis
(Monro, 1937)* 0.375 0.426 0.183 0.060 1.044
Cumacea* 0.009 0.005 0.000 0.009 0.023 Owenia sp. * 0.000 0.000 0.000 0.018 0.018
Diptera 0.005 0.000 0.005 0.000 0.009
Paraprionospio pinnata (Ehlers,
1901)*
0.009 0.092 0.000 0.137 0.238
Enteropneusta* 0.307 0.000 0.000 0.000 0.307 Sabellidae 0.009 0.000 0.000 0.000 0.009
Flabelligeridae 0.000 0.000 0.005 0.000 0.005 Sigalionidae 0.000 0.000 0.005 0.000 0.005 Gammaridae* 0.078 0.032 0.000 0.041 0.151 Sigambra sp. * 0.005 0.014 0.009 0.037 0.064
Heleobia australis
(D’Órbigny, 1835)* 24.090 21.622 16.902 26.700 89.315 Syllidae 0.000 0.000 0.000 0.005 0.005
TOTAL 26.805 25.235 17.282 30.678 100
The variables turbidity and temperature had the most weight in the formation of axis 1, while pH, turbidity and salinity had the strongest weight in the formation of axis 2 (Table 5).
The separation of groups I and II was evident along the horizontal axis, where the elevated turbidity was mostly associated to periods of dredging and to a lesser extent to river discharge above 400m/s. The higher temperatures
also inluenced the increase in species richness and
abundance observed in group 2.
The separation of samples along axis 2 was not quite
clear, but it was possible to observe some efect of the
ascending salinity, pH, oxygen and temperature in the increased species richness observed at group 2 (Figure 8).
DISCUSSION
The environmental variables analyzed throughout this study showed constant oscillation and the pattern of variation was slightly distinct when comparing stations 1 and 2 to stations
3 and 4. The upstream stations 1 and 2 were more inluenced
by river discharge, probably because they were closer to the Itajai-Mirim river mouth, a smaller tributary on the low estuary. Meanwhile as expected, the downstream stations 3 and 4 had
its abiotic variables more afected by dredging, although some efects of it (e.g. higher turbidity) could be observed for stations
Figure 6. Indicators of Richness (S) and abundance (N) for the macrofauna along the sampling stations (1-4), represented by average per sample (0,042m2) and standard errors. Stations 1 and 2 were located upstream from the port area and were not dredged while stations 3 and 4 were amidst
the dredged area. *indicates capital dredging while # indicates river discharge above 400m3/s.
Table 3. Results of PERMANOVA analysis based on Bray-Curtis similarity matrix, representing all taxa responsible by
more than 0,01% relative abundance. Bold* p values indicate signiicant variation.
df: Degrees of freedom.
Source of variation df F p
Time 18 17.977 0.0001*
Station 3 9.78 0.0001*
Time x Station 54 3.5737 0.0001*
Residual 152
Total 227
Figure 7. Hierarchical clustering (CLUSTER) based on the Bray-Curtis similarity matrix considering the selected taxa. Stations 1 and 2 were located upstream from the port area and were not dredged while stations 3 and 4 were amidst the dredged area. #river discharge above 400m3/s and
the illed symbols represent the dredging activity.
Our study revealed an assembly composed basically by the polychaetes H. similis, N. luviatilis and B. ligerica,
the tanaid M. schubarti and the gastropod H. australis. This pattern of few species composing the majority of the
Table 4. SIMPER analysis based on groups (I and II) evidenced in CLUSTER analysis. Av. abundance = average abundance, Av. Diss. = average dissimilarity, Diss./SD = dissimilarity/standard deviation ratio, Cont.% = percentual contribution for between group dissimilarity, Cum. % = accumulated percentual contribution for between group dissimilarity.
Group I Group II
Av. Diss. Diss./SD Cont.% Cum.%
Species Av. abundance
H. australis 0.04 3.71 53.53 2.11 56.14 56.14
N. luviatilis 0.16 0.66 8.31 0.97 8.72 64.86
H. similis 0.03 0.62 7.92 0.89 8.31 73.17
B. ligerica 0.01 0.62 5.36 0.57 5.62 78.78
M. shubarti 0.06 0.54 5.3 0.76 5.55 84.34
C. capitata 0.01 0.26 3.05 0.53 3.2 87.54
A. brasiliana 0.04 0.24 2.65 0.57 2.78 90.32
*Average between group dissimilarity = 95.35
Table 5. Environmental variables and respective correlations to the canonical axis that explained 73% of the distribution of samples.
Temp: Temperature, Sal: Salinity, O2: Dissolved oxygen, Turb: Turbidity, Mud: Silt and clay.
Variable CAP1 CAP2
Temp -0.538 -0.378
Sal -0.213 -0.444
O2 -0.285 -0.291
pH -0.038 -0.544
Turb 0.743 -0.498
Mud -0.176 0.178
in southeast Brazil also showed lower species richness at its inner and more polluted sectors (MENDES et al., 2006; SANTI; TAVARES, 2009; PEREIRA et al., 2013) despite hosting around 300 species benthic macrofauna (SOARES-GOMES et al., 2016). Anthropic interventions and natural variability of the ecosystem end up favoring opportunistic and resilient species in the Itajaí-Açu river estuary, and the dominance of only a few species was also observed for the local carcinofauna (LEITE; PEZUTO, 2012).
Opportunistic organisms are conspicuous in estuarine ecosystems, since they are able to quickly colonize post-disturbance environments. Such assemblages tend to be composed by a few dominant species reaching high abundances (PAGLIOSA; BARBOSA, 2006). The most abundant species in our study was H. australis of the Hidrobriidae family. It is an epibenthic gastropod, typical in mixohaline environments and able to stand great variations in salinity. Its distribution is associated to muddy-sand substrates, mostly in shallow estuaries (BEMVENUTI, 1987; FRANCESCO; ISLA, 2004).
The dominance of H. australis in our study as well as its rapid colonization post dredging corroborates with the
Figure 8. Canonical analysis of Principal Coordinates (CAP). The two
irst canonical correlations were 0.63 and 0.42 and the canonical axes
explained 73% of the distribution of samples. Turbidity and temperature had the strongest weight in the formation of axis 1 while pH, turbidity and salinity had the strongest weight in the formation of axis 2. Stations 1 and 2 were located upstream from the port area and were not dredged while stations 3 and 4 were amidst the dredged area. Turb=turbidity, Sal=salinity, Temp=temperature, Mud=silt and clay, #=river discharge
above 400m3/s and the illed symbols represent the dredging activity.
indings of ECHEVERRÍA et al. (2010), which evidenced
greater densities of this gastropod at some inner and more degraded areas of the urbanized estuary of Guanabara
Bay in Rio de Janeiro, suggesting its tolerance to habitat
contamination and hypoxic sediments. H. australis is highly mobile, and it is capable of creating a gas bubble inside its
shell, which enables it to loat away along the currents when
facing environmental stresses (e.g. dredging), and to rapidly settle again in less disturbed sites. This behavior helps explaining the proliferation of H. australis at our study area.
the increase in macrofaunal density post disturbances was also a result of a clear increase in the abundances of H. australis (EGRES et al., 2012) and in some poluted coastal regions of Uruguay H. australis is also the dominant species (VENTURINI et al., 2004).
We found H. australis dominant mostly at stations 3 and 4, when the dredging operations were not in place, suggesting its displacement in spite of the operations. Nevertheless the epibenthic habit of H. australis apparently made it more vulnerable to elevated river discharge, which apparently carried them away towards the river mouth. The high average dissimilarity and dissimilarity/standard deviation ratio obtained through the SIMPER analysis also made H. australis favorable for discriminating impacts
of dredging on the Itajaí-Açu river estuary (CLARKE; GORLEY, 2006)
The PERMANOVA evidenced signiicant alterations in the assembly suggesting it was afected by both the
environmental heterogeneity and disturbances occurred
through time. Signiicant diference observed for the
interaction of the analyzed factors indicated that many
sources of variation inluenced the assembly composition
and structure (ANDERSON et al., 2008; UNDERWOOD, 2000). The observed high variation in abundances and species richness is a sign of constant environmental stress
(WARWICK; CLARKE, 1993).
Research related to the spatial distribution of macrofauna in estuarine areas tends to point out higher abundance and richness towards the maritime region, with an impoverishment of the assemblages related to lower salinity (BEMVENUTI, 1997; BEMVENUTI; NETO, 1998) and higher levels of pollution (MUNIZ et al., 2011). That pattern was observed at Guanabara Bay, where mollusc, polychaete and crustacean assemblages were impoverished at its inner sectors due to organic enrichment and hypoxia coupled with prevailing patterns of circulation (MENDES et al., 2007; SOARES-GOMES et al., 2012; VAN DER VEN et al., 2006). In spite of that we would expect greater abundance and richness of the macrofauna of the Itajaí-Açu estuary at the outer stations 3 and 4, but that pattern was not clear.
The fact that stations 1 and 2 presented the higher indicators of abundance and richness during dredging suggests its impact upon stations 3 and 4 where abundance and richness were considerably lower. Station 3, closest to the port area and about 3 km from the river mouth, showed the lower values of abundance and richness in
our study, suggesting it is the most afected by dredging
(BEMVENUTI et al., 2005). This station was part of the dredged area and the closest to the turning basin where the sediment is constantly being revolved.
However, station 4 (further downstream) showed higher abundance and richness in spite of the disturbances when compared to station 3, probably because of coarser sediment which favors the recuperation of the assembly (DERNIE et al., 2003). Sediment composition was also responsible for alterations in benthic assemblages in Uruguayan estuaries (GIMENEZ et al., 2014).
Besides dredging, river discharge inluenced the
structure and composition of the assemblage as we could observe lower abundance and richness in all stations when river discharge was above 400m³/s. Higher salinity also
appears to have had a positive inluence on the assemblage
at station 4.
Research conducted by LEITE and PEZUTO (2012) indicated that the carcinofauna of the Itajaí-Açu river is
signiicantly afected by river discharge. They noticed reduction in species abundance and richness during lood
events although the assembly was reestablished a few
months after the lood. The same pattern was observed in
our study.
Intense river discharge lowers salinity levels and can cause the complete extrusion of the salt wedge from the Itajaí-Açu river estuary (LEITE; PEZUTO, 2012), carrying
iner sediment towards the adjacent shelf thus resulting in
coarser sediment in the river bed. The greatest abundances
in this study were recorded in iner sediment, where H. australis prevailed.
The CAP diagram showed that the gain in richness
and abundance was signiicantly related to the increase in
salinity and temperature, with low turbidity (river discharge below 400m3/s2 and in the absence of dredging). Turbidity
was also one of the main driving forces inluencing
the benthic assemblage of coastal lagoons in Uruguay (MEERHOFF et al., 2013).
Our results pointed that despite the discrete efect of
seasonality and salt wedge intrusion upon the assembly, the
disturbances caused by loods and dredging operations are
the main regulators of it. Impacts associated to dredging were stronger than those caused by river discharge, as we had a depleted assembly during the operations at stations 3 and 4.
through this study was estimated in 1.3x10⁶m³/year. There
was an increase in the silting rate after the operations, as the salt wedge remains longer in the estuary thus increasing sediment deposition. The salt wedge could be around 60% of the time along the year in the port region before the capital dredging of 2011, and after that it remained for about 80% of the time along the year.
That being said, the deeper the navigational channel
gets, the greater efort of maintenance dredging is required
to keep the water depth and this could compromise the assembly discussed through this paper, as dredging activity showed itself deleterious for the macrofauna.
We showed through this paper that there is the necessity to continuously monitor the macrofaunal assembly on the Itajaí-Açu river estuary, in order to understand the impacts caused by dredging activities. The present legal mechanisms (CONAMA 454/12) does not describe a protocol for monitoring the macrofaunal assembly of port areas, and a routine should be developed to be added to it.
ACKNOWLEDGMENTS
The authors are thankful to the Coordenação de Aperfeiçoamento de Pessoal de Nível Superior (CAPES)
for inancial support and to the Port of Itajaí for the
collaboration.
REFERENCES
ANDERSON, M. J. Permanova: a FORTRAN computer
program for permutational multivariate analysis of variance. Auckland: Department of Statistics, University of Auckland, New Zealand, 2005. 24 p.
ANDERSON, M. J.; GORLEY, R. N.; CLARKE, K. R.
Permanova+ for PRIMER: Guide to software and statistical methods. Auckland: Department of Statistics, University of Auckland, New Zealand, 2008.
BEMVENUTI, C. E. Predation efects on a benthic community in
estuarine soft sediments. Atlântica, v. 9, p. 5-32, 1987. BEMVENUTI, C. E. Trophic structure. In: SEELIGER, U.;
ODEBRECHT, C. CASTELLO, L. (Eds.). Subtropical convergence marine ecosystem. The coast and the sea in the warm temperate southwestern Atlantic. Heidelberg: Springer-Verlag, 1997. p. 70-73.
BEMVENUTI, C. E.; NETO, S. Distribution and seasonal patterns of the sublittoral benthic macrofauna of Patos Lagoon (South Brazil). Rev. Bras. Biol., v. 58, n. 2, p. 211-221, 1998. BEMVENUTI, C. E.; ANGONESI, L. G.; GANDRA, M. S.
Efects of dredging operations on soft bottom macrofauna
in a harbor in the Patos Lagoon estuarine region of southern
Brazil. Braz. J. Biol., v. 65, n. 4, p. 573-581, 2005.
BOLAN, S. G.; REES, H. L. Minimizing impacts of maintenance dredged material disposal in the coastal environment: a habitat approach.Environ. Manage., v. 32, n. 2, p. 171-188, 2003.
BRASIL. INSTITUTO NACIONAL DE PESQUISAS HIDROVIÁRIAS (INPH). Estimativa preliminar da taxa de assoreamento após as obras de ampliação do porto de Itajaí
– SC. Brasília: Presidência da Republica, Secretaria Especial
de Portos, 2012.
CARVALHO, J. L. B. As dragagens no porte de Itajaí: aspectos
econômicos. Dynamis, v. 4, n. 17, p. 76-87, 1996.
CLARKE, K. R.; GORLEY, R. N. PRIMER v6: user manual/
tutorial. Plymouth: PRIMER-E, 2006. 192 p.
COSTANZA, R.; D’ARGE, R.; DE GROOT, R.; FARBER, S.;
GRASSO, M.; HANNON, B.; LIMBURG, K.; NAEEM, K.; O’NEILL, R.V.; PARUELO, J.; RASKIN, R. G.; SUTTON,
P.; VAN DER BELT, M. The value of the world’s ecosystem services and natural capital. Nature, v. 387, p. 253-260, 1997.
COOPER, K. M.; CURTIS, M.; WAN HUSSIM, W. M. R.; BARRIO FROJÁN, C. R. S.; DEFEW, E. C.; NYE, V.;
PATERSON, D. M. Implications of dredging induced changes in sediment particle size composition for the structure and function of marine benthic macrofaunal communities. Mar. Pollut. Bull., v. 62, n. 10, p. 2087-2094, 2011.
CRUZ-MOTTA, J. J.; COLLINS, J. Impacts of dredged material
disposal on a tropical soft-bottom benthic assemblage. Mar. Pollut.. Bull., v. 48, n. 3-4, p. 270-280, 2004.
DERNIE, K. M.; KAISER, M. J.; WARWICK, R. M. Recovery
rates of benthic communities following physical disturbance.
J. Anim. Ecol., v. 72, n. 6, p. 1043-1056, 2003.
ECHEVERRÍA, C. A.; NEVES, R. A. F.; PESSOA, L. A.; PAIVA,
P. C. Spatial and temporal distribution of the gastropod
Heleobia australis in an eutrophic estuarine system suggests a metapopulation dynamics. Nat. Sci., v. 2, n. 8, p. 860-867, 2010.
EGRES, A. G.; MARTINS, C. C.; OLIVEIRA, V. M.; LANA,
P. C. Efects of an experimental in situ diesel oil spill on the benthic community of unvegetated tidal lats in a subtropical
estuary (Paranaguá Bay, Brazil). Mar. Pollut. Bull., v. 64, n. 12, p. 2681-2691, 2012.
FAUCHAULD, K.; JUMARS, P. A. The diet of worms: A study
of polychaete feeding guilds. Oceanogr. Oceanogr. Mar. Biol. Annu. Rev., v. 17, p. 193-285, 1979.
FRANCESCO, C. G.; ISLA, F. I. The life cycle and growth of
Heleobia australis (D’orbigny, 1835) and h. conexa (Gaillard, 1974) (gastropoda: rissooidea) in mar Chiquita coastal lagoon
(Argentina). J. Molls. Stud., v. 70, n. 2, p. 173-178, 2004. FRASER, C.; HUTCHINGS, P.; WILLIAMSON, J. Long-term
changes in polychaete assemblages of Botany Bay (NSW, Australia) following a dredging event. Mar. Pollut. Bull., v. 52, n. 9, p. 997-1010, 2006.
FREITAS-JÚNIOR, F.; CHRISTOFFERSEN, M. L.; ARAÚJO, J. P.; BRANCO, J. O. Spatiotemporal distribution and
population structure of Monokalliapseudes schubarti
(Tanaidacea: Kalliapseudidae) in as estuary in Southern Brazil. Sci. World J., v. 2013, p. 1-9, 2013.
GABINETE DO PLANEJAMENTO E COORDENAÇÃO GERAL - GAPLAN. Atlas de Santa Catarina. Rio de Janeiro:
Aerofoto Cruzeiro, 1986. 173 p.
GIMENEZ, L.; VENTURINI, N.; KANDRATAVICIUS, N.; HUTTON, M.; LANFRANCONI, A.; RODRÍGUEZ, M.;
BRUGNOLI, E.; MUNIZ, P. Macrofaunal patterns and animal-sediment relationships in Uruguayan estuaries and
coastal lagoons (Atlantic coast of South America). J. Sea.
HARVEY, M.; GAUTHIER, D.; MUNRO, J. Temporal changes
in the composition and abundance of the macro-benthic invertebrate communities at dredged material disposal sites
in the Anse a Beauils Bais des Chaleurs, Eastern Canada.
Mar. Pullut. Bull., v. 36, n. 1, p. 41-55, 1998.
KENNISH, M. J. Environmental threats and environmental future
of estuaries. Environ. Conserv., v. 29, n. 1, p. 78-107, 2002. LEITE, I. P.; PEZZUTO, P. R. Efeito de um evento extremo
de enchente sobre os decápodos infralitorais do estuário do
Itajaí-Açu, SC, Brasil. Braz. J. Aquat. Sci. Technol., v. 16, n.
12, p. 13-26, 2012.
MEERHOFF, E; RODRÍGUEZ-GALLEGO, L.; GIMÉNEZ,
L.; CONDE, D.; MUNIZ, P. Spatial patterns of macrofaunal community structure in coastal lagoons of Uruguay. Mar. Ecol. Prog. Ser., v. 492, p. 97-110, 2013.
MENDES, C. L. T.; SOARES-GOMES, A.; TAVARES, T. Seasonal and spatial distribution of sublittoral soft-bottom
mollusks assemblages at Guanabara Bay, Rio de Janeiro, Brazil. J. Coast. Res., v. 39, p. 1877-1881, 2006.
MENDES, C. L. T.; TAVARES, M.; SOARES-GOMES, A.
Taxonomic suiciency for soft-bottom sublittoral mollusks
assemblages in a tropical estuary, Guanabara Bay, Southeast Brazil. Mar. Pollut. Bull., v. 54, n. 4, p. 377-384, 2007.
MUNIZ, P.; VENTURINI, N.; HUTTON, H.;
KANDDRATAVICIUS, N.; PITA, A.; BRUGNOLI, E.; BURONE, L.; GARCÍA-RODRÍGUEZ, F. Ecossystem
health of Monetevideo coastal zone: a multi approach using
some diferent benthic indicators to improve a ten-year-ago assessment. J. Sea. Res., v. 65, n. 1, p. 38-50, 2011.
NEWELL, R. C.; SEIDERER, L. J.; SIMPSON, N. M.; ROBINSON, J. E. Impacts of marine aggregate dredging on benthic macrofauna of the south coast of the United Kingdom.J. Coast. Res., v. 20, n. 1, p. 115-125, 2004.
PAGLIOSA, P. R.; BARBOSA, F. A. R. Assessing the environment-benthic fauna coupling in protected and urban areas of Southern Brazil. Biol. Conserv., v. 129, n. 3, p. 408-417, 2006.
PEREIRA-FILHO, J.; SPILLERE, L. C.; SCHETTINI, C. A. F.
Dinâmica de nutrientes na região portuária do estuário do rio Itajaí-Açu, SC. Atlântica, v. 25, n. 1, p. 11-20, 2003.
PEREIRA-FILHO, J.; RÖRIG, L. R.; SCHETTINI, C. A. F.;
SOPPA, M. A.; SANTANA, B. L.; SANTOS, J. E. Spatial changes in the water quality of Itajaí-Açu luvial estuarine system, Santa Catarina, Brazil. An. Acad. Bras. Ciên., v. 83,
n. 4, p. 963-982, 2010.
PEREIRA, R. M. F. A. Formação sócio-espacial do litoral de
Santa Catarina (Brasil): gênese e transformações recentes.
Geosul, v. 18, n. 35, p. 99-129, 2003.
PEREIRA, C. V. P.; PESSOA, L. A.; FREITAS, M. A. V.;
ECHEVERRÍA, C. A. Recovery Process on Soft-Bottom Macrobenthic Communities after Artiicial Disturbance in Tropical Polluted Estuary (Guanabara Bay, Rio de Janeiro, Brazil). Open J Mar. Sci., v. 3, p. 161-166, 2013.
ROSA, L. C.; BEMVENUTI, C. E. Temporal variability of the estuarine macrofauna of the Patos Lagoon, Brazil. Rev. Biol. Mar. Oceanogr., v. 41, n. 1, p. 1-9, 2006.
SANTI, L.; TAVARES, M. Polychaete assemblage of an impacted
estuary, Guanabara Bay, Rio De Janeiro, Brazil. Braz. J.
Oceanogr., v. 57, n. 4, p. 287-303, 2009.
SCHETTINI, C. A. F. Caracterização física do estuário do rio Itajaí-açu. Rev. Bras. Rec. Hid., v. 7, n. 1, p. 123-142, 2002.
SKILLETER, G. A.; PRYOR, A.; MILLER, S.; CAMERON, B. Detecting the efects of physical disturbance on benthic
assemblages in a subtropical estuary: a beyond BACI
approach. J. Exp. Mar. Biol. Ecol., v. 338, n. 2, p. 271-287,
2006.
SOARES-GOMES, A.; MENDES, C. L.T.; TAVARES, M.;
SANTI, L. Taxonomic suiciency of polychaete taxocenes
for estuary monitoring. Ecol. Indic., v. 15, n. 1, p. 149-156, 2012.
SOARES-GOMES, A.; GAMA, B. A. P.; BAPTISTA NETO,
J. A.; FREIRE, D. G.; CORDEIRO, R. C.; MACHADO,
W.; BERNARDES, M. C.; COUTINHO, R.; THOMPSON, F. L.; PEREIRA, R. C. An environmental overview of
Guanabara Bay, Rio de Janeiro. Reg. Stud. Mar. Sci., 2016,
https://www.researchgate.net/publication/292921881_An_ environmental_overview_of_Guanabara_Bay_Rio_de_
Janeiro_Regional_Studies_in_Marine_Science.
SOUZA, F. M.; BRAUKO, K. M.; LANA, P. C.; MUNIZ, P.; CAMARGO, M. G. The efect of urban sewage on benthic
macrofauna: a multiple spatial scale approach. Mar. Pullut. Bull., v. 67, n. 1-2, p. 234-240, 2013.
STRICKNEY, R. R.; PERLMUTER, D. Impact of intracoastal
waterway maintenance dredging on a mud bottom benthos community. Biol. Conserv., v. 7, n. 3, p. 211-225, 1975.
SUGUIO, K. Introdução à sedimentologia. São Paulo: Edgar
Blucher, 1973. 317 p.
THRUSH, S. F.; DAYTON, P. K. Disturbance to marine benthic
habitats by trawling and dredging: Implications for marine biodiversity. Annu. Rev. Ecol. Syst., v. 33, p. 449-473, 2002.
UNDERWOOD, A. J. Importance of experimental design in detecting and measuring stresses in marine populations. J.
Aquat. Ecossyst. Stress Recovery, v. 7, n. 1, p. 3-24, 2000. VAN DER VEN, P. H.; SOARES-GOMES, A.; TAVARES, M.
Taxocene of crustacean at a highly impacted bay: Guanabara
Bay, southeastern Brazil. J. Coast. Res., v. 39, p. 1135-1139,
2006.
VENTURINI, N.; MUNIZ, P.; RODRÍGUEZ, M. Macrobenthic
subtidal communities in relation to sediment pollution: a test of the applicability of the phylum-level meta-analysis approach in a southeastern coastal region of South America. Mar. Biol., v. 144, p. 119-126, 2004.
VIVAN, J. M.; DI DOMENICO, M.; ALMEIDA, T. C. M. Efects
of dredged material disposal on the benthic macrofauna near Itajaí Harbor (Santa Catarina, South Brazil). Ecol. Eng., v. 35, n. 10, p. 1435-1443, 2009.
WARE, S.; BOLAM, S. G.; REES, H. L. Impact and recovery
associated with the deposition of capital dredgings at UK
disposal sites: lessons for future licensing and monitoring. Mar Pollut Bull., v. 60, n. 1, p. 79-90, 2010.
WARWICK, R. M.; CLARKE, K. R. Increased variability as