AGE, GROWTH AND MORTALITY OF DOG SNAPPER
LUTJANUS JOCU
(BLOCH & SCHNEIDER, 1801)
IN THE NORTHEAST COAST OF BRAZIL
Sérgio de Magalhães Rezende 1 & Beatrice Padovani Ferreira 2
1
(Caixa postal 69, 55590-000 Porto de Galinhas, PE, Brazil) [email protected]
2
Universidade Federal de Pernambuco, Departamento de Oceanografia (Av. Arquitetura s/n, Cidade Universitária, 50.740-550, Recife, Pernambuco, PE, Brazil)
A
B S T R A C TThe age and growth of Lutjanus jocu was assessed through readings of growth marks in sagitta otoliths. From August 1996 to March 2000, fish were sampled (n=3.539) in the northeast portion of the Brazilian Exclusive Economic Zone. Sagitta otoliths were extracted from a sub sample of 216 individuals caught around the oceanic bank Sirius (03°59' s; 35°59' w) and over continental shelf from Ceará (05°03's; 36°02'w) to Bahía States (09°01's; 35°12'w). Opaque bands, presumed to be annual, were observed on whole (n= 210) and sectioned (n= 197) otoliths, showing ages from 0 to 20 and from 0 to 25 years respectively. The von Bertalanffy growth model was fit to length-at-age data resulting in the values of L∞= 77.22 cm, K= 0.110 and t0= -3.73. Incremental widths from the first to
twentieth opaque band on sectioned otoliths (n = 39) were used on back calculation of length-at-ages and the estimated values were L∞= 71,20 cm, K= 0.112 e t0= -4.32. Otolith reading from sections is
a reliable technique for aging L. jocu, which presented medium to high longevity and slow growth. Total mortality (Z) estimated by the catch curve was 0.134 corresponding to an annual survival rate of 87.5%. The natural mortality (M) estimated by the Ault et al. (1998) methodology was 0.12 for 25 years of longevity.
R
E S U M OIdade e crescimento do Lutjanus jocu foi determinada através da leitura de marcas de aposição em otólitos sagittae. 216 indivíduos, capturados no entorno da montanha oceânica Sirius e na plataforma continental do Ceará (05°03's; 36°02'w) até a Bahia (09°01's; 35°12'w) tiveram seus otólitos extraídos. Marcas opacas que provavelmente formam-se anualmente foram observadas em otólitos inteiros (n=210) e em otólitos seccionados (n=197) apresentando peixes com idades entre 0 a 20 e 25 anos respectivamente. O modelo de crescimento de Bertalanffy ajustado por métodos não lineares dos mínimos quadrados aos dados de idade e comprimento resultou em valores de L∞= 77,22 cm, K= 0,110 and t0= -3,73. Medidas incrementais da 1ª a 20ª marca opaca em otólitos seccionados (n=39)
foram usadas para retrocalcular os comprimentos e as respectivas idades resultando em valores de L∞= 71,20 cm, K= 0,112 e t0= -4,32. Leitura de otólitos seccionados de L. jocu é uma técnica
confiável para a determinação da idade e crescimento desta espécie, que apresentou longevidade de média a alta com crescimento lento. A taxa de mortalidade total (Z) estimada através da curva de captura foi 0,134 correspondendo a 87,5% de sobrevivência anual. A mortalidade natural (M) calculada pelo método de Ault et al. (1998) foi 0,12 para uma longevidade de 25 anos.
Descriptors: Lutjanidae, Age, Growth, Otolith, Back calculation.
Descritores: Lutjanidae, Idade, Crescimento, Otólito, Retrocálculo.
I
NTRODUCTIONBottom line fishery for demersal fishes was introduced in northeast coast of Brazil during the 1960, with the purpose of diversifying the declining lobster fishery. From this period until the present date, artisanal fleets have exploited snapper (Family
Lutjanidae) aggregations across the continental shelf, slope and on oceanic banks (Fonteles-Filho, 1969; Silva, 1970). Nowadays, species of the genus Lutjanus contribute 12.6% of the bottom line catches of fin fishes in the northeast coast of Brazil.
scale fisheries. Along the northeastern coast the dog snapper is caught in mangroves, coastal reefs, on reef formations scattered over the continental shelf out to the slope break, and in banks and oceanic islands.
Age and growth techniques of tropical reef fishes along the northeast coast of Brazil were improved for a population assessment of Caribbean red snapper, Lutjanus purpureus in the 1960 and 1970 (Lima, 1965; Menezes & Gesteira, 1974). In 80’s some sub-temperate species along the south coast of Brazil had their population parameters assessed as a result improved age and growth studies (Haimovici & Reis, 1984; Krug & Haimovici, 1989). Currently age validation and growth parameters of five species of lutjanids are in process (or evaluated) using the REVIZEE program. Recently several age validation studies validated age using sagitta otoliths readings for species of tropical reef fish, including many lutjanids were performed (Rocha-Olivares & Gómez-Muñoz, 1993; Newman et al., 1996; Rocha-Olivares, 1998; Cappo et al., 2000; Newman et al., 2000 a,b; Burton, 2001; Burton, 2002; Patterson III et al., 2001).
In this study we attempt to 1) determine the age and growth of Lutjanus jocu from otoliths; 2) Back-calculate length-at-age; 3) Estimate von Bertalanffy growth parameters and 4) Estimate natural mortality M and total mortality (Z).
This study will provide the required information for effective management of this important species. Understanding the exploited fish
population behavior in response to a fishery is an essential question for the conservation and management of fishery resources.
M
ATERIALS ANDM
ETHODSFrom October 1996 to December 2000 3539 fishes caught by hook and line demersal fishery, were identified and measured at landings sites along the northeast portion of the Brazilian Exclusive Economic Zone, as a part of the REVIZEE program1. From those otoliths were collected from a sub sample of 215 fishes during sampling at landing sites of boats operating on fishing grounds of Exclusive Economic Zone of the northeast coast of Brazil.
As fish are sold whole, otoliths could be obtained only from a sub sample of 215 fishes.
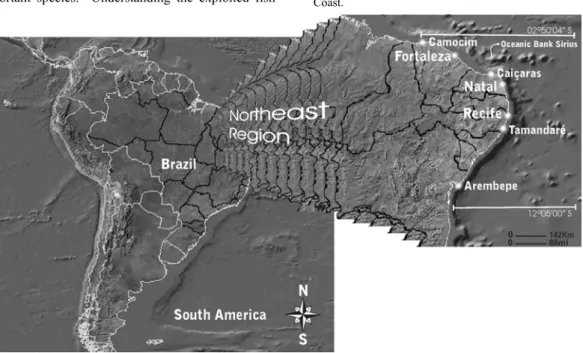
These fishes were caught with line and hook gear in depths from 50-250 m or with traps and bottom nets in depths < 50 m. Primary fishing grounds were the oceanic bank Sirius (03°59's; 35°59'w) and on the continental shelf between Ceará (03°59's; 35°59'w) and Bahía states (09°01's; 35°12'w) (Fig. 1).
___________
(1) REVIZEE Program: Assessment of sustainable yield of fish stocks at Exclusive Economic Zone of the Brazilian Coast.
Trying to attain as large as possible the length range of L. jocu population (Fig. 2), fishes larger than 75.0 cm fork length (FL) were selected at local markets. Individuals smaller than 25 cm FL were selectively caught by spear fishing at coastal coral reef formations at depths from 5-8 m.
Significant differences were not detected between length frequency distributions of the overall sample (n= 3,657) and the subsample of fishes used to aging (n= 216) (df= 2; Komogorov-Smirnov-KS= 2.619; p= 0.540).
Fig. 2. Size distribution of dog snapper for (A) the total sample (n= 3,539) and (B) sample of individuals that had otoliths extracted (n= 216).
A
0 50 100 150 200 250 300 350 400 450 500
0 15 30 45 60 75 90 105 Fork length cm
n=3539
B
0 5 10 15 20 25 30 35 40
0 15 30 45 60 75 90
Sagitta otoliths were extracted through dissection of the otic bulla by exposing the hearing capsules and removing otoliths with tweezers. Otoliths were then cleaned, labeled and stored in plastic tubes.
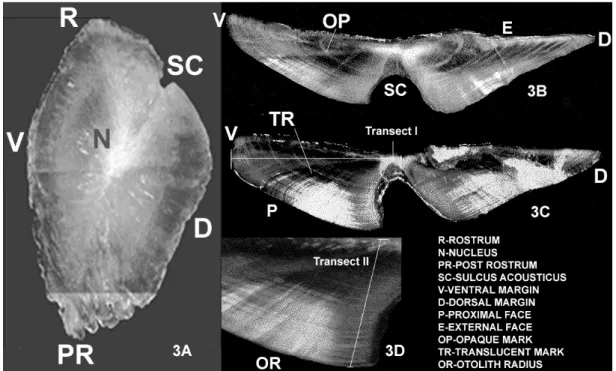
Whole otoliths (n= 210) were examined with a dissecting microscope (5.0x magnification) for the presence of growth bands (Fig. 3A).
Translucent marks were zones of the otolith presenting smaller optic density, whereas opaque marks were structures with larger optical density. Opaque marks along the proximal face were counted to determine the age of dog snapper (Figs 3B, 3C).
Left otoliths (n=197) were embedded in polyester resin and sectioned transversely with a low speed Isomet saw. The prepared samples were mounted on histological slides using Entelan and cover slips.
The opaque marks, and marginal appearance (opaque or translucent) in otoliths sections were observed and counted along a transect running from the nucleus to the proximal margin parallel to the sulcus acousticus edge (Figs 3B, 3C, 3D). When opaque bands in otolith sections of L. jocu are followed around the section towards the ventral or dorsal margins, they have the appearance of multiples ring probably due to a more dispersed deposition
pattern. By contrast, the best region for reading is located towards the sulcus acousticus area, where the growth marks have a more consistent pattern.
The precision of the readings was estimated by the IAPE calculation (Index Average Percent Error) by Beamish & Fournier (1981), with two readers conducting consecutive and independent readings. The first reader analyzed the sets of whole and sectioned otoliths three times, and the second reader two times.
We fitted the length-at-age data to the von Bertalanffy (1938) non-linear growth model (L
(∆t)=L∞*[1-e (-K*(t-t0))], where L∞ is theoretical maximum length, K is the growth coefficient, t0 is the theoretical age at zero length and L (∆t) is the length at age t. The growth curves obtained were compared through covariance analysis of log transformed length-at-age data (back calculated and anulli count data for whole and sectioned otoliths) (Zar, 1984).
In order to determine the most adequate region of the otolith from which to take annulus measurements to be used for the back-calculation method, measurements (µm) were obtained for two independent transects, previously tested in the clearest 39 otolith sections.
Transect I corresponded to the larger distance between the nucleus and the ventral face (Fig. 3C) and transect II to a segment line parallel to the sulcus acusticus from the nucleus to the proximal face (Fig. 3D).
For the two independent transects (I and II), regression coefficients needed for back-calculation procedures were supplied by the relationship between variables involved, namely body length (TL cm) and otolith radius (OR µm) TL= a + b * (OR).
Residual plots of TL (cm) and OR (µm) relationships were used to verify the homogeneity of variances and thus choose the best method (proportional or regression) and also the best equation (linear or curvilinear) for back calculating length-at-age.
An estimate of total mortality (Z) was obtained using the age based catch curve method of Beverton & Holt (1957) and Chapman & Robson (1960). The number of fish in each age class was plotted against their corresponding age and Z was estimated for all fully recruited ages from the descending slope (b) of the regression. From Z, the survival rate S was calculated, according to Ricker (1975).
The model proposed by Ault et al. (1998) consider the longevity as an input for the estimate of natural mortality (M) (M=-ln(Stλ)/tλ). Where tλ is the maximum age registered, Stλ is the survivor rate of a cohort, which reaches this age in a virgin population. In this study, Stλwas estimated by Ault et al. (1998) as 5% that is the survivorship of recruits to the maximum age.
Variables with non-normal distribution were log-transformed and relationships among the several variables were tested. Selective samples were excluded when the performed analysis required random samples. A significant level α= 0.05 was accepted for hypotheses testing (Zar, 1984).
R
ESULTSSagitta otoliths of Lutjanus jocu are robust, angular and with a sharp rostrum. Among the three otolith pairs they are the largest showing a slight conical aspect with a tetragonal form and losing thickness towards the margins. The cavity of the sulcus acousticus is a curved incision, arranged along the longitudinal transect (rostrum-post rostrum) in the proximal face.
Whole and sectioned otoliths, showed an alternated pattern of translucent and opaque bands (Fig. 3). Although we could not validate the periodicity of bands formation, we considered them to be annually formatted.
Whole otoliths, when observed with reflected light under a dissecting microscopy (5.0 x magnification) presented wide opaque marks with a milky appearance and narrow translucent marks with a grayish dark color. The nucleus was evidenced by a dense cloud of aragonite deposition (Fig. 3A). For age 8+ yr, the thickness of the otoliths hampered the observation of the first opaque mark. The border effect was also one of the causes of the weak discernment of opaque marks that tended to overlap when compressed in the border (Fig. 3A).
In otolith sections, the limits of the nucleus and sub-sequent opaque rings presented better contrast making possible the observation and counting of the growth marks. Under reflected light, the opaque marks had an intense milky white appearance, while the translucent marks had a darkened tone (Fig. 3B; 3C; 3D).
Due to double and triple ring effects, difficulty of interpretation of the opaque marks occurred, when the growth marks were followed towards the ventral or dorsal edges (Fig. 3B; 3C).
Along the sulcus acousticus edge, the deposition of the opaque marks was tight, resulting in sharper deposition, which facilitated counting and interpreting the marks (Fig. 3B, 3C, 3D).
Otoliths of L. jocu grew from the nucleus to the proximal margin, where growth rings could be followed continuously. When the otolith reached a certain size, usually after age 10+ yr, the direction of otolith growth changes (Fig. 3C; 3D).
The best accuracy between readings was obtained for sectioned otoliths, IAPE = 7.1%. The reading of whole otoliths presented smaller accuracy (IAPE = 10.68%).
Significant differences were not detected between weights of right and left otoliths pairs (df= 160; paired t-test= 0.493; p= 0.623). The weight of the otoliths increased exponentially with fish size (O wg= 9-05 * FLcm1.98 ; r2= 0.897), and linearly with fish age (O wg= 0.0626 + 0.0239 * Age yr-1; r2=0.72) (Fig. 5). The relationship between otolith weight (OW g) with fork length (FL cm) and age (yr), showed that otolith growth is related to age rather than body size.
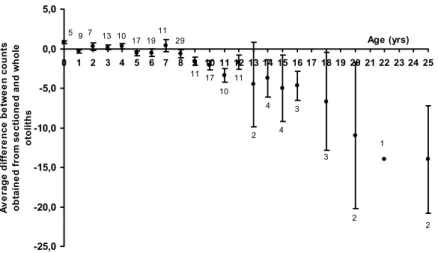
Fig. 4. Average difference between counts obtained from sectioned and whole otoliths of
Lutjanus jocu. Error bars show standard deviations (n=190).
-25,0 -20,0 -15,0 -10,0 -5,0 0,0 5,0
0 1 2 3 4 5 6 7 8 9 10 11 12 13 14 15 16 17 18 19 20 21 22 23 24 25 Age (yrs)
A
v
e
rag
e
d
iff
e
re
n
ce
b
e
twe
e
n
co
u
n
ts
ob
ta
in
e
d
fr
om
s
e
c
ti
o
ne
d a
n
d
w
h
ol
e
otol
it
hs
5
97 13 10 17 19
11 29
11 17
10 11
2 4
4 3
3
2 1
2
OW (g)= 0.0626 + 0.0239 * Age*yrs -1 R 2 = 0.7206 n=198
0 0.1 0.2 0.3 0.4 0.5 0.6 0.7 0.8
0 2 4 6 8 10 12 14 16 18 20 22 24 26 Age yrs-1
OW (g)= 9 -05 *FL (cm) 1.98 R 2 = 0.897 n=356
0 0.1 0.2 0.3 0.4 0.5 0.6 0.7 0.8
0 10 20 30 40 50 60 70 80 90 100 Fork length (cm)
OW (g) OW (g)
A
B
The difference between readings of whole and sectioned otoliths on from ages 1+ to 8 years was low, the growth of the otoliths was in size, consequently growth checks was clearly visible in this period on whole otoliths. From age 8+ years the growth checks in whole otoliths are superimposed due edge effect, being difficult to recognize the checks.
After age 8+ years counts of growth checks in sectioned otoliths was higher then in whole otoliths, and it increase with the age, the growth of the otolith is in thickness being more clear to count growth checks
sections, but caution is needed because the first checks were not clearly recognized.
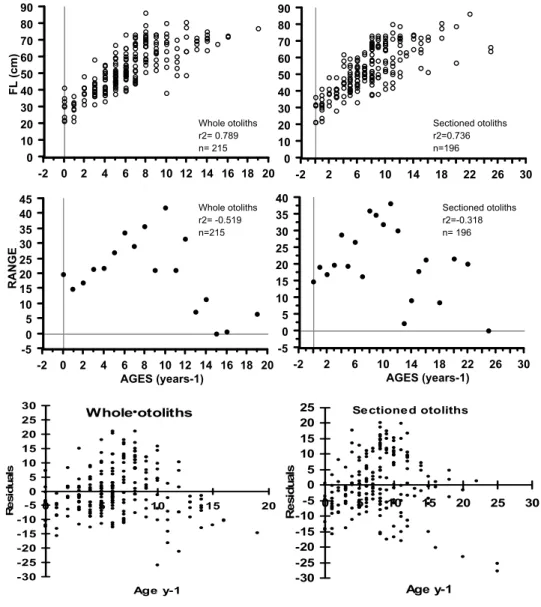
The wide range of lengths at a given age indicated a strong individual variability of growth through age classes (Fig. 6). The scatter plot of fork length and range vs. ages from whole otoliths showed a systematic trend from ages 2 to 8 yr with an increase in range of the corresponding fork lengths (Fig. 6). For length-at-age data from sectioned otoliths no systematic trend in range of fork lengths was observed although a strong variation in length persisted (Fig. 6).
Fig. 6. Distribution of length-at-age data from whole and sectioned otoliths and respective plot of mean and raw residuals.
0 10 20 30 40 50 60 70 80 90 FL (cm)
-2 0 2 4 6 8 10 12 14 16 18 20
-5 0 5 10 15 20 25 30 35 40 45 RANGE
-2 0 2 4 6 8 10 12 14 16 18 20 AGES (years-1) 0 10 20 30 40 50 60 70 80 90
-2 2 6 10 14 18 22 26 30
-5 0 5 10 15 20 25 30 35 40
-2 2 6 10 14 18 22 26 30 AGES (years-1) Whole otoliths r2= 0.789 n= 215 Whole otoliths r2= -0.519 n=215 Sectioned otoliths r2=0.736 n=196 Sectioned otoliths r2=-0.318 n= 196 Whole otoliths -30 -25 -20 -15 -10 -5 0 5 10 15 20 25 30
0 5 10 15 20
Age y-1
R
e
s
idua
ls
Se ctione d otoliths
-30 -25 -20 -15 -10 -5 0 5 10 15 20 25
0 5 10 15 20 25 30
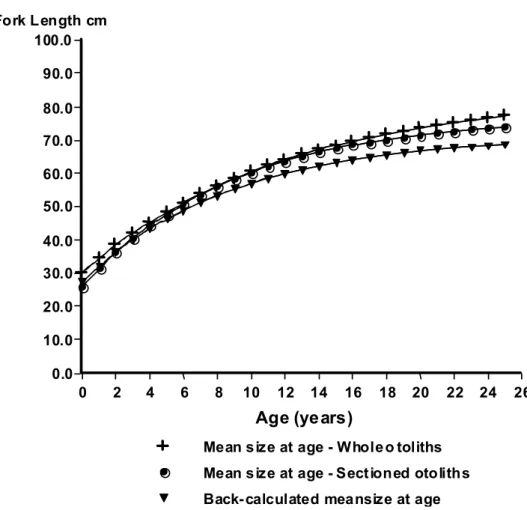
The von Bertalanffy (1938) growth model described growth of dog snapper appropriately (Fig. 7). The estimated values of growth parameters from length-at-age determined from whole otoliths were: L∞= 84.1 cm, K= 0.08, t0= -5.4 n= 210; r2= 0.722 and from length-at-age from otoliths sections were: c 77.22 cm; K = 0.110; t0 = -3.73; n = 197; r2= 0.798 (Table 1). The three growth curves obtained were compared through covariance analysis of log transformed length-at-age data (back calculated and anulli count data for whole and sectioned otoliths) and significant differences were detected among the slopes (b) (F(0.05 (1),2 ,429)= 13.37; p= 3.01) and elevations (a) (F(0.05 (1),2 ,431)= 10.72; p= 3.01) (Table 5).
Table 1.Von Bertalanffy growth parameters estimates of dog snapper.
Fish caught by spear fishing ranged in age from 0 yr + to 2 years and measured between 20 and 25 cm of fork length. Fish caught at depths of 10-50 m were caught with traps or bottom nets and ranged in age from 3+ to 6 years and measured from 30-50cm FL; fish caught at depths of 50-250 m were caught mainly with hook and line and ranged in age from 6+ to 20 years.
Fig. 7. Von Bertalanffy growth curves fitted to mean length-at-age from whole and sectioned otoliths and back-calculated data.
L∞ K t0 r2 n
Whole 84.14 0.08 -5.4 0.722 210
Sectioned 77.22 0.110 -3.73 0.798 197
Back-calculation 71.2 0.112 -4.32 0.95 39
0.0 10.0 20.0 30.0 40.0 50.0 60.0 70.0 80.0 90.0 100.0 Fork L ength cm
0 2 4 6 8 10 12 14 16 18 20 22 24 26
Age (ye ars)
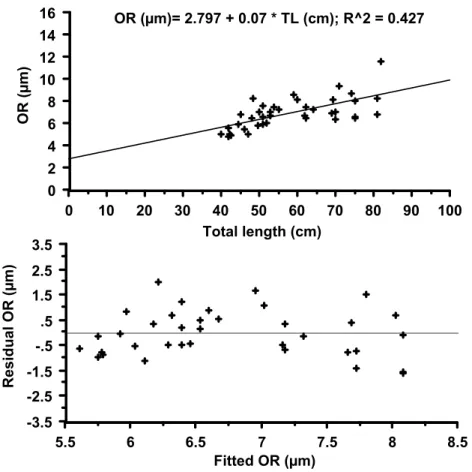
Fig. 8. Linear regression between between TL (cm) and OR radius (µm) and plot of residual
vs. fitted values.
Along transect I, it was possible to measure the radii until the 8th opaque ring. After this age (8+ yr) the axle of otolith growth changed direction and the opaque marks overlapped along the ventral margin making measurement of individual radius impossible (Fig. 3B). The heteroscedasticity of the variances in the TL-OR relationship for transect I indicated that a curvilinear model was more appropriate to the back calculation procedure. The observed data from this transect did not describe the growth curve.
For transect II (Fig. 3D), by contrast, homoscedastic variance was evidenced by a plot of the regression residuals (Fig. 8). The TL-OR regression for this transect was used in the back calculation procedure in spite of the weak correlation between these variables (r2= 0.427; n=39). The intercept of TL-OR regression presented a positive isometry for this transect (a= 2.97) (Fig. 8).
For transect II it was possible to perform measurements until the twentieth radii enabling to
back-calculate linearly the mean lengths (Table 2). The estimated parameters were (L∞= 71.20 cm, K= 0.112 e t0= -4.32 r2= 0.95 n= 39) (Fig. 7; Table 1). The back calculated lengths using transect II measurements were significantly smaller than the observed lengths for 13 of the 20 ages used in the back calculation method (t-paired = -9.81; p< .0001; n=16) (Table 2).
The growth marks widths (translucent and opaque marks) showed a similar trend. The translucent bands were thinner than the opaque bands, varying from 0.013 µm to 0.142 µm while opaque bands varied from 0.100 µm to 0.363 µm. Both translucent and opaque bands decreased progressively in width as the fish reached older ages, until an asymptotic width of 0.1 µm. These results showed that there is a clear trend for both the translucent and opaque bands to reach a constant width of 0.1 µm as the fish reaches ages over 17 years.
0 2 4 6 8 10 12 14 16
OR (µm)
0 10 20 30 40 50 60 70 80 90 100
Total length (cm)
OR (µm)= 2.797 + 0.07 * TL (cm); R^2 = 0.427
-3.5 -2.5 -1.5 -.5 .5 1.5 2.5 3.5
Residual OR (µm)
5.5 6 6.5 7 7.5 8 8.5
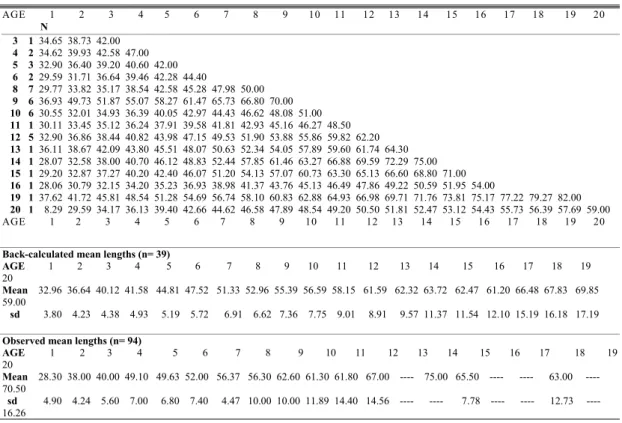
Table 2 : Back-calculated total lengths (cm) of dog snapper aged by sectioned otoliths an observed lengths.
AGE 1 2 3 4 5 6 7 8 9 10 11 12 13 14 15 16 17 18 19 20 N
3 1 34.65 38.73 42.00 4 2 34.62 39.93 42.58 47.00 5 3 32.90 36.40 39.20 40.60 42.00 6 2 29.59 31.71 36.64 39.46 42.28 44.40
8 7 29.77 33.82 35.17 38.54 42.58 45.28 47.98 50.00 9 6 36.93 49.73 51.87 55.07 58.27 61.47 65.73 66.80 70.00 10 6 30.55 32.01 34.93 36.39 40.05 42.97 44.43 46.62 48.08 51.00 11 1 30.11 33.45 35.12 36.24 37.91 39.58 41.81 42.93 45.16 46.27 48.50 12 5 32.90 36.86 38.44 40.82 43.98 47.15 49.53 51.90 53.88 55.86 59.82 62.20 13 1 36.11 38.67 42.09 43.80 45.51 48.07 50.63 52.34 54.05 57.89 59.60 61.74 64.30 14 1 28.07 32.58 38.00 40.70 46.12 48.83 52.44 57.85 61.46 63.27 66.88 69.59 72.29 75.00 15 1 29.20 32.87 37.27 40.20 42.40 46.07 51.20 54.13 57.07 60.73 63.30 65.13 66.60 68.80 71.00 16 1 28.06 30.79 32.15 34.20 35.23 36.93 38.98 41.37 43.76 45.13 46.49 47.86 49.22 50.59 51.95 54.00
19 1 37.62 41.72 45.81 48.54 51.28 54.69 56.74 58.10 60.83 62.88 64.93 66.98 69.71 71.76 73.81 75.17 77.22 79.27 82.00 20 1 8.29 29.59 34.17 36.13 39.40 42.66 44.62 46.58 47.89 48.54 49.20 50.50 51.81 52.47 53.12 54.43 55.73 56.39 57.69 59.00 AGE 1 2 3 4 5 6 7 8 9 10 11 12 13 14 15 16 17 18 19 20
Back-calculated mean lengths (n= 39)
AGE 1 2 3 4 5 6 7 8 9 10 11 12 13 14 15 16 17 18 19 20
Mean 32.96 36.64 40.12 41.58 44.81 47.52 51.33 52.96 55.39 56.59 58.15 61.59 62.32 63.72 62.47 61.20 66.48 67.83 69.85 59.00
sd 3.80 4.23 4.38 4.93 5.19 5.72 6.91 6.62 7.36 7.75 9.01 8.91 9.57 11.37 11.54 12.10 15.19 16.18 17.19
Observed mean lengths (n= 94)
AGE 1 2 3 4 5 6 7 8 9 10 11 12 13 14 15 16 17 18 19 20
Mean 28.30 38.00 40.00 49.10 49.63 52.00 56.37 56.30 62.60 61.30 61.80 67.00 ---- 75.00 65.50 ---- ---- 63.00 ---- 70.50
sd 4.90 4.24 5.60 7.00 6.80 7.40 4.47 10.00 10.00 11.89 14.40 14.56 ---- ---- 7.78 ---- ---- 12.73 ---- 16.26
The age length key generated from the sub-sample (n=81), demonstrated that individuals from ages 6+ years onwards, corresponding to lengths from 40 to 45 cm FL, are under intensive fishing pressure (Table 3). Fish aged 1–5 years the estimate of the total mortality (Z) was 0.13 (r2 = 0.93; n = 81), corresponding to a survival rate of 87.5%. The data input to estimate the natural mortality (M) for L. jocu by the Ault et al. (1998) was the longevity (as the maximum age registered=25 years) and St was estimated by Ault et al. (1998) as 5% that is the survivorship of recruits to the maximum age. The obtained M was 0.12.
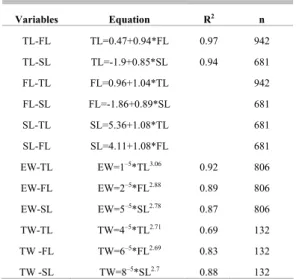
The relationships between lengths (total, fork and standard lengths) and the eviscerated weight (EW) were calculated (Table 4).
D
ISCUSSIONFor Lutjanus jocu, the readings of whole otoliths were less precise (IAPE= 10.68%) than those under sectioned otoliths (IAPE= 7.1%). It was often difficult to distinguish both the first and last rings in individuals presenting more than 10 rings, due to the increase in thickness in the nucleus area and the
overlapping of growth bands closer to the border, respectively, an effect that produced an increase of 3.58% of error between whole and sectioned otoliths readings.
On sectioned otoliths, the main reading difficulty was the enlargement of individual rings in some areas with faster growth, which assumed the appearance of multiple rings, as well as the border effect opaque rings compacting on the margins.
Since L. jocu otoliths growth is allometric, the same opaque mark when followed across the sectioned otolith has a variable width depending of its position in relation to the proximal margin. In addition, opaque bands may present bipartite aspect in areas with fastest deposition. These observations are evidences of differentiated growth rates in areas of the same otolith section.
Table 3. Age-length key for L. jocu.
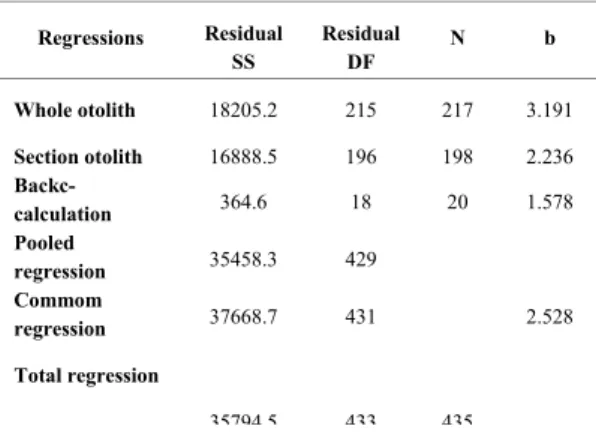
Table 4. Covariance analysis of log transformed length-at-age data (back calculated and anulli count data for whole and sectioned otoliths).
In a general way, the validity of the back calculation method depends on the accuracy of the age determinations and the selection of valid body size-otolith size relationship (Rijnsdorp et al., 1990). Another good tool in the selection of the appropriated
back calculation model (linear, curvilinear or other mathematical function) to describe body size and otolith size relationship is the verification of variances homogeneity through the plot of residuals vs. fitted data (Francis, 1990).
Back calculation methods employed here was used as strategy to obtain specific age-at-length data for initial ages thus reaching, as large as possible, the range of age-at-length data for a fish population. The back calculation procedure employed here was also a simple technique to estimate growth parameters from the same otolith sample set by a curve generated from a calculated proportion between fish size (FL cm) and incremental measurements (OR µm) just to compare numerically the growth estimates and show that otoliths sections data provided reliable growth estimates of L. jocu population.
Problems such as decoupling of otolith growth and somatic growth or exclusion of some age or length classes caused by sampling selectivity due to gear are unquestionable sources of error to the back calculation. But above all, the wrong choice of the measurement incremental growth transect is the main aspect that bring strong sources of errors when the
Fl (cm) N Ages
0 - 5 1 2 3 4 5 6 7 8 9 10 11 12 13 14 15 16 20 22 25
5 - 10
10 - 15
15 - 20
20 - 25
25 - 30
30 - 35
35 - 40 4 1 3
40 - 45 8 1 1 4 2
45 - 50 22 1 2 2 3 2 7 2 1 1 1
50 - 55 17 2 4 3 2 2 1 1 1 1
55 - 60 13 2 3 3 1 1 1 1 1
60 - 65 6 1 1 1 1 1 1
65 - 70 5 1 2 1 1
70 - 75 5 1 2 1 1
75 - 80 1 1
80 - 85
85 - 90 1 1
90 - 95
95 - 100
Total 81 1 5 4 6 9 9 14 8 7 4 6 1 1 2 1 1 1 1
Regressions Residual SS
Residual DF
N b
Whole otolith 18205.2 215 217 3.191
Section otolith 16888.5 196 198 2.236
Backc-calculation 364.6 18 20 1.578
Pooled
regression 35458.3 429
Commom
regression 37668.7 431 2.528
Total regression
back calculation lengths methods are carried out (Hare & Cowen, 1995; Murdoch & Doherty, 1997; Sadovy et al., 1992; Smale & Taylor 1987; Smedstad & Holm 1996).
Table 5. Regressions among variables (TLcm, FLcm, SLcm, EWg and TWg).
In this study two sources of errors using the back calculation method along transect I were noticed. The first one relates to measurements taken in a region between the nucleus and the ventral margin where there is faster growth that results in the presence of multiple rings makes difficult to determine the exact limits of each radii.
The second one, at ages 8+ yr and more, as the otolith starts to grow more in thickness than in length, a shift in the direction of the main deposition axis causes overlapping of opaque bands along the ventral margin.
However along transect II, it was possible to measure the radii until the twentieth ring. Although the measuring transect was not orthogonal to all bands, a constant angle in the whole course and the consistent deposition pattern of the growth marks near to the sulcus acousticus makes this region the best portion of the otolith to run a transect measurement.
The back calculated mean lengths from transect I were significantly larger than that obtained using transect II, which were significantly smaller than the observed mean lengths. Beyond age 17+ yr, both translucent and opaque bands measured around 0.1µm.
Although growth curves presented differences in slopes and elevations, growth parameters estimated for L. jocu, using length at age and back calculated length-at-age data, were in agreement with the K values estimated for (other species of the) many genera Lutjanus (Manooch III,
1987). Growth parameters of dog snapper from northeast coast of Brazil estimated from observed length-at-age and back calculated data (L∞= 84.1 cm, K= 0.08=2 t0= -5.4; L∞= 77.22 cm, K= 0.110 t0= -3.73 and L∞= 71.20 cm, K= 0.112 e t0= -4.32 respectively) were quite similar to that value estimated from this specie from Cuban waters (L∞= 85.4; K= 0.100; t0= -2.0) (Valle et al., 1997).
Although age validation for Lutjanus jocu through marginal increments or margin types was not possible due to lack of samples around the year, an annual growth pattern was based in a age and growth review of lutjanids (Cappo et al., 2000; Manooch III, 1987) and many other’s works that involved age and growth of lutjanids (Rocha-Olivares & Gómez-Muñoz, 1993; Newman et al., 1996; Rocha-Olivares, 1998; Cappo et al., 2000; Newman et al., 2000 a,b; Burton, 2001; Patterson III et al., 2001; Burton, 2002).
The calculated total mortality Z = 0.138 was particularly similar to the values found for the same species in Cuban waters (Valle et al., 1997). However, it probably reflects only the total mortality in the Sirius sea-mountain area, where there is a tendency to target larger individuals.
The age-length key generated from the sub-sample (n = 81), demonstrated that individuals from ages 6+ yrs onwards, corresponding to lengths from 40 to 45 cm, are under intense fishing pressure (Table 3). Fish aged 1-5 years, which are not fully recruited by the fishery, were excluded from the analysis (Fig. 9).
Fig. 9. Catch curve for L. jocu.
Variables Equation R2 n
TL-FL TL=0.47+0.94*FL 0.97 942
TL-SL TL=-1.9+0.85*SL 0.94 681
FL-TL FL=0.96+1.04*TL 942
FL-SL FL=-1.86+0.89*SL 681
SL-TL SL=5.36+1.08*TL 681
SL-FL SL=4.11+1.08*FL 681
EW-TL EW=1–5
*TL3.06
0.92 806
EW-FL EW=2–5
*FL2.88
0.89 806
EW-SL EW=5–5
*SL2.78
0.87 806
TW-TL TW=4–5
*TL2.71
0.69 132
TW -FL TW=6–5*FL2.69 0.83 132
TW -SL TW=8–5*SL2.7 0.88 132
ln Catch ∆t = -0.1342*Age yr-1 + 3.2442 R2 = 0.9259 n=81
0,0 0,5 1,0 1,5 2,0 2,5 3,0 3,5 4,0
0 2 4 6 8 10 12 14 16 18 20 22 24 26 Age (yr-1)
ln
C
a
tc
h
∆
A number of traditional empirical models estimate the natural mortality (M) considering the water temperature and growth parameters or the age at first maturity (Rikter & Evanoff, 1976; Pauly, 1980). Recently Ault et al. (1998) developed a methodology, which allows application of a convenient and consistent method to normalize the annual instantaneous natural mortality rate M to life span. For Lutjanids species, M reported in literature varies from 0.104 to 0.49 (Newman et al., 1996; Newman et al., 2000; Burton 2001; Burton 2002; Newman, 2002; Newman & Dunk, 2002 ) . However, most of the estimates for Lutjanus species rely up to the value of 0.23.
For L. jocu estimated M was 0.12 for 25 years of longevity. The Ault et al. (1998) method to estimate natural mortality (M) was considered in this work more reliable in according to reef fishes life span than models that consider temperature. Models as proposed by Pauly (1980) is more adequate to species that have life cycles more linked to oceanographic conditions.
A fishery usually tends to select a limited range a length classes in a population, removing larger, fast growing individuals (Favro & Kuo, 1979; Mulligan & Leaman, 1992; Parma & Deriso, 1990). If this is the case for dog snapper, besides the individual variability of lengths at any given age, the use of the length-at-age data from readings of whole otholits, can accentuate even more the effect of the size selective mortality leading to erroneous estimations of the mean length of a certain age. Failing to consider effects of individual variability in growth can lead to a drastic overestimation of the effects of heavy fishing pressure. (Ferreira & Russ, 1994).
Cases of lutjanids overfishing have been described for different fishing grounds in the world where this family is the target of the fishery (Bannerot et al., 1987). In Brazil the bottom line fishery used to catch demersal fishes was officially introduced during the 60’s, with the purpose of diversifying the lobster fishery already in decline. From this period until the present date artisanal fleets have exploited lutjanid aggregations in the northeast Brazilian coast (Fonteles-Filho, 1969; Ivo & Hanson 1982; Silva, 1970, Rezende et al., 2003).
Nowadays (2001), in a multi-species fishery scenario showing 57 fishery categories involving more than 40 fishes species, the total catches in three states (Ceará, Rio Grande do Norte and Pernambuco) of northeast coast of Brazil1 was 33054,7 tons. Species of the genus Lutjanus contribute 12.51 % (4136,8 tons), and dog snapper contribute 2.93% (121,2 tons) of the lutjanidae catches in these three states.indicating to be an important resource with wide distribution in Brazilian tropical waters.
L. jocu reaches, asymptotic length slowly and high longevities such many demersal fishes from tropical regions, which are at higher trophic levels (Buesa 1987; Manooch III, 1987; Pozo & Espinoza, 1982) and in addition to these characteristics, this specie is strongly site attached to reef areas, and thus can be seriously affected by overfishing, if high indexes of fishing effort are used by long periods (Newman et al., 1996; Newman et al., 2000a,b; Burton, 2001; Burton, 2002).
Otoliths of L. jocu, as observed in the present work, fulfill two important criteria to be considered an adequate tool for age determination (Fowler & Doherty, 1992): growth throughout the life span and presence of increments structures with a regular formation although assumed but not proved (Manooch III 1987; Cappo et al., 2000). The growth parameters estimates obtained here can be used for fishery regulations purposes.
A
CKNOWLEDGMENTSWe thank the REVIZEE Program, from the Brazilian Ministry of Environment, the Brazilian National Research Council (CNPq) and the Northeastern Fisheries and Research Center (CEPENE) for logistic support throughout this work.
R
EFERENCESBannerot, S. P.; Fox, W. W. & Powers, J. E. 1987. Reproductive strategies and management of snappers and groupers in the Gulf of Mexico and Caribbean. In: Polovina J. J. & Ralston, S. eds. Tropical snappers and groupers: biology and fisheries management. Westview Press, Oceans Resources and Marine Policy Series. p.561-604 p.
Beamish, R. J. & Fournier D. A. 1981. A method for comparing the precision of a set of age determinations. Can. J. Fish. aquat. Sci., 38:982-983.
Beverton, J. H. & Holt S. J. 1957. On the dynamics of exploited fish populations. Fish. Invest. Minis. Agric. Fish. Food (GB) (2 Sea Fish). 19:533p.
Buesa, R. J. 1987. Growth rate of tropical demersal fishes. Mar. Ecol. Prog. Ser., 36:191-199.
Burton, M. L. 2001. Age, growth and mortality of gray snapper, Lutjanus griseus, from east coast of Florida. Fish. Bull., 99:254-265.
Burton, M. L. 2002. Age, growth and mortality of mutton snapper, Lutjanus analis, from east coast of Florida, with a brief discussion of management implications. Fish. Res., 59 (2002) 31-34.
Cappo, M.; Eden P.; Newman S. J. & Robertson, S. 2000. A new approach to validation of periodicity and timming of opaque zone formation in the otoliths of eleven species of Lutjanus from Central Great Barrier Reef. Fish. Bull. 98:474-488.
ESTATPESCA - Boletim Estatístico da Pesca Marítima e Estuarina do Nordeste do Brasil. 2001. Tamandaré, IBAMA-MMA. 21p.
Favro, L. D. & Kuo, K. P. 1979. Population genetic study of the effects of selective fishing on the growth rate of trout. J. Fish. Res. Bd. Can., 36:552-561.
Ferreira, B. P. & Russ, G. R. 1994. Age validation and estimation of growth rate of the coral trout Plectropomus leopardus (Lacepede, 1802) from Lizard Island, Northern Great Barrier Reef. Fish. Bull. 92:46-47. Fonteles-Filho, A. A. 1969. Estudo preliminar da pesca do
pargo, Lutjanus purpureus, Poey, no nordeste brasileiro. Arq. Ciên. Mar, Fortaleza, 9(1):83-88.
Fowler, A. J. & Doherty, P. J. 1992. Validation of annual growth increments in otoliths of two species of damself from southern Great Barrier Reef. Aust. J. mar. Freshwat Res., 43:1057-1068.
Francis, R. I. C. C. 1990. Back-calculation of fish length: a critical review. J. Fish. Biol., 36, 883-902.
Haimovici, M.; Reis E. G. 1989. Determinação da idade e crescimento da castanha Umbrina canosai, (PISCES, SCIENIDAE) do sul do Brasil. Atlântica, Rio Grande, 7: 25-46.
Harej, A. & Cowen R. K. 1995. Effect of age, growth rate, and ontogeny on the otholit size-fish size relationship in bluefish, Pomatopomus saltatrix, and implications for back-calculation of size in fish early life history stages. Can. J. Fish. aquat. Sci., 52:1909-1922.
Hischcorn, G. & Small, G. J. 1987. Variability in growth parameter estimates from scales of pacific cod based on scale area measurements. In: Summerfelt, R. C. & Hall G. E. eds. Age and growth of fish. Ames. Iwoa State University Press. p. 147-158.
Ivo, C. T. C. & Hanson A. J. 1982. Aspectos da biologia e dinâmica populacional do pargo, Lutjanus purpureus Poey, no norte e nordeste brasileiros. Arq. Ciên. Mar., 22(1/2):1-14.
Krug, L. C. & Haimovici, M. 1989. Idade e crescimento da enchova, Pomatopomus saltatrix do sul do Brasil. Atlântica, Rio Grande, 11(1):47-61.
Manooch III, C. S. 1987. Age and growth of the snappers and groupers. In: Polovina J. J. & Ralston, S. eds. Tropical snappers and groupers: biology and fisheries management. London, Westview Press. p. 329-374. Mulligam, T. J. & Leaman, B. M.1992. Length-at-age
analysis. Can you get what you see? Can. J. Fish. aquat. Sci., 49:632-643.
Murdock, J. M. & Doherty, P. J. 1997. Caution is required in back-calculating larval growth rates from pre-settlement reef fish collected with light-Traps. In: Lessios, H. A. & Macinyre, I.G. eds. Proc. 8th Intl. Coral Reef Symp.,
2:1149-1154.
Neilson, J. D. 1992. Sources of error in otolith microstructure examination. In: Stevenson D. K. & Campana, S. E. eds. Otolith microstructure examinationa and analysis. Can. Spec. Publ. Fish. aquat. Sci., 117:115-126.
Newmam, S.; Cappo, M. & Williams, D. McB. 2000. Age, growth, mortality rates and corresponding yield estimates using counts of annuli in whole and sectioned otoliths of the tropical snappers Lutjanus erythropterus, L. malabaricus and L. sebae from Central Great Barrier Reef. Fish. Res., 48(2000):1-4.
Newman, S.; Cappo, M. & Williams, D. McB. 2000. Age and growth of the stripey, Lutjanus carponotatus
(Richardson) and the brown-stripe snapper, L. vitta
(Quoy and Gaimard) from Central Great Barrier Reef, Australia. Fish. Res., 48(2000):263-275.
Newman, S.; Williams, D. McB. & Russ G. 1996. Age validation, growth and mortality rates of the tropical snappers (Pisces: Lutjanidae) Lutjanus adetii (Castelnau, 1873) and L. quiquelineatus (Bloch 1790) from the Central Great Barrier Reef, Australia. Mar. Freshwat. Res., 47:575-584.
Parma, A. M. & Deriso, R. B. 1990. Dynamics of age and size composition in a population subject to size-seletive mortality: effects of phenotypic variability in growth. Can. J. Fish. aquat. Sci., 47:274-289.
Patterson III, W. F.; Cowan Jr., J. H.; Wilson C. A. & Shipp, R. L. 2001. Age and growth of red snapper, Lutjanus campechanus, from an artificial reef area off Alabama in the northern Gulf of Mexico. Fish. Bull., 99:617-627. Pozo, E. & Espinoza L. 1982. Estudio de la edad y
crescimiento del pargo alto (Lutjanus vivanus) na plataforma suroriental de Cuba. Rev. Cub. Invst. Pesq., 7(2):1-23.
Ralston, S. & Williams H. A. 1988. Numerical integration of daily growth increments: An efficient means of aging tropical fishes for stock assessement. Fish. Bull. U.S., 87:1-16.
Ricker, W. E. 1975. Computation and interpretation of biological statistics of fish populations. Bull. Fish. Res. Bd. Can., 191-382.
Rijnsdorp, A. D. & van Leween P. I., VISSER. 1990. On the validity and precision of back-calculation of growth from otoliths of the plaice, Pleuronectes platessa L. Fish Res., 9(1990):97-117.
Rocha-Olivares, A. 1998. Age, growth, mortality, and population characteristics of the pacific red snapper,
Lutjanus peru, off the southeast coast of Baja California, Mexico. Fish. Bull., 96:562-574.
Rocha-Olivares, A. & Gómez-Muñoz, V. M. 1993. Validacion del uso de otolitos para determinar la edad del huachinango del pacifico Lutjanus peru
(Perciforme:Lutjanidae), en la bahia de La Paz y aguas adjacentes, B. C. S., Mexico. Ciênc. Mar., 19(3):321-331.
Sadovy, Y. J.; Figuerola, M. & Román, A. 1992. Age and growth of red hind Epinephelus guttatus in Puerto Rico and St. Thomas. Fish. Bull., 90:516-528.
Sainsbury, K. J. 1980. Effect of individual variability on the von Bertalanffy growth equation. Can. J. Fish. aquat. Sci., 37:241-247.
Silva, O. C. 1970. Estudos das pescarias dos botes à vela da praia do Pina (Recife, Brasil). Trab. Oceangr. UFPE, 9111:305- 316.
Smale, M. A. & Taylor W. W.1987. Sources of back-calculation error in estimating growth of lake witefish. In: Summerfelt, R. C. & Hall G. E. eds. Age and growth of fish. Ames, Iwoa State University Press. 189-202. Smedstad, O. M. & Holm, J. C.1996. Validation of
back-calculation formulae for cod otoliths. J. Fish. Biol., 49:973-985.
Valle, S. V.; Garcia-Artega J. P. & Claro R. 1997. Growth parameters of marine fishes in Cuban waters. Naga ICLARM Q., 20(1):34-37.
von BERTALANFFY, L. 1938. A quantitative theory of organic growth (Inquirities of growth law II). Human Biol., 10(2):181-213.
ZAR, J. H. 1984. Biostatistical analisys. 2nd version. New
Jersey, Prentice Hall International, Inc. 718p.