Brazilian Journal of Physics, vol. 29, no. 4, December, 1999 723
Temperature Dependence of the
Absorption Coecient in Doped Quantum Wells
M.R. Baldan
y, R.M. Serra
z, P.D. Emmel
z, and A. Ferreira da Silva
INPEy
- LAS, 12.201-970 - S~ao Jose dos Campos, SP, Brazil UFSCarz
- Depart. de Fisica, 13565-905 - S~ao Carlos, SP, Brazil USFy- Faculdade de Engenharia, 13251-900 - Itatiba, SP, Brazil
Received February 8, 1999
In this work we present a calculation of the infrared optical absorption coecient for a Ga1,xAlxAs
quantum well (QW) as a function of donor impurity concentration, compensation and temperature. We treat this problem using a Self-Consistent Method (SC) calculation taking into account donors as major impurities. The Variational Method was used to obtain the ground state wave-function of an electron bound to a donor impurity in a QW. The results show a shift of energy in the absorption coecient.
I Introduction
Many applications in opto-electronic devices are due to optical properties of quasi-two-dimensional systems. In particular the GaAlAs-GaAs quantum well is a popular system to study these properties. This kind of system is generated by several techniques by growing a layer of GaAs between two layers of GaAlAs.
The infrared absorption coecient for a doped quantum well has been calculated by several authors[1],[10]. Recently Serra et al. [11]calculated
thermal properties of a lightly doped and compensated QW showing the Shottky anomaly in the specic heat. In this work we present the calculation of the opti-cal absorption coecient (OAC) for this kind of QW and we show its dependence on temperature and com-pensation. One important result is the presence of a threshold in the absorption energy.
II The Model
We consider a lightly doped compensated QW. The compensation is dened by k = NA=ND, where NAand
ND are the acceptor and donor densities respectively.
Once there is a low concentration of dopants, donor impurities are far away from each other and we ne-glect the superposition of the electron wave-functions, so the unique kind of interaction present in our model is the electrostatic interaction between ionized impurities.
With this assumption the transitions are of intra-site type, in other words transitions between energy levels belong to the same impurity. At suciently low tem-perature all acceptors and an equal number of donors are ionized. The energy of the system depends on the distribution of neutral (D0) and ionized (D+) donors
and ionized acceptors (A,):
The electrostatic potential acts on the electron en-ergy as a weak perturbation. As the temperature in-creases the tendency of electrons is to move from center to periphery of the QW, modifying the impurity con-guration and increasing the energy of the system.[11] The calculation was made using the self consistent method to determine the thermal properties of the sys-tem. From the initial charge density[10] the
electro-static potential (z) is obtained via Poisson's equation. Once calculated the density of states, the chemical po-tential is obtained with the assumption of neutrality and the density of states is recalculated. The process continues until the convergence of the chemical poten-tial is achieved.
The Hamiltonian of an electron bound to a shallow donor, placed inside a QW is given by[5]
H(zk) = ,
h 2
2m r
2 ,
e2
Ku + V (z) (1) where m is the eective mass of the electron, K the
eective dielectric constant of the QW, e the electronic charge and u =p
x2+ y2+ (z ,z
k)
be-724 M.R.Baldanet al.
tween the electron and the donor sited at (0;0;zk).
V (z) is the conning potential described, in the model of innite barriers, as:
V (z) =
0 if jzj< L21 if jzj> L2
(2) where L is the width of the QW. The eective units used are:
a = h 2
K
me2 (3)
the eective Bohr radius (in GaAs 1a
100A) and
Ry= m e4
2h2K
2 (4)
the eective rydberg (in GaAs 1Ry
5:8meV ).
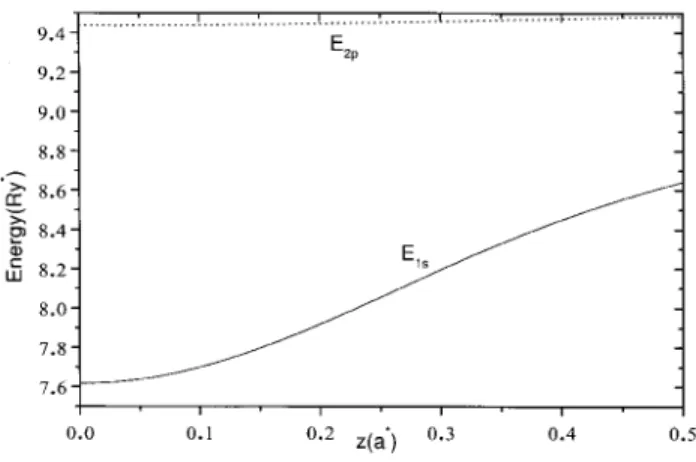
The 1s and 2p states are calculated using a standard variational method[9][5]. The variational wave
func-tions are given by:
1s= A1scos(zL)e ,K
1su (5)
2p= A2pcos(zL)e ie,K
2pu (6)
where A1s;A2pand K1s;K2pare the
normalizationcon-stant and variational parameter to be determined. In Figure 1 we show the dependence of the energies of the-ses states on the impurity position.
Figure1.Energies ofthestates1sand2p.
The time average dissipation rate of electromagnetic energy is given by
P = 1 hE
2
iV (7)
where 1is the real part of the material optical
conduc-tivity, the symbolh:::iis the time average of a physical
quantity, E is the radiation electric eld, and V is the volume of a single impurity.
From the Fermi golden rule we obtain the transition rate (W) per unit of time between the impurity energy levels. Taking h! as the photon energy absorbed by a donor impurity we can write:
P = Wh! (8)
so the absorption coecient related to k-th neutral donor impurity, located at zk position is given by:
h!W (zk;!) = 1(zk;!) hE
2
iV (9)
In the long wave approximation we have:
c
1(zk;!) = e 2!
V
u:hnjrjmiz k
2
(Enm(zk),h!) (10)
d
wherehnjrjmiz
k is the matrix element of the operator r, taken between the states n and m of the k-th bound
electron, anduis the polarization of the absorbed
pho-ton with frequency !, and wave vectork;perpendicular
to the barriers.
The absorption coeciente for the system is
ob-tained summing up the contributions of all neutral donors. Taking an uniform prole of donor impuri-ties, making use of Fermi-Dirac distribution function (fFD(E1s;T)) and considering transitions between 1s
Brazilian Journal of Physics, vol. 29, no. 4, December, 1999 725
c
1(!;T) = NDe 2!f
FD(E1s(z0);T)
u:h1sjrj2pi z0
2
DJ(!) (11)
d
where z0is the donor position in which the
transi-tion takes place, DJ is the joint density of states and
ND= 1=V
III Results
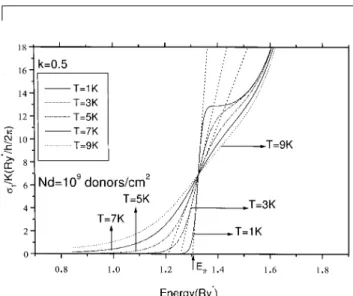
We have performed the calculations with L = 100A,
ND = 10
9donor=cm2 for dierent compensations and
temperatures. Figure 2 shows the dierence in energy between 1s and 2p states. In the limit of low temper-atures almost all neutral donors will be located at the middle of the QW so that only high energy photons will be absorbed. As temperature increases electrons ow from the center of the QW to its periphery in order to increase the energy of the system. As a consequence there will be an increase in the number of the neutral donors at the periphery of the QW so that the thresh-old energy(Eth), the minimal energy for the occurrence
of the transition, turns down. In this work we consider the threshold energy as the intersection of the tangent line at the inection point of the curve 1
E with the
energy axis.
Figure 2. Energy dierence between E 2p
,E
1s of the an
electron bound to a donor located atzpostition in a QW.
Figure 3. The eect of the temperature on the absorption coecient for k=0.5.
Figure 4. The eect of the compensation on the absorption coecient, with L=100Aand temperature of T=1K.
726 M.R.Baldanet al.
QW so to minimize the energy of the system. As the compensation decreases the number of neutral donors increases, the regions far from the center of the QW become populated by neutral donors and the thresh-old energy is shifted down. The shape, in gure 4, is very similar to that one calculated by Emmel et al at
T =O K [6]
Another important eect is the enhancement of the absorption coecient due to the increasing of the donor density. Equation 11 shows that the coecient of ab-sorption is proportional toN
D
:Our treatment is limited
to low donor density since we consider isolate impuri-ties. Although experimental results for the dependence of absorption coecient on temperature and compensa-tion are not yet available we believe that the absorpcompensa-tion threshold energy could be further used to diagnose this kind of doped QW.
References
[1] E. Glaser, B.V. Shanabrook, R.L. Hawkins and
W.Beard, Phya. Rev. B36,8185 (1987).
[2] E. Glaser, W.J. Moore, B.V. Shanabrook, R.L. Hawkins, R.J. Wagner and D. Musser, J. of Phys.48,
239 (1987).
[3] B.V.J. Shanabrook, Physica B146, 121 (1987).
[4] L.E. de Oliveira and G.D. Mahan, Phys. Rev. B 47,
2406 (1993)
[5] P.D. Emmel and I.C. da Cunha Lima, Solid State Com-mun.89, 725 (1994).
[6] P.D. Emmel and I.C. da Cunha Lima, Solid State Com-mun.79, 431 (1991).
[7] G.N. Carneiro, G. Weber and L.E. de Oliveira, Semi-cond. Sci. Technol. 10,41 (1995).
[8] A. Ferreira da Silva, I.C. da Cunha Lima, P.D. Emmel, Superlattices and Micros. 16, 335 (1994).
[9] G. Bastard, Phys. Rev. B24, 4714 (1981).
[10] B.C.F. Colchesqui, P.D. Emmel, E.A. de Andrada e Silva and I.C. da Cunha Lima. Phy. Rev. B 40, 18,
12513 (1989).