Prevalence of overweight and associated factors in adolescents from
public schools of Piracicaba city, São Paulo, Brazil
Prevalência de excesso de peso e seus fatores associados em adolescentes da rede de ensino público de Piracicaba, São Paulo
Prevalencia de exceso de peso y sus factores asociados en adolescentes de la red de enseñanza pública de Piracicaba, São Paulo (Brasil)
Stela Verzinhasse Peres1, Maria do Rosário D. O. Latorre2, Betzabeth Slater3, Luana Fiengo Tanaka4, Marina Vieira da Silva5
Instituição: Faculdade de Saúde Pública da Universidade de São Paulo (USP), São Paulo, SP, Brasil
1Doutora em Saúde Pública pelo Departamento de Epidemiologia da Faculdade de Saúde Pública da USP; Analista epidemiológico do Instituto Israelita de Responsabilidade Social da Sociedade Beneficente Israelita Brasileira Hospital Albert Einstein, São Paulo, SP, Brasil
2Doutora em Saúde Pública pelo Departamento de Epidemiologia da Facul-dade de Saúde Pública da USP; Professora Titular do Departamento de Epi-demiologia da Faculdade de Saúde Pública da USP, São Paulo, SP, Brasil 3Doutora em Saúde Pública pelo Departamento de Nutrição da Faculdade de Saúde Pública da USP; Professora Doutora do Departamento de Nutrição da Faculdade de Saúde Pública da USP, São Paulo, SP, Brasil
4Bacharel em Nutrição pela USP, São Paulo, SP, Brasil
5Doutora em Saúde Pública pelo Departamento de Nutrição da Faculdade de Saúde Pública da USP; Professora Doutora do Departamento de Agroin-dústria, Alimentos e Nutrição da Escola Superior de Agricultura Luiz de ABSTRACT
Objective: Toestimate the prevalence of excess weight and the factors associated with its occurrence in adolescents enrolled at public schools in Piracicaba, SP, Brazil.
Methods: This was a cross-sectional study of 269 adolescents of both sexes aged 10 to 14 years. Questionnaires were administered to collect data on dietary intake, sexual maturity, physical activity level and demographic characteristics. Univariate and multivariate logistic regression were used for statistical analysis.
Results: The prevalence of excess weight was 35.7% for the boys and 26.2% for the girls. Factors signiicantly asso-ciated with excess weight were only identiied for the girls, among whom it was found that being in the 2nd tertile for carbohydrate intake (adjusted Odds Ratio [OR]: 0.28) and the accelerating/peak growth phase (adjusted OR: 0.37) were protective factors against excess weight .
Conclusions: The indings of this study reveal a worrying prevalence of excess weight among the adolescents studied. The accelerating/peak growth phase and high carbohydrate intake were identiied as protective factors against excess weight for the girls. It is, however, suggested that the second of these be treated with caution since this link has not been detected in other studies.
Key-words: nutritional status; adolescent; regression analysis.
RESUMO
Objetivo: Estimar a prevalência de excesso de peso e os fatores associados à sua ocorrência em adolescentes da rede de ensino público da cidade de Piracicaba, São Paulo.
Métodos: Estudo transversal de 269 adolescentes de ambos os sexos, com idades entre dez a 14 anos. Foram aplicados questionários para obtenção do consumo alimentar, maturação sexual, nível de atividade física e características demográicas. Para a análise estatística utilizou-se a regressão logística univariada e múltipla.
Resultados: A prevalência de excesso de peso foi de 35,7% entre os meninos e 26,2%, entre as meninas. Os fatores associados foram observados somente entre as me-ninas, mostrando-se protetor ao excesso de peso o 2º tercil de consumo de carboidrato (OR ajustada 0,28) e a fase de aceleração/pico do crescimento (OR ajustada 0,37).
Conclusões: A prevalência de excesso de peso nos adoles-centes é preocupante. A fase de aceleração/pico do crescimento e o alto consumo de carboidrato foram relacionados como fato-res protetofato-res para o excesso de peso entre as meninas.
Sugere-Endereço para correspondência: Stela Verzinhasse Peres Av. Dr. Arnaldo, 715 – 1º andar CEP 01246-904 – São Paulo/SP E-mail: [email protected]
Fonte financiadora: Fundação de Amparo à Pesquisa do Estado de São Paulo (FAPESP), protocolo nº 05/57417-4
Conflito de interesse: nada a declarar
se ainda que este último fator seja analisado com cautela, dado que tal associação não foi observada em outros estudos.
Palavras-chave: estado nutricional; adolescente; análise de regressão.
RESUMEN
Objetivo: Estimar la prevalencia de exceso de peso y los factores asociados a su ocurrencia en adolescentes de la red de en-señanza pública de la ciudad de Piracicaba, São Paulo (Brasil). Métodos: Estudio transversal de 269 adolescentes de ambos sexos, con edades entre 10 y 14 años. Se aplicaron cues-tionarios para obtención del consumo alimentar, maturación sexual, nivel de actividad física y características demográicas. Para el análisis estadístico, se utilizó la regresión logística univariada y múltiple.
Resultados: La prevalencia de exceso de peso fue de 35,7% entre los muchachos y de 26,2% entre las muchachas. Los factores asociados fueron observados solamente entre las muchachas, mostrándose protector al exceso de peso el 2º ter-cil de consumo de carbohidrato (OR ajustada 0,28) y la etapa de aceleración/ápice del crecimiento (OR ajustada 0,37)
Conclusiones: Los hallazgos del presente estudio eviden-cian que la prevalencia de exceso de peso en los adolescentes es preocupante. La etapa de aceleración/ápice del crecimiento y el alto consumo de carbohidrato fueron relacionados como factores protectores al exceso de peso entre las muchachas. Se sugiere además que este último factor sea analizado con cautela, una vez que tal asociación no fue observada en otros estudios.
Palabras clave: estado nutricional; adolescente; análisis de regresión.
Introduction
In the 1970s, 4% of Brazilian children and adolescents aged 6 to 18 were overweight or obese, but by 1997 this rate had tripled, reaching 13%(1). According to a recent national
government survey of Brazilian household budgets (POF 2008-2009)(2), the prevalence rates of overweight and obesity
among adolescents aged 10 to 19 years were 21.5 and 5.8% respectively. Another national government survey investi-gated the health of ninth grade schoolchildren in Brazilian state capitals and the federal capital in 2009 (PeNSE)(3). That
survey found that 16% of them were overweight (14.5% of children at public schools and 21.4% at private schools)
and 7.2% of them were obese (6.5% of children at public schools and 9.9% at private schools). Overall, 23.2% of the schoolchildren analyzed had excess weight.
The cause of excess weight is multifactorial, and genetic and environmental factors have the greatest effects. Genetic variables account for approximately 25 to 30% of obesity-related factors(4).
Lifestyle habits are also important factors. Adolescents tend to prefer fast meals, the majority comprising very high-calorie foods such as snacks and sodas. It has also been shown that is-sues such as energy density, satiety and palatability are related to these choices. According to Schrauwen and Westerterp(5), the
high palatability and low capacity for satiety of high-fat foods result in excessive energy intake. Another feature of fats is their low oxidative power, which favors a positive energy balance, leading to a build up of fat over a short period(6).
With regard to physical inactivity and sedentary habits, it has been observed that over recent decades more and more leisure time is being dedicated to watching television and playing video games(5). Compounding this, it has also been observed that
over recent decades the energy required to perform day-to-day activities and occupational tasks has been reducing(7).
Against this background, the objectives of this study were to estimate the prevalence of excess weight among adolescents aged 10 to 14 years enrolled at public schools in Piracicaba, SP, Brazil, and to analyze factors associated with the condition.
Method
This is a cross-sectional study, part of a second analysis of a cohort recruited for a research project entitled Dietary intake and physical activity as determinants of changes in body mass index in a cohort of adolescents enrolled at public schools in the city of Piracicaba, SP.
The study recruited 269 adolescent residents of Piracicaba of both sexes, enrolled in the 5th to 8th grades of public primary schools in Piracicaba, SP, Brazil, and aged from 10 to 14 years. Data collection took place from September to December of 2005. MedCalc Statistical was used to calculate a hypothesis test sample size for 20% prevalence of excess weight(3), 5% type I error and 10% type II error,
zone and one in a rural area. In the second stage, grades were chosen by lots and then the students who would take part were selected, depending on the size of the school.
Habitual dietary intake was assessed using the Adolescent Food Frequency Questionnaire (AFFQ), which was validated by Slater et al(8). Twelve adolescents’ data was excluded from
the intake data analysis in order to avoid information bias, since their responses equated to intakes of more than 7,000 kcal. Intake of energy and of macronutrients was assessed in tertiles, as follows: a) normal; b) high; c) excessive.
Information on sexual maturity was compiled using Tanner’s spreadsheets(9). The adolescents were classiied on the basis of
three growth phases, as follows: a) not yet reached puberty; b) accelerating/peak growth; c) decelerating growth(10).
The following anthropometric measurements were taken: weight in kilograms (kg) and height in centimeters (cm). Adolescents were weighed unshod wearing light clothing on a stand-on electronic balance (Tanita®) with 150kg capacity and
sensitive to 100g. Height was measured using a stadiometer (Seca®) marked in millimeters. Weight (kg) and height (cm)
were both recorded twice and the means of both measure-ments were used to obtain body mass index (BMI), which is calculated by dividing weight by the square of height.
Adolescents were classiied by anthropometric proile using BMI for age percentiles(11) from the Centers for Disease Control
and Prevention(CDC) reference curves(12). Adolescents were
clas-siied as underweight if their BMI was below the 5th percentile; healthy weight between percentiles 5 and 84.9; overweight between percentiles 85 and 94.9 or obese if BMI was at or above the 95th percentile. The overweight and obese categories were analyzed together, under the outcome label “excess weight”.
Physical activity was assessed by administering an Adoles-cent Physical Activity Assessment Questionnaire (APAAQ), which was validated by Florindo et al(13). A weekly physical
activity score (WPAS) was calculated and classiied according to a cutoff point of 300 minutes of physical activity per week (min/week) as proposed by Pate et al(14). Sedentary habits were
classiied according to a cutoff point of 2 hours watching television per day, in line with American Academy of Pedi-atrics recommendations(15). Video games and computer usage
were classiied as dichotomous variables (yes or no). This research project was approved by the Universidade de São Paulo Public Health Department’s Research Ethics Committee (protocol number 1550/2005) and the Regional Director of Education in Piracicaba also authorized the study (protocol number 084/2004). Adolescents’ parents or guard-ians were asked to sign free and informed consent forms.
Excess weight prevalence rates were calculated with 95% conidence intervals (95%CI). The characteristics of the sample were described with relation to nutritional status (healthy weight or excess weight for boys and girls) using absolute and relative frequencies. Simple linear regression adjusted for macronutrient intakes was used in order to cancel out the effect of energy.
Statistical analyses of associations between independent fac-tors and the dependent variable excess weight were conducted using binary univariate and multiple logistic regression models for each sex. The multiple analysis tested those variables with a descriptive level of less than 20% and those that the theoretical literature suggests could explain certain behaviors.
Statistical associations were considered present at descrip-tive levels below 5%. The Statistical Package for the Social Sci-ences (SPSS) for Windows, version 12, was used for analyses.
Results
The study population comprised 269 adolescents aged 10 to 14: 118 (43.9%) boys and 151 (56.1%) girls. The preva-lence rates of excess weight (95%CI) for boys and girls were 35.7 (95%CI 30-41.4) and 26.2% (95%CI 20.9-31.5) re-spectively. Tables 1 and 2 provide descriptive statistics for the adolescents by nutritional status (excess weight or healthy weight) against the independent variables investigated.
Table 3 lists Odds Ratios (OR), 95%CI and p- values for the univariate logistic regression analysis for the males. None of the variables had a statistically signiicant association with excess weight.
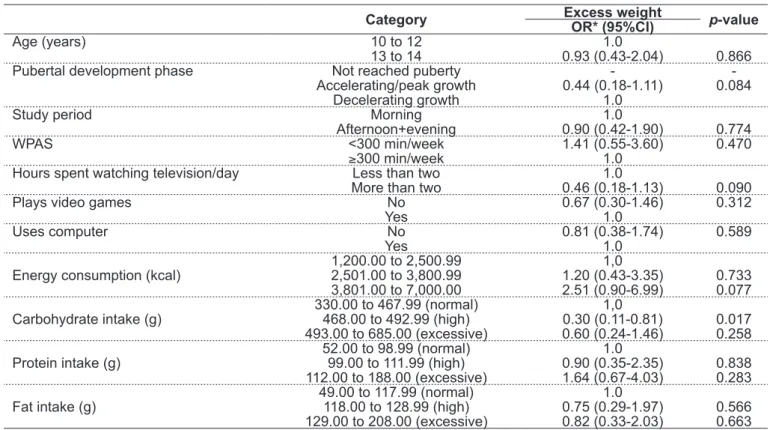
Table 4 lists the results of the binary univariate logistic regression for the females. It will be observed that the only variable with a statistically signiicant association was car-bohydrate intake. A high carcar-bohydrate intake, from 468.00 to 492.99g, proved to be a protective factor against excess weight when compared with normal carbohydrate intake (330.00 to 467.99g) for these adolescent girls (raw OR 0.30, 95%CI 0.11-0.81). It was not possible to perform this analy-sis for the subset that had not yet reached puberty because there were cells with zero values for excess weight.
Table 2 - Number and percentage of adolescents by sex, excess weight and nutritional characteristics
Boys Girls
Excess weight Healthy weight Excess weight Healthy weight
n (%) n (%) n (%) n (%)
Energy consumption (kcal)
1,200.00 to 2,500.99 17 (44.7) 26 (38.2) 7 (18.9) 29 (28.4) 2,501.00 to 3,800.99 12 (31.6) 15 (22.1) 13 (35.2) 45 (44.1) 3,801.00 to 7,000.00 9 (23.7) 27 (39.7) 17 (45.9) 28 (27.5) Carbohydrate intake (g)
330.00 to 467.99 (normal) 11 (28.9) 15 (22.1) 19 (51.4) 32 (31.4) 468.00 to 492.99 (high) 15 (39.5) 25 (36.8) 7 (18.9) 39 (38.2) 493.00 to 685.00 (excessive) 12 (31.6) 28 (41.2) 11 (29.7) 31 (30.4) Protein intake (g)
52.00 to 98.99 (normal) 12 (31.6) 22 (32.4) 12 (32.4) 38 (37.3) 99.00 to 111.99 (high) 13 (34.2) 27 (39.7) 10 (27.0) 35 (34.3) 112.00 to 188.00 (excessive) 13 (34.2) 19 (27.9) 15 (40.5) 29 (28.4) Fat intake (g)
49.00 to 117.99 (normal) 11 (28.9) 26 (38.2) 12 (32.4) 28 (27.5) 118.00 to 128.99 (high) 14 (36.8) 27 (39.7) 11 (29.7) 34 (33.3) 129.00 to 208.00 (excessive) 13 (34.2) 15 (22.1) 14 (37.8) 40 (39.2)
Table 1 - Number and percentage of adolescents by sex and excess weight, demographic characteristics, maturity and lifestyle
WPAS: Weekly physical activity score
Boys Girls
Excess weight Healthy weight Excess weight Healthy weight
n (%) n (%) n (%) n (%)
Age (years)
10 to 11 11 (27.5) 12 (16.7) 13 (34.2) 35 (32.7)
12 to 14 29 (72.5) 60 (83.3) 25 (65.8) 72 (67.3)
Pubertal development phases
Not reached puberty 6 (15.4) 11 (15.3) 0 - 5 (4.7) Accelerating/peak growth 30 (76.9) 57 (79.2) 28 (73.7) 88 (82.2) Decelerating growth 3 (7.7) 4 (5.6) 10 (26.3) 14 (13.1) WPAS
<300 min/week 3 (7.5) 5 (6.9) 8 (21.1) 17 (15.9)
≥300 min/week 37 (92.5) 67 (93.1) 30 (78.9) 90 (84.1) Hours spent watching television/day
Less than two 4 (10.0) 6 (8.3) 10 (26.3) 15 (14.0) More than two 36 (90.0) 66 (91.7) 28 (73.7) 92 (86.0) Plays video games
No 14 (35.0) 21 (29.2) 24 (63.2) 77 (72.0)
Yes 26 (65.0) 51 (70.8) 14 (36.8) 30 (28.0)
Uses computer
No 23 (57.5) 47 (65.3) 23 (60.5) 70 (65.4)
Table 3 - Results of binary univariate logistic regression analysis for males. Piracicaba, Brazil, 2005
OR: Odds Ratio. WPAS: Weekly physical activity score. *Healthy weight is the reference category
Category Excess weightOR* (95%CI) p-value
Age (years) 10 to 12 1.0
13 to 14 0.53 (0.2 -1.34) 0.178 Pubertal development phase Not reached puberty 0.73 (0.12-4.39) 0.728 Accelerating/peak growth 0.70 (0.15-3.34) 0.657
Decelerating growth 1.0
Study period Morning 1.0
Afternoon+evening 0.46 (0.21-1.01) 0.054
WPAS <300 min/week 1.09 (0.25-4.80) 0.913
≥300 min/week 1.0 Hours spent watching television/day Less than two 1.0
More than two 0.81 (0.22-3.10) 0.767
Plays video games No 1.31 (0.57-2.98) 0.524
Yes 1.0
Uses computer No 0.72 (0.33-1.59) 0.416
Yes 1.0
Energy consumption (kcal) 1,200.00 to 2,500.99 1.0
2,501.00 to 3,800.99 1.22 (0.46-3.24) 0.685 3,801.00 to 7,000.00 0.51 (0.19-1.35) 0.174 Carbohydrate intake (g) 330.00 to 467.99 (normal) 1.0
468.00 to 492.99 (high) 0.81 (0.30-2.24) 0.696 493.00 to 685.00 (excessive) 0.58 (0.21-1.64) 0.307 Protein intake (g) 52.00 to 98.99 (normal) 1.0
99.00 to 111.99 (high) 0.88 (0.34-2.32) 0.800 112.00 to 188.00 (excessive) 1.25 (0.46-3.40) 0.656 Fat intake(g) 49.00 to 117.99 (normal) 1.0
118.00 to 128.99 (high) 1.23 (0.47 - 3.19) 0.677 129.00 to 208.00 (excessive) 2.05 (0.74 - 5.70) 0.170
Table 4 - Results of binary univariate logistic regression analysis for females. Piracicaba, Brazil, 2005
OR: Odds Ratio. WPAS: Weekly physical activity score. *Healthy weight is the reference category
Category Excess weightOR* (95%CI) p-value
Age (years) 10 to 12 1.0
13 to 14 0.93 (0.43-2.04) 0.866 Pubertal development phase Not reached puberty -
-Accelerating/peak growth 0.44 (0.18-1.11) 0.084 Decelerating growth 1.0
Study period Morning 1.0
Afternoon+evening 0.90 (0.42-1.90) 0.774
WPAS <300 min/week 1.41 (0.55-3.60) 0.470
≥300 min/week 1.0
Hours spent watching television/day Less than two 1.0
More than two 0.46 (0.18-1.13) 0.090
Plays video games No 0.67 (0.30-1.46) 0.312
Yes 1.0
Uses computer No 0.81 (0.38-1.74) 0.589
Yes 1.0
Energy consumption (kcal)
1,200.00 to 2,500.99 1,0
2,501.00 to 3,800.99 1.20 (0.43-3.35) 0.733 3,801.00 to 7,000.00 2.51 (0.90-6.99) 0.077
Carbohydrate intake (g)
330.00 to 467.99 (normal) 1,0
468.00 to 492.99 (high) 0.30 (0.11-0.81) 0.017 493.00 to 685.00 (excessive) 0.60 (0.24-1.46) 0.258
Protein intake (g)
52.00 to 98.99 (normal) 1.0
99.00 to 111.99 (high) 0.90 (0.35-2.35) 0.838 112.00 to 188.00 (excessive) 1.64 (0.67-4.03) 0.283
Fat intake (g)
49.00 to 117.99 (normal) 1.0
Discussion
The importance of studying the nutritional status of ado-lescents lies in the fact that this population spends certain periods of time engaged unhealthy behaviors that can have repercussions in adulthood. This is a phase during which the personality is being formed and is a determinant for inter-ventions aimed to improve health and nutrition, bearing in mind the phenomenon of consolidation of lifestyle habits.
Excess weight during childhood and adolescence can have both short and long-term consequences. Short-term effects include orthopedic disorders, respiratory problems, diabe-tes, arterial hypertension and dyslipidemias, in addition to psychosocial disorders. Over the long term, there is evidence that adults who were obese at this age suffer increased mor-tality due to many different causes, but particularly due to coronary disease(16).
The excess weight prevalence rates recorded in this study were elevated, at 35.7% of the boys and 26.2% of the girls. This mirrors the indings of Toral, Slater and Silva(17) who
published the irst study of the adolescents in this cohort and observed high prevalence rates for both sexes, at 23.8 and 18.6%, for boys and girls respectively.
The WHO recommendations based on the CDC curves were retained for this study in order to maintain standard-ization between different studies of the same cohort(11,12).
However, one of the limitations of this study is the attempt to assess nutritional status in adolescents, since there is no consensus on classiication criteria, making comparisons between different studies problematic and introducing the possibility of overestimation or underestimation of preva-lence rates.
A study conducted in the municipality of Capão da Canoa, RS, assessed 510 adolescents aged 11 to 13 enrolled at public and private schools and reported indings that differ from the results of this study in terms of overweight by sex and
type of school. With relation to sex, similar prevalence rates were observed for the boys and the girls (27.9 vs. 21.6%). With relation to type of school, the prevalence of overweight in adolescents at public schools was 23.1%, which was well below the prevalence among the private school students (39.2%)(18).
A study conducted by Vieira et al(19) assessed
schoolchil-dren at both public and private schools in the city of Pelotas, RS, and found that the prevalence rates of overweight in the 11 to 17 age group were 14.4% for boys and 18.5% for girls. These authors suggest that type of school could be considered a proxy for socioeconomic status and that going to private school was a risk factor.
Research conducted by Adami and Vasconcelos(20) with
adolescents aged 10 to 14 from the city of Florianópolis, SC, found that the prevalence of overweight among the girls was 16.5%. In contrast, among the boys overweight prevalence (27.8%) was similar to what was observed in this study for excess weight. It should however be pointed out that the study of adolescents from Florianópolis adopted the nutri-tional status cutoff point proposed by Conde and Monteiro(21)
unlike the other studies mentioned.
Veiga et al(22) analyzed the trend in overweight from 1975
to 1997 among adolescents aged 10 to 19 from all regions of Brazil and found that prevalence had increased in each decade. The prevalence rates of overweight in the 10 to 13 age group for the last year analyzed (1997) were 21.0% for boys and 24.9% for girls.
The igure for the prevalence of excess weight reported here for the boys (35.7%, 95%CI 30-41.4), which was calculated using the WHO’s CDC-based reference, is similar to igures for risk of overweight/obesity observed in the United States. Ogden et al(23) reported an increase in the prevalence of risk
of overweight/obesity among male adolescents aged 12 to 19 between 1999 and 2004, rising from 30.0% in 1999-2000, through 31.5% in 2001-2002 to 36.8% in 2003-4. In
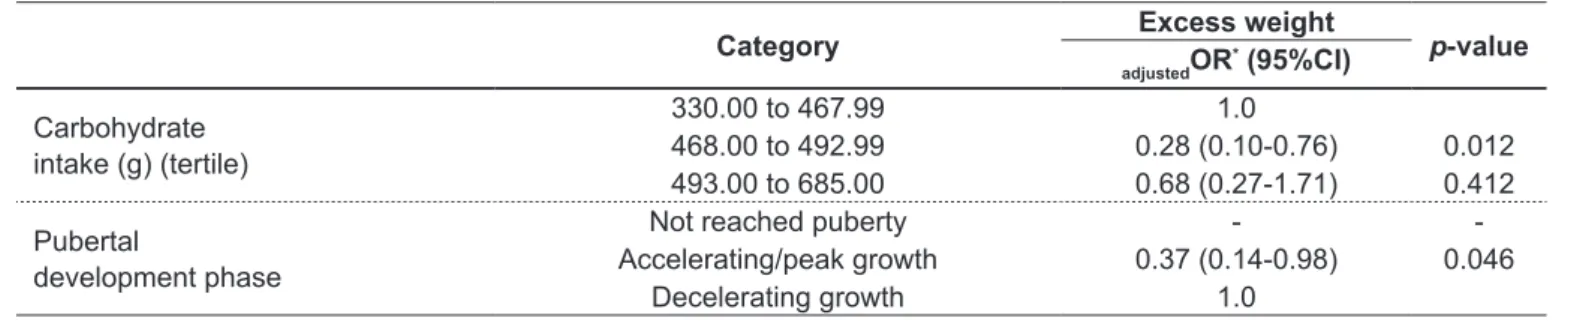
Table 5 - Results of binary multiple logistic regression analysis for females
OR: Odds Ratio. *Healthy weight is the reference category; analysis adjusted by habitual physical activity score
Category Excess weight p-value
adjustedOR
* (95%CI)
Carbohydrate intake (g) (tertile)
330.00 to 467.99 1.0
468.00 to 492.99 0.28 (0.10-0.76) 0.012 493.00 to 685.00 0.68 (0.27-1.71) 0.412
Pubertal
development phase
Not reached puberty -
contrast, among the girls prevalence remained stable at 30.0%, which is higher than the result found here.
The prevalence of excess weight observed here for the girls is close to rates observed in adolescents in countries such as Spain (21.0%), England (21.0%) and Greece (22.0%)(24). In
other words, the igures for these adolescents from public schools in Piracicaba are in line with what is being reported by both the Brazilian and the international studies cited.
It is notable that the prevalence of excess weight was higher among the boys in this study that the girls. Accord-ing to the literature, boys seek to gain weight by increasAccord-ing muscle mass, whereas girls aim for slimmer bodies(25,26). On
this basis, Frisancho(27) has suggested that muscle mass may
be hidden in fat stocks, contributing to the excess weight among boys.
One point that the PeNSE(3), Dutra et al(28), and Vieira
et al(19), studies have in common is the observation that the
prevalence rates of excess weight, overweight and obesity were higher among adolescents at private schools when compared with those at public schools. In the present study no adolescents enrolled at the private schools in Piracicaba were assessed, which could be seen as a type of selection bias since the adolescents at public schools may be less exposed to factors that contribute to excess weight, such as using electronic devices (video games), going to school and other destinations by car, consumption of ready-made foods that are quick to prepare, and others. As has been mentioned earlier, going to private school could be seen as a proxy for a higher family economic status(16,18) and, according to
Brazil-ian data, adolescents from higher-income families may have a greater prevalence of excess weight(3).
The univariate logistic regression analysis conducted for the boys failed to detect any variables with a statistically signii-cant association. For the girls, statistically signiisignii-cant associa-tions with excess weight were detected for carbohydrate intake stratiied in tertiles and the phases of pubertal development. Elevated carbohydrate intake proved to be a protective factor against excess weight when compared with normal intake. The pubertal development category “accelerating/peak growth” also proved to be a protective factor against excess weight, when compared with the “decelerating growth” category.
There is still no consensus in the literature on the relation-ships between carbohydrate and other macronutrient intakes and excess weight and in the articles reviewed for this paper no associationswere reported(5,24,29-32). It should be pointed out
that the classiication of intakes into tertiles was based on the recommendations for the proportion of each macronutrient in
the total energy intake(30). With regard to carbohydrate intake,
the irst tertile, based on the energy intake of this sample, corresponds to normality (55 to 75%) meaning that second and third tertiles were classiied as high and excessive intake. It should be remembered that in this study dietary intake data was collected using a self-report food frequency ques-tionnaire and respondents may be more likely to remember foods they like, whereas foods they do not enjoy so much may be forgotten or reported with lower frequency(8). The
instru-ment may therefore be illustrating which foods have higher energy density and are more palatable(5). Another important
issue is the possibility that people who are overweight might underestimate their dietary intake(32), leading to failure to
detect some associations or detection of spurious associations. This appears to be the case here since adolescents with excess weight were less likely to report carbohydrate intake that fell within the high and excessive tertiles than within the normal intake tertile. In addition to these considerations, it is worth pointing out that this was a cross-sectional study, in which the event and outcome are observed at the same point in time, meaning that it does not relect the temporal sequence of the facts and therefore the data could be affected by the reverse causality effect; although all of the questionnaires used to measure habitual dietary intake and physical activity have been validated speciically for adolescents, ensuring better quality data(8,13).
It was also found that the category “accelerating/peak growth” acted as a protective factor against the outcome excess weight. This relationship is understandable since adolescents going through the growth spurt, during matu-ration, have increased calorie requirements and greater energy expenditure. In order to better elucidate this factor, the possibility of an interaction between the independent factors protective against excess weight was analyzed; how-ever no relationship between the variables was detected. It was observed that the majority of the girls (>70.0%) were in the accelerating/peak growth phase and had a greater intake of high-calorie foods together with greater energy expenditure(10). Studies that analyze sexual maturity and
excess weight generally test for associations on the basis of the age of menarche or the dichotomous condition of being pubescent or prepubescent(33,34) and do not take into account
the developmental phases of adolescence and their differing energy requirements. Comparison of the different studies that have dealt with this variable is therefore problematic.
to the factors associated with excess weight in adolescents at public schools in Piracicaba, it was found that being in the accelerating/peak growth phase and having high carbohy-drate intake were both protective factors. Nevertheless, it is recommended that the second of these be analyzed with caution since this association has not been observed in other studies and the variable may have suffered bias.
Acknowledgements
We are grateful to the São Paulo state research support fund (FAPESP - Fundação de Amparo à Pesquisa do Estado de São Paulo) for a masters bursary. We would also like to thank the adolescents who took part and the Regional Direc-tor of Education, Oldack Chaves.
References
1. World Health Organization; International Diabetes Federation [homepage on the Internet]. Fight childhood obesity to help prevent diabetes 2005 [cited 2006 Fev 2]. Available from: http://www.who.int/mediacentre/news/releases/2004/ pr81/en/index.html
2. Brasil. Instituto Brasileiro de Geograia e Estatística (IBGE). Pesquisa de Orçamento familiar 2008-2009: antropometria e análise do estado nutricional de crianças, adolescentes e adultos no Brasil. Rio de Janeiro: IBGE; 2010. 3. Brasil. Ministério do Planejamento, Orçamento e Gestão. Instituto Brasileiro
de Geograia e Estatística (IBGE). Pesquisa nacional de saúde do escolar. Rio de Janeiro: Ministério do Planejamento, Orçamento e Gestão, 2009. 4. Frisancho AR. Prenatal compared with parental origins of adolescent fatness.
Am J Clin Nutr 2000;72:1186-90.
5. Schrauwen P, Westerterp KR. The role of high-fat diets and physical activity in the regulation of body weight. Br J Nutr 2000;84:417-27.
6. Crowe TC, Fontaine HL, Gibbons CJ, Cameron-Smith D, Swinburn BA. Energy density of foods and beverages in the Australian food supply: inluence of macronutrients and comparison to dietary intake. Eur J Clin Nutr 2004;58:1485-91.
7. Andersen LF, Nes M, Sandstad B, Bjorneboe GE, Drevon CA. Dietary intake among Norwegian adolescents. Eur J Clin Nutr 1995;49:555-64.
8. Slater B, Philippi ST, Fisberg RM, Latorre MR. Validation of a semi-quantitative adolescent food frequency questionnaire applied at a public school in São Paulo, Brazil. Eur J Clin Nutr 2003;57:629-35.
9. Tanner JM, editor. Growth at Adolescence. 2nd ed. Oxford: Blackwell Scientiic;
1962.
10. Poit ML. Desenvolvimento puberal. In: Françoso LA, Gejer D, Reato LF, editors. Sexualidade e saúde reprodutiva na adolescência. São Paulo: Atheneu; 2001. p. 21-32.
11. World Health Organization. Physical status: the use and interpretation of anthropometry. Report of a WHO Expert Committee {Technical Report Series No. 854}. Geneva: WHO; 1995.
12. Center for Disease Control and Prevention [homepage on the Internet]. Atlanta: National Center for Health Statistics. CDC Growth Charts 2000 [cited 2006 Nov 18]. Available from: http://www.cdc.gov/growthcharts
13. Florindo AA, Romero A, Peres SV, Silva MV, Slater B. Development and validation of a physical activity assessment questionnaire for adolescents. Rev Saude Publica 2006;40:802-9.
14. Pate RR, Freedson PS, Sallis JF, Taylor WC, Sirard J, Trost SG et al. Compliance with physical activity guidelines: prevalence in a population of children and youth. Ann Epidemiol 2002;12:303-8.
15. American Academy of Pediatrics; Committee on Public Education. American Academy of Pediatrics: children, adolescents, and television. Pediatrics 2001;107:423-6.
16. Must A. Morbidity and mortality associated with elevated body weight in children and adolescents. Am J Clin Nutr 1996;63 (Suppl 3):S445-7.
17. Toral N, Slater B, Silva MV. Food consumption and overweight in adolescents from Piracicaba, São Paulo, Brazil. Rev Nutr 2007;20:449-59.
18. Suñé FR, Dias-da-Costa JS, Olinto MT, Pattussi MP. Prevalence of overweight and obesity and associated factors among schoolchildren in a southern Brazilian city. Cad Saude Publica 2007;23:1361-71.
19. Vieira MF, Araújo CL, Hallal PC, Madruga SW, Neutzling MB, Matijasevich A et al. Nutritional status of irst to fourth-grade students of urban schools in Pelotas, Rio Grande do Sul State, Brazil. Cad Saude Publica 2008;24:1667-74. 20. Adami F, Vasconcelos FA. Obesity and early sexual maturation among students
from Florianopolis – SC. Rev Bras Epidemiol 2008;11:549-60.
21. Conde WL, Monteiro CA. Body mass index cutoff points for evaluation of nutritional status in Brazilian children and adolescents. J Pediatr (Rio J) 2006;82:266-72.
22. Veiga GV, Cunha AS, Sichieri R. Trends in overweight among adolescents living in the poorest and richest regions of Brazil. Am J Public Health 2004;94:1544-8.
23. Ogden CL, Carroll MD, Curtin LR, McDowell MA, Tabak CJ, Flegal KM. Prevalence of overweight and obesity in the United States, 1999-2004. JAMA 2006; 295:1549-55.
24. Popkin BM, Gordon-Larsen P. The nutrition transition: worldwide obesity dynamics and their determinants. Int J Obes Relat Metab Disord 2004;28 (Suppl 3):S2-9.
25. Vilela JE, Lamounier JA, Oliveira RG, Ribeiro RQ, Gomes EL, Barros Neto JR. Assesment of eating attitudes of children and adolescents in Belo Horizonte City. Psiquiatria Biologica 2001;9:121-30.
26. Conti MA, Costa LS, Peres SV, Toral N. The body dissatisfaction of adolescents: an exploratory research. Physis 2009;19:509-28.
27. Frisancho AR. Anthropometric Standards for the assessment of growth and nutritional status. Ann Arbor: University of Michigan Press; 1990.
28. Dutra CL, Araújo CL, Bertoldi AD. Prevalence of overweight in adolescents: a population-based study in a southern Brazilian city. Cad Saude Publica 2006;22:151-62.
29. Nicholls D, Viner R. Eating disorders and weight problems. BMJ 2005;330:950-3.
30. Brasil. Ministério da Saúde. Secretaria de atenção à saúde - coordenação geral da política da alimentação e nutrição. Guia alimentar para a população brasileira: promovendo a alimentação saudável. Série A: normas e manuais técnicos. Brasília: Ministério da Saúde, 2005.
31. Gray A, Smith C. Fitness, dietary intake, and body mass index in urban Native American youth. J Am Diet Assoc 2003;103:1187-91.
32. Campagnolo PD, Vitolo MR, Gama CM, Stein AT. Prevalence of overweight and associated factors in southern Brazilian adolescents. Public Health 2008;122:509-15.
33. Ribeiro J, Santos P, Duarte J, Mota J. Association between overweight and early sexual maturation in Portuguese boys and girls. Ann Hum Biol 2006;33:55-63.