DOI: http://dx.doi.org/10.5007/1980-0037.2013v15n5p535
original article
RBCDH
Licence Creative Commom
CC
Overweight and obesity and associated factors
in technical and administrative staf at a
Brazilian Federal University
Excesso de peso, obesidade abdominal e fatores associados
em servidores de uma Universidade Federal Brasileira
Juliane Berria1
Edio Luiz Petroski1
Giseli Minatto1
Abstract– he objectives of this study were to determine the prevalence rates of excess weight and abdominal obesity among technical and administrative staf at the Univer-sidade Federal de Santa Catarina (UFSC) using a range of diferent anthropometric indicators and to identify sociodemographic factors associated with these rates. his was a cross-sectional study of 615 members of staf at UFSC (283 men and 332 women). he following anthropometric indicators were analyzed: body mass index (BMI), waist circumference (WC) and waist to height ratio (WHtR). he following sociodemographic variables were also analyzed: age, sex, skin color, marital status, socioeconomic status, educational level and employment grade. Statistical analysis was conducted using Student’s t test, the Mann-Whitney U test and Poisson regression (with a 95% conidence interval). Prevalence rates for men and women respectively were as follows; excess weight: 63.6% and 49.7% (BMI); abdominal obesity (WC): 33.5% and 42.4%; and abdominal obesity (WHtR): 61.8% and 40.6%. Age greater than 40 years was associated with a higher prob-ability of excess weight and abdominal obesity in men (by BMI and WHtR) and women (by BMI, WC and WHtR). Women who had spent 8 years or fewer in education had lower probabilities of excess weight (PR=0.67; 95%CI=0.49; 0.94) and abdominal obesity, by both WC (PR=0.62; 95%CI=0.44; 0.90) and WHtR (PR=0.49; 95%CI=0.39; 0.64). hese results indicate an elevated prevalence of excess weight and abdominal obesity and show that the factors associated with these outcomes vary by sex and depending on the an-thropometric indicator analyzed.
Key words: Abdominal obesity; Educational level; Income; Occupational health; Overweight.
Resumo – O objetivo deste estudo foi veriicar a prevalência de excesso de peso e obesidade abdominal, segundo diferentes indicadores antropométricos, e os fatores sociodemográicos associados em servidores técnico-administrativos da Universidade Federal de Santa Catarina. Estudo transversal realizado com 615 servidores da UFSC (283 homens e 332 mulheres). Foram analisados os indicadores antropométricos: índice de massa corporal (IMC), circun-ferência da cintura (CC) e razão cintura estatura (RCEst) e as variáveis sociodemográicas (idade, sexo, cor da pele, estado civil, nível socioeconômico, nível de escolaridade e nível ocupacional). As análises estatísticas abrangeram o teste t de student, teste U de Mann--Witney e regressão de Poisson (Intervalo de Coniança de 95%). Para homens e mulheres, a prevalência de excesso de peso foi de 63,6% e 49,7% (IMC) e de obesidade abdominal de 33,5%, 42,4% (CC), 61,8% e 40,6% (RCEst), respectivamente. Ter mais de 40 anos identi-icou maior probabilidade de excesso de peso e obesidade abdominal em homens (IMC e RCEst) e mulheres (IMC, CC e RCEst). A probabilidade de ter excesso de peso (RP=0,67; IC95%=0,49; 0,94) e obesidade abdominal, segundo a CC (RP=0,62; IC95%=0,44; 0,90) e RCEst (RP=0,49; IC95%=0,39; 0,64), foi menor para as mulheres com oito anos de esco-laridade ou menos. Esses resultados indicam uma elevada prevalência de excesso de peso e obesidade abdominal e que os fatores associados a esses desfechos diferem segundo o sexo e de acordo com o indicador antropométrico analisado.
1 Universidade Federal de Santa Catarina, Postgraduate program in Physical Education, Center for Kinanthropometry and Human Performance Research, Florianó-polis, Santa Catarina, Brazil.
INTRODUCTION
Obesity is deined as the abnormal or excessive accumulation of fat to the point that it may represent a health risk1. Obesity is considered a public health problem, and one that appears to be worsening in a variety of dif-ferent sociodemographic groups2.
In Brazil, a telephone survey of chronic disease risk factors and protec-tion factors (VIGITEL) conducted in the country’s 26 state capitals and the national capital found that the prevalence of excess body weight among men increased from 47.2% in 2006 to 52.1% in 2010 and that among women it increased from 38.5% in 2006 to 44.3% in 20103. In addition to increases in the prevalence of overweight and obesity, researchers have also found that the prevalence of obesity in any given country can vary depending on the socioeconomic characteristics of the population4.
Among workers, health problems such as excess weight appear to be associated with the type of work performed and with the working
environ-ment5. Prevalence rates of overweight varying from 36.6% to 38.9% and
of obesity varying from 12.7% to 17.0% have been observed in technical and administrative staf working at public institutions in Brazil6,7.hese igures are worrying since, among others, diseases such as diabetes, car-diovascular problems and high blood pressure are associated with high levels of body fat.8 In addition to increased risk for a range of morbidities, obesity in general and abdominal obesity in particular are also associated
with mortality8, and increased risk has also been detected in those who
are merely overweight9.
In addition to excess weight, accumulation of fat in the center of the body has also been associated with increased risk of metabolic and cardiovascular diseases8,10. Another factor of relevance is that the both prevalence rates of excess weight and abdominal obesity and the variables associated with these outcomes can difer depending on which anthro-pometric indicator is analyzed11-13. As a result, the literature recommends using several diferent anthropometric indicators for identiication of
overweight and obesity8,14 in order to enable greater understanding of
outcomes. Notwithstanding, few Brazilian studies have analyzed the prevalence of excess weight and abdominal obesity using more than one anthropometric indicator11-13.
he objective of this study was therefore to analyze the prevalence of excess weight and abdominal obesity and their associations with sociode-mographic factors in technical and administrative staf at the Universidade Federal de Santa Catarina (UFSC), using several diferent anthropometric indicators.
METHODOLOGICAL PROCEDURES
cross-sectional epidemiological research project entitled “Lifestyle, physi-cal activity, perceived body image and health risk factors in educational technical and administrative staf at the Universidade Federal de Santa Catarina”, which was approved by the Human Research Ethics Committee at UFSC, hearing number 95.411, on September 10, 2012.
he target population for this study comprised all technical and admin-istrative staf at UFSC. According to data provided by UFSC, in September of 2012 the university’s educational technical and administrative staf num-bered 2,993 people, 171 were on the “auxiliary” employment grade, 1,823 on the “intermediate” grade and 999 were employed on the “top” grade.
he following parameters were used for the sample size calculation: unknown prevalence of the outcomes in question (50%), sampling error of 3.5 percentage points and 95% conidence level, resulting in a minimum sample size of 621 people. his igure was increased by 20% to allow for losses and refusals to take part, making a inal total of 746 staf members.
A proportional sample frame was used to guarantee representativeness of staf on each of the three employment grades: auxiliary, intermediate or top. As a result, 43 auxiliary staf members, 456 intermediate staf mem-bers and 250 top level staf memmem-bers were selected by systematic random sampling, making a inal sample of 749 staf members.
Sampling was conducted with substitution of staf members who were on leave or transfers, who were no longer employed by the university be-cause of voluntary or enforced termination of employment or retirement and of members of staf who could not be located due to inaccurate infor-mation on their place of work. A total of 54 staf members were substituted for one of these reasons. Each was substituted by the next staf member on the list.
Inclusion criteria were as follows: all UFSC technical and administra-tive staf, of either sex, who agreed to take part in the study and signed a free and informed consent form. Staf members were excluded if they did not have anthropometric measurements taken, whether because of some impediment or because they refused. Pregnant women were also excluded. Staf members who were on holiday, on sick leave or who could not be located ater conirmation of their place of work were deined as losses.
Data collection was conducted from October to December of 2012 (a total of 10 weeks) at staf members’ places of work, during their working hours. he data collection team was made up of teachers and students from the Physical Education degree course and had all been trained in advance. he examiners who collected the anthropometric data calculated
technical errors of measurement (TEM)15,16. he results were acceptable:
intra-observer TEM for Height =0.08 cm; inter-observer TEM for Height =0.58 cm, intra-observer TEM for WC =0.24 cm; and inter-observer TEM for WC =1.98 cm.
Body mass was measured using an Incoterm® brand digital balance,
one meter from the loor, in accordance with procedures described by the
International Society for the Advancement of Kinanthropometry17. Waist
circumference (WC) was measured at the subject’s smallest circumference
using a Sanny® brand, non-stretch anthropometric tape, with resolution
of 0.1 cm17. When the smallest circumference could not be identiied, the midpoint between the lowest rib and the iliac crest was used.
Body mass and height were then used to calculate body mass index (BMI), using the formula body mass (kg) divided by the square of height (m), expressed in kg/m2. Excess body weight was identiied using the cutof
points proposed by the World Health Organization1, collapsing the
over-weight and obesity categories into a single excess over-weight category. Abdominal obesity was diagnosed using two anthropometric indica-tors: WC and the waist to height ratio (WHtR). he WHtR was calculated by dividing WC by height. Female staf members with WC ≥ 80 cm, male
staf members with WC ≥ 94 cm1 and staf members of either sex with
WHtR ≥0.5018 were classiied as having abdominal obesity.
A sociodemographic questionnaire was used to collect data on date of birth, date of assessment, sex, employment grade, skin color, marital status, socioeconomic status and educational level for each staf member. hese data were self-reported.
Age was calculated from the date of assessment and date of birth and categorized into the following age groups: 20–29 years, 30–39 years, 40–49 years, 50–59 years or 60–69 years. he skin color response options were those used in Brazilian national surveys, as follows: white (branca), brown (parda), black (preta), yellow (amarela) or indigenous (indígena)19. here were very people who self-identiied as brown, yellow or indigenous, so these three categories were collapsed for analysis. Marital status was clas-siied as single, married or separated/widowed.
Socioeconomic status was classiied using a questionnaire based on the Brazilian Economic Classiication Criteria (Critério de Classiicação Econômica Brasil)20 which has the following categories: A1, A2, B1, B2, C1, C2, D and E. For the purposes of analysis, these categories were collapsed as follows: High (A1 and A2), Intermediate (B1 and B2) and Low (C1, C2, D and E). he staf members’ educational level was classiied as follows: started primary school; graduated primary school; started secondary school; graduated secondary school; started higher education; or graduated higher education20. hese data were then categorized as follows: ≤ 8 years in education (started and/or graduated primary school); 9 to 11 years in education (started and/or graduated secondary school) and ≥ 12 years in education (started and/or graduated higher education).
proportions of categories for sociodemographic variables were identiied by non-overlapping conidence intervals (95%CI).
Where outcome prevalence rates were greater than 20%, Poisson re-gression with robust error variance was used to estimate the prevalence ratios and respective 95%CIs for outcomes (BMI, WC and WHtR) against sociodemographic indicators (age, skin color, marital status, educational level, socioeconomic level and employment grade). On the basis of a tem-poral relationship that is hypothesized to exist between the variables under analysis, the adjusted model was analyzed by hierarchies in three levels: 1) age and skin color (distal), 2) marital status and educational level (inter-mediate) and 3) socioeconomic level and employment grade (proximal). Variables were controlled for each other at each level of the hierarchical model and for variables in earlier levels that had p values ≤ 0.20. All analyses
were run with a 95%CI. Data were analyzed using the Statistical Package
for the Social Sciences (SPSS), version 15.0 for Windows and Stata Standard Edition, version 110 for Windows.
RESULTS
A total of 623 UFSC technical and administrative staf took part in the study. here were 83 refusals and 43 losses due to holidays (n=16), sick leave (n=16) or because attempts at contact during the study period were unsuccessful (n=11). Staf members were excluded from the sample if they refused to undergo anthropometric measurement (n=3), were unable to be measured (n=3) or were pregnant (n=2). he inal sample therefore comprised 615 staf members: 283 men and 332 women.
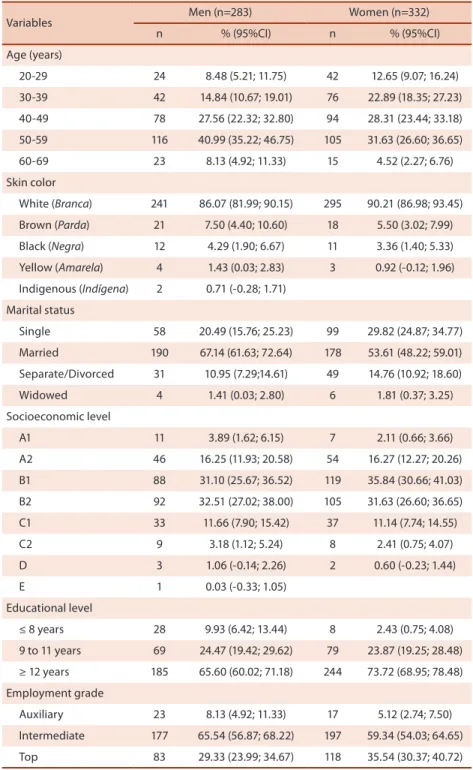
Table 1 lists the general characteristics of the sample, by sex. he men had higher mean age, body mass, height, WC, BMI and WHtR than the women (p<0.001). here were diferences between the sexes for the follow-ing indicators of excess weight and abdominal obesity: BMI in the normal category (men: 95%CI=29.84; 41.08; women: 95%CI=43.39; 54.20) and the overweight category (men: 95%CI=40.89; 51.59; women: 95%CI=26.31; 36.34), and WHtR in the normal (men: 95%CI=32.47; 43.86; women: 95%CI=54.03; 64.65) and excessive categories (men: 95%CI=56.14; 67.53; women: 95%CI=35.35; 45.97) (Table 1).
he sociodemographic data showed that the most common age group was 50-59 (40.99% of the men and 31.63% of the women), that the most common socioeconomic levels were B1 for women (35.84%) and B2 for men (32.51% of the men), and that the majority of staf were married (67.14% of the men and 53.61% of the women) had spent at least 12 years in education (65.60% of men and 73.72% of the women), had white skin (86.07% of the men and 90.21% of the women) and were on the intermediate employment grade (65.54% of the men and 59.34% of the women) (Table 2).
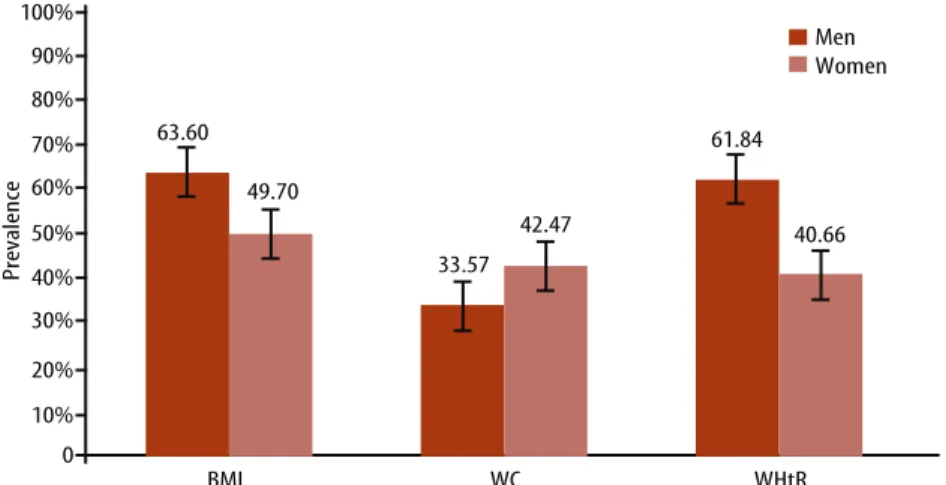
55.11) and WHtR (men: 61.84%, 95%CI=56.14; 67.53; women: 40.66%, 95%CI=35.35; 45.97). Men had greater prevalence of excess weight and abdominal obesity than women when measured by WHtR, whereas women had greater prevalence then men when measured by WC.
Table 1. Characteristics of the sample, by sex. UFSC, Brazil, 2012.
Variables Men Women
n Mean (SD) n Mean (SD)
Age (years) †† 283 46.88 (10.28) 332 43.62 (10.49)
Body mass (kg) †† 283 79.81 (14.96) 332 66.89 (12.33)
Height (cm) † 283 172.52 (9.18) 332 161.27 (6.72)
WC (cm) † 283 90.31 (11.36) 332 78.33 (10.67)
BMI (kg/m2) † 283 27.11 (9.35) 332 25.76 (4.64)
WHtR (cm) † 283 0.53 (0.08) 332 0.49 (0.07)
n % (95%CI) n % (95%CI)
BMI
Underweight 3 1.06 (-0.14; 2.26) 5 1.51 (0.19; 2.82)
Normal 100 35.46 (29.84; 41.08) 162 48.80 (43.39; 54.20)
Overweight 129 45.74 (40.89; 51.59) 104 31.33 (26.31; 36.34)
Obesity I 34 12.06 (8.23; 15.88) 48 14.46 (10.66; 18.26)
Obesity II 12 4.26 (1.89; 6.63) 10 3.01 (1.16; 4.86)
Obesity III 4 1.42 (0.03; 2.81) 3 0.90 (-0.12; 1.93)
WC
Normal 188 66.43 (60.90; 71.97) 191 57.53 (52.19;62.87)
Increased risk 53 18.73 (14.15; 23.30) 82 24.70 (20.04; 29.36)
Greatly increased risk 42 14.84 (10.67;19.01) 59 17.77 (13.64; 21.90)
WHtR
Normal 108 38.16 (32.47; 43.86) 197 59.34 (54.03; 64.65)
Excessive 175 61.84 (56.14; 67.53) 135 40.66 (35.35; 45.97)
Mean, SD: standard deviation, WC: waist circumference, BMI: body mass index, WHtR: waist to height ratio, kg: kilograms, cm: centimeters, m: meters, min: minutes, 95%CI: 95% conidence interval. †Student’s t test; ††Mann-Whitney U test.
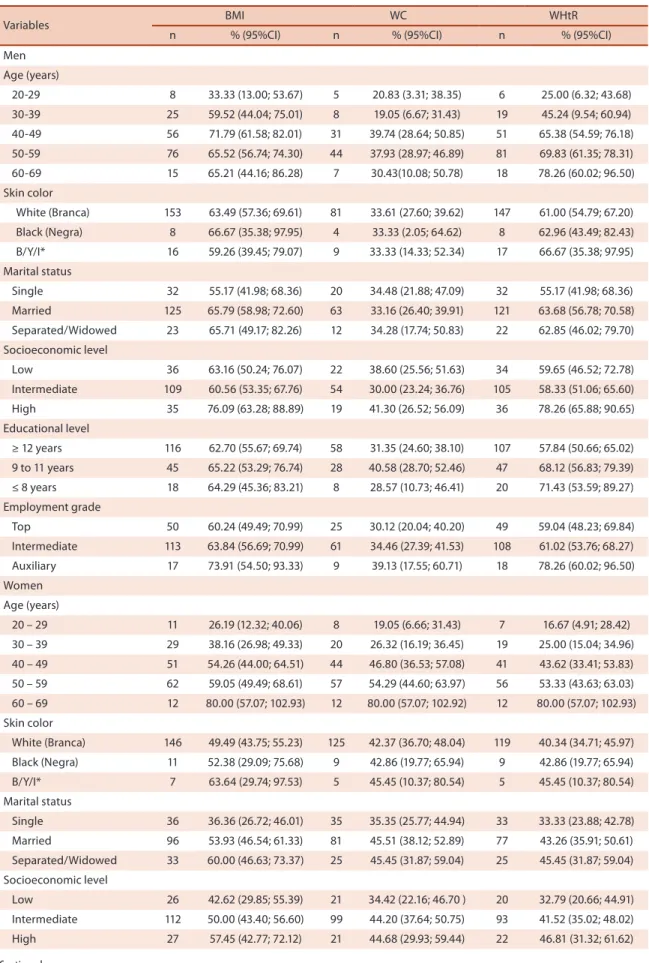
Figures for prevalence of excess weight and abdominal obesity are shown in Table 3. Among the men, prevalence rates for excess weight in the age groups 40-49 years (95%CI=61.58; 82.01) and 50-59 years (95%CI=56.74; 74.30) were greater than for 20-29 year-olds (95%CI=13.00; 53.67). Prevalence rates of abdominal obesity, according to WHtR, were greater for men in the 40-49 (95%CI=54.59; 76.18), 50-59 (95%CI=61.35; 78.31) and 60-69 age groups (95%CI=60.02; 96.50) than in the 20-29 age group (95%CI=6.32; 43.68). Prevalence of abdominal obesity according to WHtR was greater at the high socioeconomic level (95%CI=65.88; 90.65) than at the intermediate level (95%CI=51.06; 65.60).
95%CI=44.60; 63.97; WHtR: 95%CI=43.63; 63.03) and 60-69 years age groups (BMI: 95%CI=57.07; 102.93; WC: 95%CI=57.07; 102.92; WHtR: 95%CI= 57.07; 102.93) than in the 20-29 age group (BMI: 95%CI=12.32; 40.06; WC: 95%CI= 6.66; 31.43; WHtR: 95%CI=4.91; 28.42). In both sexes there was a progressive increase in prevalence rates of excess weight and abdominal obesity as age increased (Table 3).
Table 2. Distribution of sociodemographic indicators and health risk factors in UFSC technical and administrative staf, by sex. Brazil, 2012.
Variables Men (n=283) Women (n=332)
n % (95%CI) n % (95%CI)
Age (years)
20-29 24 8.48 (5.21; 11.75) 42 12.65 (9.07; 16.24)
30-39 42 14.84 (10.67; 19.01) 76 22.89 (18.35; 27.23)
40-49 78 27.56 (22.32; 32.80) 94 28.31 (23.44; 33.18)
50-59 116 40.99 (35.22; 46.75) 105 31.63 (26.60; 36.65)
60-69 23 8.13 (4.92; 11.33) 15 4.52 (2.27; 6.76)
Skin color
White (Branca) 241 86.07 (81.99; 90.15) 295 90.21 (86.98; 93.45)
Brown (Parda) 21 7.50 (4.40; 10.60) 18 5.50 (3.02; 7.99)
Black (Negra) 12 4.29 (1.90; 6.67) 11 3.36 (1.40; 5.33)
Yellow (Amarela) 4 1.43 (0.03; 2.83) 3 0.92 (-0.12; 1.96)
Indigenous (Indígena) 2 0.71 (-0.28; 1.71)
Marital status
Single 58 20.49 (15.76; 25.23) 99 29.82 (24.87; 34.77)
Married 190 67.14 (61.63; 72.64) 178 53.61 (48.22; 59.01)
Separate/Divorced 31 10.95 (7.29;14.61) 49 14.76 (10.92; 18.60)
Widowed 4 1.41 (0.03; 2.80) 6 1.81 (0.37; 3.25)
Socioeconomic level
A1 11 3.89 (1.62; 6.15) 7 2.11 (0.66; 3.66)
A2 46 16.25 (11.93; 20.58) 54 16.27 (12.27; 20.26)
B1 88 31.10 (25.67; 36.52) 119 35.84 (30.66; 41.03)
B2 92 32.51 (27.02; 38.00) 105 31.63 (26.60; 36.65)
C1 33 11.66 (7.90; 15.42) 37 11.14 (7.74; 14.55)
C2 9 3.18 (1.12; 5.24) 8 2.41 (0.75; 4.07)
D 3 1.06 (-0.14; 2.26) 2 0.60 (-0.23; 1.44)
E 1 0.03 (-0.33; 1.05)
Educational level
≤ 8 years 28 9.93 (6.42; 13.44) 8 2.43 (0.75; 4.08)
9 to 11 years 69 24.47 (19.42; 29.62) 79 23.87 (19.25; 28.48)
≥ 12 years 185 65.60 (60.02; 71.18) 244 73.72 (68.95; 78.48)
Employment grade
Auxiliary 23 8.13 (4.92; 11.33) 17 5.12 (2.74; 7.50)
Intermediate 177 65.54 (56.87; 68.22) 197 59.34 (54.03; 64.65)
Top 83 29.33 (23.99; 34.67) 118 35.54 (30.37; 40.72)
Figure 1. Prevalence of excess weight and abdominal obesity among UFSC technical and administrative staf, by sex. Brazil, 2012.
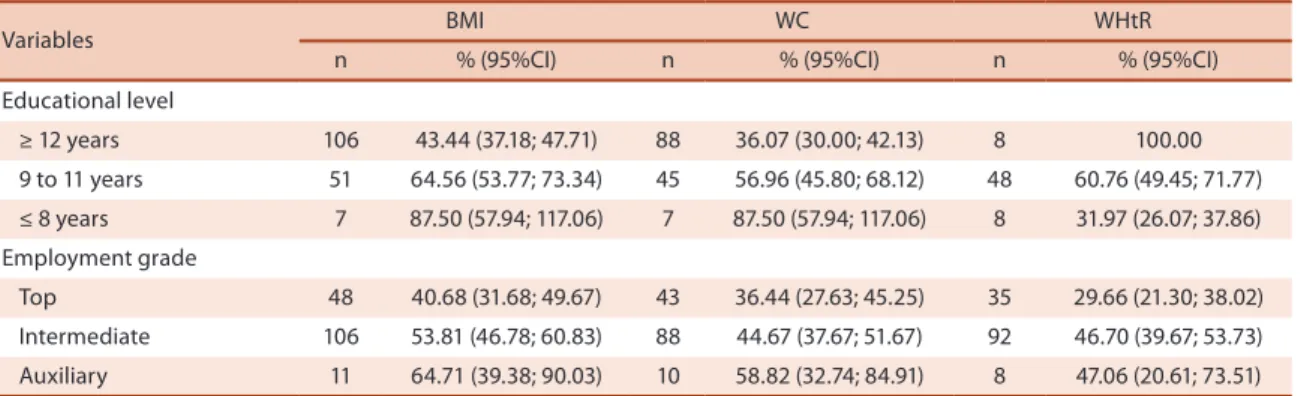
Women who were married (95%CI=46.54; 61.33) or separated/widowed (95%CI=46.63; 73.37) had higher prevalence for excess weight than single women (95%CI=26.72; 46.01). Women who had spent eight to 12 years in ed-ucation (BMI: 95%CI=53.77; 73.34; WC: 95%CI=45.80; 68.12) or fewer than 8 years in education (BMI: 95%CI=57.94; 117.06; WC: 95%CI=57.94; 117.06) had higher prevalence rates of excess weight and abdominal obesity than women who had spent more than 12 years in education (BMI: 95%CI=37.18; 47.71; WC: 95%CI=30.00; 42.13). When prevalence of abdominal obesity was classiied according to WHtR, women who had spent more than 12 years in education had a higher prevalence rate than women with eight to 12 years’ education (95%CI=49.45; 71.77) and women with fewer than 8 years’ education (95%CI=26.07; 37.86). Women who had sent eight to 12 years in education had a higher prevalence of obesity than those who had spent fewer than 8 years in education (Table 3).
When analyzed by employment grade, women employed at the inter-mediate grade (95%CI=39.67; 53.73) had a higher prevalence of abdominal obesity measured by WHtR than women at the top grade (95%CI=21.30; 38.02) (Table 3).
Table 4 lists variables and their associations with excess weight and abdominal obesity. For men, age was the only indicator associated with BMI and WHtR in the hierarchical adjusted analysis. Men aged 40-49 had a 2.15 times greater probability of having excess weight than 20-29-year-old men. he probability of excess weight was 1.95 and 1.97 times greater in the 50-59 and 60-69 age groups, respectively, in relation to the 20-29 age group. For abdominal obesity identiied by WHtR, the prevalence rates for 40-49 years (PR=2.62, 95%CI=1.28; 5.36), 50-59 years (PR=2.76, 95%CI=1.37; 5.62) and 60-69 years (PR=3.14, 95%CI=1.51; 6.50) were higher than the prevalence for the 20-29 age group.
Table 3. Prevalence of excess weight and abdominal obesity among male and female technical and administrative staf at UFSC, by sociodemographic factors. Brazil, 2012.
Variables BMI WC WHtR
n % (95%CI) n % (95%CI) n % (95%CI)
Men
Age (years)
20-29 8 33.33 (13.00; 53.67) 5 20.83 (3.31; 38.35) 6 25.00 (6.32; 43.68)
30-39 25 59.52 (44.04; 75.01) 8 19.05 (6.67; 31.43) 19 45.24 (9.54; 60.94)
40-49 56 71.79 (61.58; 82.01) 31 39.74 (28.64; 50.85) 51 65.38 (54.59; 76.18)
50-59 76 65.52 (56.74; 74.30) 44 37.93 (28.97; 46.89) 81 69.83 (61.35; 78.31)
60-69 15 65.21 (44.16; 86.28) 7 30.43(10.08; 50.78) 18 78.26 (60.02; 96.50)
Skin color
White (Branca) 153 63.49 (57.36; 69.61) 81 33.61 (27.60; 39.62) 147 61.00 (54.79; 67.20)
Black (Negra) 8 66.67 (35.38; 97.95) 4 33.33 (2.05; 64.62) 8 62.96 (43.49; 82.43)
B/Y/I* 16 59.26 (39.45; 79.07) 9 33.33 (14.33; 52.34) 17 66.67 (35.38; 97.95)
Marital status
Single 32 55.17 (41.98; 68.36) 20 34.48 (21.88; 47.09) 32 55.17 (41.98; 68.36)
Married 125 65.79 (58.98; 72.60) 63 33.16 (26.40; 39.91) 121 63.68 (56.78; 70.58)
Separated/Widowed 23 65.71 (49.17; 82.26) 12 34.28 (17.74; 50.83) 22 62.85 (46.02; 79.70)
Socioeconomic level
Low 36 63.16 (50.24; 76.07) 22 38.60 (25.56; 51.63) 34 59.65 (46.52; 72.78)
Intermediate 109 60.56 (53.35; 67.76) 54 30.00 (23.24; 36.76) 105 58.33 (51.06; 65.60)
High 35 76.09 (63.28; 88.89) 19 41.30 (26.52; 56.09) 36 78.26 (65.88; 90.65)
Educational level
≥ 12 years 116 62.70 (55.67; 69.74) 58 31.35 (24.60; 38.10) 107 57.84 (50.66; 65.02)
9 to 11 years 45 65.22 (53.29; 76.74) 28 40.58 (28.70; 52.46) 47 68.12 (56.83; 79.39)
≤ 8 years 18 64.29 (45.36; 83.21) 8 28.57 (10.73; 46.41) 20 71.43 (53.59; 89.27)
Employment grade
Top 50 60.24 (49.49; 70.99) 25 30.12 (20.04; 40.20) 49 59.04 (48.23; 69.84)
Intermediate 113 63.84 (56.69; 70.99) 61 34.46 (27.39; 41.53) 108 61.02 (53.76; 68.27)
Auxiliary 17 73.91 (54.50; 93.33) 9 39.13 (17.55; 60.71) 18 78.26 (60.02; 96.50)
Women
Age (years)
20 – 29 11 26.19 (12.32; 40.06) 8 19.05 (6.66; 31.43) 7 16.67 (4.91; 28.42)
30 – 39 29 38.16 (26.98; 49.33) 20 26.32 (16.19; 36.45) 19 25.00 (15.04; 34.96)
40 – 49 51 54.26 (44.00; 64.51) 44 46.80 (36.53; 57.08) 41 43.62 (33.41; 53.83)
50 – 59 62 59.05 (49.49; 68.61) 57 54.29 (44.60; 63.97) 56 53.33 (43.63; 63.03)
60 – 69 12 80.00 (57.07; 102.93) 12 80.00 (57.07; 102.92) 12 80.00 (57.07; 102.93)
Skin color
White (Branca) 146 49.49 (43.75; 55.23) 125 42.37 (36.70; 48.04) 119 40.34 (34.71; 45.97)
Black (Negra) 11 52.38 (29.09; 75.68) 9 42.86 (19.77; 65.94) 9 42.86 (19.77; 65.94)
B/Y/I* 7 63.64 (29.74; 97.53) 5 45.45 (10.37; 80.54) 5 45.45 (10.37; 80.54)
Marital status
Single 36 36.36 (26.72; 46.01) 35 35.35 (25.77; 44.94) 33 33.33 (23.88; 42.78)
Married 96 53.93 (46.54; 61.33) 81 45.51 (38.12; 52.89) 77 43.26 (35.91; 50.61)
Separated/Widowed 33 60.00 (46.63; 73.37) 25 45.45 (31.87; 59.04) 25 45.45 (31.87; 59.04)
Socioeconomic level
Low 26 42.62 (29.85; 55.39) 21 34.42 (22.16; 46.70 ) 20 32.79 (20.66; 44.91)
Intermediate 112 50.00 (43.40; 56.60) 99 44.20 (37.64; 50.75) 93 41.52 (35.02; 48.02)
High 27 57.45 (42.77; 72.12) 21 44.68 (29.93; 59.44) 22 46.81 (31.32; 61.62)
fewer years in education having excess weight was 0.67 times the prob-ability that women who had spent 12 years or more in education would have excess weight (Table 4).
Only age and educational level remained associated with female WC. he prevalence rates of abdominal obesity for the 40-49 (PR=2.55, 95%CI=1.31; 4.94), 50-59 (PR=2.86, 95%CI=1.49; 5.47) and 60-69 age groups (PR=4.21, 95%CI=2.15; 8.29) were all higher than for with women aged 20–29 years. he probability of abdominal obesity was lower (PR=0.62, 95%CI=0.44; 0.90) for women with 8 or fewer years’ education (Table 4).
Ater hierarchical adjustment, women aged 40-49 years, 50-59 years and 60-69 years respectively had 2.68, 3.19 and 4.80 times greater prob-ability of abdominal obesity according to WHtR than women aged 20-29 years. Women with 8 or fewer years’ education had a lower probability (PR=0.49, 95%CI=0.39; 0.64) of abdominal obesity than those who had spent 12 years or more in education (Table 4).
Variables BMI WC WHtR
n % (95%CI) n % (95%CI) n % (95%CI)
Educational level
≥ 12 years 106 43.44 (37.18; 47.71) 88 36.07 (30.00; 42.13) 8 100.00
9 to 11 years 51 64.56 (53.77; 73.34) 45 56.96 (45.80; 68.12) 48 60.76 (49.45; 71.77)
≤ 8 years 7 87.50 (57.94; 117.06) 7 87.50 (57.94; 117.06) 8 31.97 (26.07; 37.86)
Employment grade
Top 48 40.68 (31.68; 49.67) 43 36.44 (27.63; 45.25) 35 29.66 (21.30; 38.02)
Intermediate 106 53.81 (46.78; 60.83) 88 44.67 (37.67; 51.67) 92 46.70 (39.67; 53.73)
Auxiliary 11 64.71 (39.38; 90.03) 10 58.82 (32.74; 84.91) 8 47.06 (20.61; 73.51)
BMI: body mass index, WC: waist circumference, WHtR: waist to height ratio, %: prevalence; *B/Y/I: brown/yellow/indigenous (parda/amarela/indigena); 95%CI: 95% conidence interval. Figures in bold indicate signiicant diferences in prevalence rates.
Table 4. Prevalence ratios and conidence intervals after analysis adjusted by hierarchical levels, for indicators of excess weight and abdominal obesity and sociodemographic variables for male and female technical and administrative staf at UFSC, Brazil, 2012.
Variables BMI WC WHtR
PR (95%CI) p PR (95%CI) p PR (95%CI) p
Men
Age (years)1
20-29 1 1 1
30-39 1.76 (0.94; 3.27) 0.074 0.82 (0.29; 2.28) 0.703 1.76 (0.81; 3.81) 0.155
40-49 2.15 (1.20; 3.85) 0.010 1.92 (0.84; 4.41) 0.122 2.62 (1.28; 5.36) 0.008
50-59 1.95 (1.09; 3.49) 0.024 1.86 (0.83; 4.20) 0.135 2.76 (1.37; 5.62) 0.005
60-69 1.97 (1.04; 3.74) 0.037 1.47 (0.54; 3.99) 0.447 3.14 (1.51; 6.50) 0.002
Skin color 1
White (Branca) 1 1 1
Black (Negra) 0.98 (0.64; 1.48) 0.910 0.88 (0.38; 2.02) 0.763 0.86 (0.64; 1.45) 0.856
B/Y/I* 0.94 (0.69; 1.29) 0.708 1.03 (0.59; 1.82) 0.916 1.01 (0.76; 1.36) 0.924
Marital status2
Single 1 1 1
Married 1.08 (0.84; 1.40) 0.520 0.78 (0.51; 1.19) 0.253 0.97 (0.75; 1.25) 0.813
Separated/Widowed 1.05 (0.75; 1.48) 0.782 0.75 (0.41; 1.36) 0.342 0.88 (0.63; 1.24) 0.471
... continued
DISCUSSION
he results of this study have revealed elevated prevalence rates of excess weight and abdominal obesity among the workers investigated. here were associations between excess weight and abdominal obesity measured by
Variables BMI WC WHtR
PR (95%CI) p PR (95%CI) p PR (95%CI) p
Education2
≥ 12 years 1 1 1
9 to 11 years 1.01 (0.72; 1.41) 0.946 1.52 (0.79; 2.90) 0.204 1.05 (0.79; 1.39) 0.748
≤ 8 years 1.05 (0.77; 1.43) 0.767 1.28 (0.69; 2.41) 0.424 0.99 (0.76; 1.29) 0.933
Socioeconomic level3
Low 1 1 1
Intermediate 0.82 (0.66; 1.20) 0.250 0.76 (0.49; 1.19) 0.227 0.85 (0.69; 1.05) 0.127
High 0.85 (0.63; 1.46) 0.143 1.04 (0.57; 1.90) 0.890 0.89 (0.66; 1.20) 0.452
Employment grade3
Top 1 1 1
Intermediate 1.03 (0.82; 1.29) 0.516 1.14 (0.72; 1.80) 0.671 1.01 (0.81; 1.26) 0.930
Auxiliary 1.04 (0.74; 1.47) 0.923 1.19 (0.54; 2.61) 0.582 1.17 (0.85; 1.63) 0.337
Women
Age (years) 1
20-29 1 1 1
30-39 1.45 (0.81; 2.60) 0.209 1.39 (0.67; 2.88) 0.376 1.50 (0.69; 3.29) 0.306
40-49 2.11 (1.23; 3.63) 0.007 2.55 (1.31; 4.94) 0.006 2.68 (1.31; 5.71) 0.007
50-59 2.28 (1.34; 3.88) 0.002 2.86 (1.49; 5.47) 0.002 3.19 (1.58; 6.44) 0.001
60-69 3.02 (1.71; 5.34) <0.001 4.21 (2.15; 8.29) <0.001 4.80 (2.33; 9.92) <0.001
Skin color1
White (Branca) 1 1 1
Black (Negra) 0.96 (0.63; 1.46) 0.535 0.93 (0.48; 1.82) 0.851 0.99 (0.51; 1.94) 0.977
B/Y/I* 1.16 (0.73; 1.82) 0.841 0.90 (0.54; 1.49) 0.670 0.94 (0.56; 1.57) 0.816
Marital status2
Single 1 1 1
Married 1.32 (0.97; 1.79) 0.073 1.08 (0.80; 1.48) 0.610 1.07 (0.79; 1.45) 0.677
Separated/Widowed 1.29 (0.90; 1.84) 0.169 0.86 (0.58; 1.48) 0.449 0.89 (0.59; 1.33) 0.557
Education2
≥ 12 years 1 1 1
9 to 11 years 0.87 (0.63; 1.21) 0.403 0.81 (0.56; 1.15) 0.240 0.77 (0.62; 0.96) 0.021
≤ 8 years 0.67 (0.49; 0.94) 0.019 0.62 (0.44; 0.90) 0.010 0.49 (0.39; 0.64) <0.001
Socioeconomic level3
Low 1 1 1
Intermediate 0.85 (0.65; 1.12) 0.075 1.07 (0.77; 1.47) 0.695 0.97 (0.72; 1.32) 0.862
High 0.74 (0.50; 1.11) 0.282 0.88 (0.56; 1.39) 0.584 0.90 (0.57; 1.41) 0.640
Employment grade3
Top 1 1 1
Intermediate 1.10 (0.83; 1.46) 0.792 0.95 (0.69; 1.32) 0.764 1.16 (0.82; 1.64) 0.394
Auxiliary 1.02 (0.63; 1.65) 0.828 0.99 (0.55; 1.79) 0.968 0.89 (0.45; 1.76) 0.746
BMI: body mass index; WC: waist circumference, WHtR: waist to height ratio; *B/Y/I: brown/yellow/indigenous (parda/amarela/indígena); PR: prevalence ratio; 95%CI: 95% conidence interval.1: distal level;2: intermediate level;3: proximal level.
WHtR and age for both men and women, and associations with educational level for women. Abdominal obesity diagnosed using WC was associated with age and educational level among the women only.
he excess weight prevalence rates were 63.60% for men and 49.70% for women, which are higher than the VIGITEL survey found for Brazil (52.1.5% and 44.3%) and also lower than VIGITEL igures for the city Florianópolis (54.2% e 38.9%), in which UFSC is located3. In other words, the UFSC staf are a population subset with at greater health risk than the population of Florianópolis. he 1999 Pró-Saúde survey investigated staf at a university in Rio de Janeiro, Brazil, inding that 59.7% of male staf
and 48.6% of female sex had excess weight6. However, the time that has
passed between the Pró-Saúde survey and this study should be borne in mind, since national Brazilian surveys3 have shown that the prevalence of overweight and obesity is increasing among both men and women in Brazil.
Abdominal obesity was detected in 33.57% of men using WC and 61.84% using WHtR and in 42.47% of women using WC and 40.66% ac-cording to WHtR. he epidemiological study EpiFloripa was also conducted in Florianópolis and found lower prevalence rates of abdominal obesity for both sexes, whether diagnosed by WC (11.6% of men and 19.7% of
women) or by WHtR (50.5% of men and 38.9% of women)13. However,
the EpiFloripa study used higher cutof points for diagnosing abdominal obesity by WC (88 cm to 102 cm) than were used in the study reported here (80 cm to 94 cm), which reduces the prevalence of abdominal obesity detected by this indicator.
he prevalence rates of excess weight and abdominal obesity observed here are lower than igures for adults in some other countries. In Puerto Rico the proportions of men and women with excess weight were 78.4% and 79.3%21, in Kuwait they were 77.3% and 77.4%22 and in the United States
72.3% of men and 64.1% of women had excess weight23. Prevalence rates
of abdominal obesity diagnosed by WC were 37.6% and 54.4% in Puerto Rico21, 36.2% and 79.9% in Iran and 57.0% and 56.6% in Australia24, for men and women, respectively. Using WHtR, 83.7% of men and 78.5% of
women in Puerto Rico21 were diagnosed with abdominal obesity.
here were diferences between the sexes in prevalence rates of excess weight and of abdominal obesity diagnosed by WHtR, with a higher propor-tion of men at risk according to these indicators.hese data are similar to what has been observed inmetropolitan Belém, PA, Brazil25, by the national VIGITEL survey3 and in the United States23, where men also had a higher prevalence rate of excess weight than women. When sexes are compared for overweight and obesity according to BMI, studies report higher prevalence rates of overweight among men3,21,22 and of obesity among women21,22. Not-withstanding, irrespective of the categorization employed, many studies have failed to identify diferences between the sexes in terms of the prevalence rates of overweight, obesity or excess weight, when identiied using BMI3,11,12.
should be a cause of concern for departments responsible for employee health, considering the major impact these risk factors can have on people’s health. Excess weight and central accumulation of body fat are associated
with metabolic and cardiovascular disorders21, among other diseases,
and are linked with mortality8. Cardiovascular disease is the number one obesity-related cause of death in the adult population8.
Men aged 40-49, 50-59 or 60-69 years had a greater probability of excess weight, and of abdominal obesity according to WHtR, than 20-29-year-old men. Among the women, the proportion of excess weight and abdominal obesity increased from 40-49 years through 60-69 years, according to all three indicators analyzed. he increase in prevalence rates of excess weight and abdominal obesity as age increases is well-documented in the literature and has been observed in several Brazilian cities as well as in international studies3,12,13,22,25.
For men, the probability of excess weight did not increase through all age groups, but dropped of in the 50-59 age group and then increased once more in the 60-69 group. A study conducted in Salvador, BA, Brazil, reported similar indings, since the probability of excess weight among men reduced in the 40-49 years age group and increased in the 50-59 group and WC was not linked with age among men12. In contrast, a study conducted in 2009 in Florianópolis, SC, Brazil, found that abdominal obesity measured using WC was associated with age in both sexes13.
From the point at which people reach adulthood onwards, metabolic
abnormalities caused by aging lead to many changes to the body26. Body
mass tends to increase, as does waist circumference and total body fat, up to more or less the age of 60. Notwithstanding, the increases in total body fat and the accumulation of fat in speciic parts of the body can be detected even in the absence of increase in body mass27.
Women with lower educational level had a lower probability of excess weight and of abdominal obesity, according to BMI, WC and WHtR, when compared with women who had spent longer in education. his result is in contrast with the indings of a study in the city of Florianópolis, SC, Brazil, which found lower prevalence of abdominal obesity according to WHtR
among women with higher educational levels13. Other studies have also
found an increased probability of overweight, obesity6,22 and abdominal
obesity according to WC28,29, among women with lower educational levels. As can be seen in the literature, it is generally expected that prevalence rates of excess weight and abdominal obesity will be lower among people with higher levels of education, on the basis that it is assumed that they
know more about the importance of healthy habits30. However, since the
sample studied here is a population of workers, it can be hypothesized that lower levels of education are relected in occupations that demand greater physical efort. In Belo Horizonte, MG, Brazil, women whose work involved intense physical activities had lower prevalence of abdominal obesity29.
analyzed. Another possible limitation is the cross-sectional design which does not allow for the establishment of causal relationships between excess weight and abdominal obesity and the sociodemographic variables investigated.
Among the study’s strong points are the high number of staf members assessed and the fact that employees at all grades took part, which meant that workers who have diferent occupations and perform diferent tasks were included in the sample. Additionally, the anthropometric measure-ment was rigorously standardized and examiners were duly trained in advance to take measurements correctly. Furthermore, as recommended in the literature, more than one anthropometric indicator was used to identify excess weight and abdominal obesity and it was shown that dif-ferent factors are associated with each outcome.
CONCLUSIONS
here were elevated prevalence rates of excess weight and abdominal obesity among technical and administrative staf at UFSC and rates were higher for men than for women according to BMI and WHtR. Approximately 64 and 62 men in every 100 had unhealthy BMI and WHtR, respectively. Fur-thermore, diferent sociodemographic factors were associated with excess weight and abdominal obesity depending on sex and the anthropometric indicator analyzed.
hese results identify a need for interventions to prevent and treat excess weight and abdominal obesity speciically targeted at UFSC staf, since they are a population subset with greater exposure to health risk fac-tors than the adult population of the city in which the university is located. Many non-transmissible chronic diseases are associated with unhealthy body composition. Interventions should pay special attention to both men and women over 40 and to women with higher educational levels.
REFERENCES
1. World Health Organization (WHO). Obesity: preventing and managing the global epidemic. Report of a WHO consultation. Technical Report Series, No 894. 2000.
2. Wyatt SB, Winters KP, Dubbert PM. Overweight and obesity: prevalence, consequences, and causes of a growing public health problem. Am J Med Sci 2006;331(4):166-74.
3. Brasil. Ministério da Saúde. Secretaria de Vigilância em Saúde. Secretaria de Gestão Estratégica e Participativa. Vigitel Brasil 2010: vigilância de fatores de risco e proteção para doenças crônicas por inquérito telefônico. Brasília: Ministério da Saúde; 2011.
4. Low S, Chin MC, Deurenberg-Yap M. Review on epidemic of obesity. Ann Acad Med Singapore 2009;38(1):57-9.
5. Devine CM, Nelson JA, Chin N, Dozier A, Fernandez ID. “Pizza is cheaper than salad”: assessing workers’ views for an environmental food intervention. Obesity (Silver Spring) 2007;15(1):57S-68S.
7. Alves VV, Ribeiro LFP, Barros R, Gadelha SR, Santos SC. Circunferências medi-das em diferentes locais do tronco e fatores de risco cardiometabólico. Rev Bras Cineantropom Desempenho Hum 2011;13(4):250-6.
8. World Health Organization (WHO). Waist Circumference and Waist–Hip Ratio. Report of a WHO Expert Consultation. Geneva; 2008.
9. Adams KF, Schatzkin A, Harris TB, Kipnis V, Mouw T, Ballard-Barbash R, et al. Overweight, obesity, and mortality in a large prospective cohort of persons 50 to 71 years old. N Engl J Med 2006;355(8):763-78.
10. Word Health Organization (WHO). he challenge of obesity in the WHO European Region and the strategies for response; 2007.
11. Olinto MTA, Nácul LC, Dias-da-Costa JS, Gigante DP, Menezes AMB, Macedo S. Níveis de intervenção para obesidade abdominal: prevalência e fatores associados. Cad Saude Publica 2006;22(6):1207-15.
12. Oliveira LPM, Assis AMO, Silva MCM, Santana MLP, Santos NS, Pinheiro SMC, et al. Fatores associados a excesso de peso e concentração de gordura abdominal em adultos na cidade de Salvador, Bahia, Brasil. Cad Saude Publica 2009;25(3):570-82.
13. Sousa TF, Nahas MV, Silva DAS, Del Duca GF, Peres MA. Fatores associados à obesidade central em adultos de Florianópolis, Santa Catarina: estudo de base populacional. Rev Bras Epidemiol 2011;14(2):296-309.
14. Li WC, Chen IC, Chang YC, Loke SS, Wang SH, Hsiao KY. Waist-to-height ratio, waist circumference, and body mass index as indices of cardiometabolic risk among 36,642 Taiwanese adults. Eur J Nutr 2011;52(1):57-65.
15. Pederson D, Gore C. Erro em medição antropométrica. In: Norton K, Olds T, edi-tors. Anthropométrica: um livro sobre medidas corporais par ao esporte e cursos da área da saúde. Porto Alegre: Artimed Editora; 2005. p. 39-87.
16. Silva DAS, Pelegrini A, Pires-Neto CS, Vieira MFS, Petroski EL. O antropometrista na busca de dados mais coniáveis Rev Bras Cineantropom Desempenho Hum 2011, 13(1):82-85
17. Marfell-Jones M, Olds T, Stewart A, Carter L. International standards for anthro-pometric assessment. he International Society for the Advancement of Kinan-thropometry. Potchefstroom. South Africa. 2006.
18. Ashwell M, Hsieh SD. Six reasons why the waist-to-height ratio is a rapid and efec-tive global indicator for health risks of obesity and how its use could simplify the international public health message on obesity. Int J Food Sci Nutr 2005;56(5):303-7.
19. Instituto Brasileira de Geograia e Estatística (IBGE). Características étnico-raciais da população. Um estudo das categorias de classiicação de cor ou raça. 2011. Avali-able from: <http://www.ibge.gov.br/home/estatistica/populacao/caracteristicas_ raciais/PCERP2008.pdf> [2012 march 16].
20. Associação Brasileira de Empresas de Pesquisa (ABEP). Critérios de Classiicação Econômica Brasil. 2010. Avaliable from: <http://iestrategy.com/main/wp-content/ uploads/2010/02/CCEB.pdf> [2010 jun 31].
21. Palacios C, Perez CM, Guzman M, Ortiz AP, Ayala A, Suarez E. Association between adiposity indices and cardiometabolic risk factors among adults living in Puerto Rico. Public Health Nutr 2011;14(10):1714-23.
22. Ahmed F, Waslien C, Al-Sumaie MA, Prakash P. Secular trends and risk factors of overweight and obesity among Kuwaiti adults: National Nutrition Surveillance System data from 1998 to 2009. Public Health Nutr 2012; 15(11):2124-30.
23. Flegal KM, Carroll MD, Ogden CL, Curtin LR. Prevalence and trends in obesity among US adults, 1999-2008. JAMA Intern Med 2010;303(3):235-41.
24. Rostambeigi N, Shaw JE, Atkins RC, Ghanbarian A, Cameron AJ, Forbes A, et al. Waist circumference has heterogeneous impact on development of diabetes in diferent populations: longitudinal comparative study between Australia and Iran. Diabetes Res Clin Pract 2010;88(1):117-24.
Corresponding author
Juliane Berria.
Universidade Federal de Santa Catarina. Centro de Desportos. Núcleo de Pesquisa em Cineantropometria e Desempenho Humano. Campus Universitário Trindade – Caixa postal 476 – CEP 88040-900. Florianópolis, Santa Catarina, Brasil.
E-mail: julianeberria@gmail.com
26. St-Onge MP, Gallagher D. Body composition changes with aging: the cause or the result of alterations in metabolic rate and macronutrient oxidation? Nutrition 2010;26(2):152-5.
27. Kuk JL, Saunders TJ, Davidson LE, Ross R. Age-related changes in total and regional fat distribution. Ageing Res Rev 2009;8(4):339-48.
28. Olinto MTA, Costa JSD, Kac G, Pattussi MP. Epidemiologia da obesidade ab-dominal em mulheres adultas residentes no sul do Brasil. Arch Latinoam Nutr 2007;57(4):349-56.
29. Oliveira EO, Velásquez-Meléndez G, Kac G. Fatores demográicos e comporta-mentais associados à obesidade abdominal em usuárias de centro de saúde de Belo Horizonte, Minas Gerais, Brasil. Rev Nutr 2007;20(4):361-9.