* Laboratório de Pesquisa em Fisiologia do Exercício. Curso de Educação Física, Universidade Estácio de Sá, Campus Rebouças, Rio de Janeiro, Brasil.
Received in 2/9/05. Final version received in 31/7/06. Approved in 22/8/06.
Correspondence to: Prof. Edil Luis Santos, D.Sc., Laboratório de Pesquisa em Fisiologia do Exercício, Universidade Estácio de Sá, Rua do Bispo, 83, Rio Comprido – 20261-060 – Rio de Janeiro, RJ. Tel.: 55 (21) 2503-7094, fax: 55 (21) 2503-7090. E-mail: [email protected]
Prediction model of a maximal repetition (1RM) based
on male and female anthropometrical characteristics
*
Wollner Materko, Carlos Eduardo Brasil Neves and Edil Luis Santos
O
RIGINALA
RTICLEKeywords: Strength training. Muscular strength. Exercise. Prediction equation. ENGLISH VERSION
ABSTRACT
The goal of the present study was to develop an equation for predicting the workload of one maximal repetition (1RM) in wom-en and mwom-en, based exclusively on anthropometrical characteris-tics. Forty-four low-risk and experienced in strength training young subjects, being 22 male (23 ± 4 years, 76.6 ± 12.7 kg, 173.9 ± 5.5 cm, 11 ± 4.5% of body fat) and 22 female (22 ± 4 years, 54 ± 6.0 kg, 161 ± 5.8 cm, 18 ± 2.2% of body fat) volunteered for this study. All subjects were submitted to an anthropometrical evaluation fol-lowed by a 1RM familiarization test (shoulder press), which was repeated after 48 h. The repeatability was tested using Wilcoxon Matched paired test. Finally, the 1RM workload was modeled in relation to the anthropometrical variables through multiple linear regression (forward stepwise) using as cutoff criteria for the inde-pendent variables ∆r2 < 0.01. The models reliability was expressed by the Bland and Altman analysis. All tests assumed α = 0.05. No significant differences were recorded between the two tests, re-sulting 44.6 ± 13.2 kg and 12.2 ± 3.2 kg, for male (MS) and female (FS) subjects respectively. The time of practice in strength training was also included in the models. The model resulted in 84% of explained variance and a standard error of 12% for the MS. On the other hand, for the FS the predictive capacity was weaker than for = the MS, resulting in 56% of the explained variance and a stan-dard error of 20%. In conclusion, the obtained models showed acceptable reliability so that they can be currently used as a tool for predicting the 1RM workload.
INTRODUCTION
The one maximal repetition test (1RM) is frequently used as measurement of muscular strength in physical preparation, sports training, physical rehabilitation or simply in the scientific research viewpoint. Within this context, it is a consensus that the ground-ing for the exercise prescription in counter-resistance trainground-ing (CRT) is established through the relation between the 1RM percentage and the number of repetitions(1). On the other hand, previous
stud-ies have shown that several factors – such as: physical condition-ing level(2); muscular group(3); sleep routine(4); diet(5);
chronobiologi-cal rhythm(6); motivation(7); menstrual cycle(8) and muscular fatigue(9)
– effectively interfere in such relation, resulting in distinct intensi-ties for a given number of repetitions.
In addition, long time required for the performance of a 1RM test, muscular discomfort(10), as well as possible risks of injury(11),
have determined the development of more simple and less injury-prone methods which are still capable of accurately estimating the maximal strength. Thus, with the purpose to predict the maximal
strength without maximal physical and emotional stress, several studies have used the validation of submaximal tests based on the maximal number of repetitions for each workload(12-13); on the 1RM
percentage(4,15); on the maximal workload for a given number of
repetitions(16-20), or simply on anthropometric characteristics such
as height, segmental area, muscular area(21-26), or body mass(10,27).
Conversely, although the literature is rich in work involving the 1RM estimate, few studies have focused on anthropometric character-istics of the Brazilian population. Therefore, the aim of the present study was to develop a model for predicting the 1RM workload exclusively based on male and female anthropometric characteris-tics.
METHODS
Experimental procedures
Forty-four volunteers (22 male and 22 female) randomly select-ed in a health club of Rio de Janeiro participatselect-ed in this study. The inclusion criteria considered were: that the volunteers had at least six months of experience in CRT; that they did not use any ergo-genic device and that they did not present any previous osteomio-articular injury. These were considered low risk individuals since they presented up to a risk factor for arterial coronary disease and did not present any sign or symptom suggestive of cardiopulmo-nary or metabolic disease.
All volunteers were previously instructed not to perform physi-cal exercise in the 24 h prior to the tests, not to ingest alcoholic beverages and to remain hydrated throughout the tests. The ex-perimental procedures took place only after the verbal consent and the signature of the free and clarified form, according to the Re-search Ethics Committee of the Estácio de Sá University. The vol-unteers were initially submitted to an anthropometric evaluation followed by a familiarization 1RM test(28), and in a 48 h minimum
interval, 1RM retest was performed. All 1RM tests were performed between 5:00 and 7:00 p.m.
Anthropometric evaluation
It consisted of body mass (BM) and height measurement (H), performed with a mechanical scale with stadiometers (Filizola, Bra-zil). For the calculation of the area of the transversal section of the segment, it was necessary to measure the circumference of the right arm relaxed (AC) as a standard using an anthropometric tape (Sanny, Brazil), as well as the skinfold (S) of the brachial triceps with scientific dividers (Cescorf, Brazil). From these measurements, the fat percentage (F) and the fat-free mass (FFM) were calculated using the Jackson and Pollock equations(29), Jackson et al.(30) for
the estimation of the body density on men and women, respec-tively, combined with the Siri’s equation(31).
From the SC measurement, the arm transversal area section was calculated (As):
As = SC
2
(1)
Thus, the muscular area (Ma) was calculated in relation to the As and the tricipital D:
Ma = π .
(
SC – CD
)
2 (2)2 π 2
and finally the fat area (Fa) was calculated by the difference be-tween As and Ma:
Fa = As – Ma (3)
1RM test protocol
The development exercise on the machine was selected due to its multi-articular nature, besides offering low injury risk. Moreover, although there are several studies dealing with exercises such as supine, leg press and bench press among others, until the present study there is no register of results dealing with the 1RM work-load prediction for this kind of exercise. The test started from the initial seated position with back against the bench, flexed knees with feet on the bench, flexed elbows, abducted shoulders and bar grip relatively wider than the shoulders aligning. In the concen-tric phase, the shoulders abduction and elbows extension were simultaneously performed from the initial position, and sequential-ly, the eccentric phase consisted of the return to the initial posi-tion.
The 1RM tests were conducted according to the protocol pro-posed by Brown and Weir(28): 3-5 min of light activity which
in-volved the tested muscular group were performed; after one minute of light stretching, warming-up of eight repetitions at 50% of per-ceived 1RM, followed by three repetitions at 70% of perper-ceived 1RM. After 5 min interval, the 1RM test was performed, adding when needed, 0.4 to 5 Kg, with a total of 3 to 5 trials. The regis-tered maximal workload was that one lifted in a single movement.
Statistical treatment
The 1RM test repeatability was confirmed by the non-paramet-ric test of ordered pairs by Wilcoxon. The 1RM workload was mod-eled by multiple linear regression through quadratic error minimi-zation (forward stepwise method), using as independent variables: age; H; BM; FFM; RF; SC; SA; MA and FA, besides the experience time in strength training. A variation in the r2 smaller than 0.01, as
well as its – p value was adopted as slicing criteria of the indepen-dent variables. The regression models reliability was expressed by the estimate standard error (SEE) and studied through the method by Bland and Altman(32), in which the measured value of the 1RM
workload was applied in the horizontal axis, and the difference between the measured values and those obtained by the method in the vertical axis. In addition, 95% of the limit of agreement (LOA) was presented, being expressed as the interval between two stan-dard deviations (± 2SD). In all applied tests, α = 0,05 was adopted. All statistical procedures were performed in Matlab v6.2 (Math-works, EUA).
RESULTS
No osteomioarticular problem was registered during or immedi-ately after any test; therefore, all volunteers have reached the maximal workload in the 1RM tests in the development exercise. In table 1 the physical and anthropometric characteristics are pre-sented, as well as the experience time in CRT of the volunteers. As one can notice, except for the experience time – which varied from 6 months to 5 years – the data low dispersion points to an experimental group fairly homogeneous.
In table 2 the 1RM workloads and the number of trials obtained in the test and retest of 1RM of the volunteers are presented. Although the 1RM workload obtained in the retest is averagely higher than the one in the familiarization test, no significant differ-ences were registered, which led to a high correlation between
the tests (SM, r = 0.99; SF, r = 0.94). Thus, the results of the familiarization test were discarded, being the second measurement (retest) adopted as reference for independent variable in the pre-diction of the 1RM workload.
Table 3 presents the coefficients of partial correlation between the anthropometric variables (independent) and the 1RM workload (dependent variable). The experience in CRT resulted in 31% of the variance explained of the 1RM workload. Moreover, the an-thropometric variables presented the highest correlations with the 1RM workload in the SM. The BM contributed with 28% (p = 0.01) and the FFM with 31% (p < 0.01); nonetheless, the highest correlations were obtained by the SC and the AS (r2 = 0.73, p <
0.01). In the SF, the correlations were lower, reaching determina-tion coefficients of 0.23 (age) and 0.18 FFM (p < 0.05).
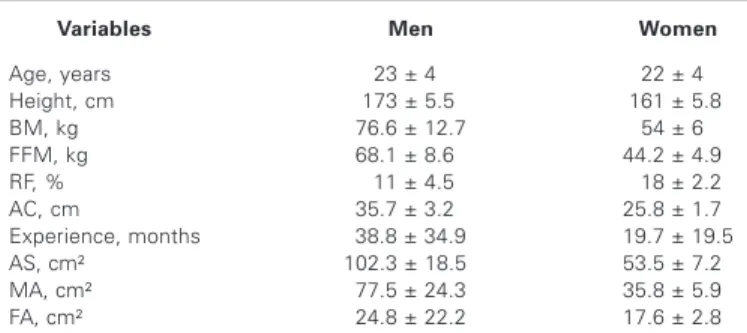
TABLE 1
Physical and anthropometric characteristics of the volunteers
Variables Men Women
Age, years 23 ± 40 22 ± 40
Height, cm ,173 ± 5.50 ,161 ± 5.80
BM, kg 76.6 ± 12.7 54 ± 60
FFM, kg 68.1 ± 8.60 44.2 ± 4.90
RF, % ,11 ± 4.5 ,18 ± 2.2
AC, cm 35.7 ± 3.20 25.8 ± 1.70
Experience, months 38.8 ± 34.9 19.7 ± 19.5
AS, cm² 102.3 ± 18.50 53.5 ± 7.20
MA, cm² 77.5 ± 24.3 35.8 ± 5.90
FA, cm² 24.8 ± 22.2 17.6 ± 2.80
Where BM represents body mass; FFM fat-free mass; RF relative fat; AC relaxed arm circumfer-ence; Experience experience time in counter-resistance training; AS arm segmental area; MA arm muscular area; and FA arm fat area.
TABLE 2
Performance in the 1RM tests in the development exercise of men and women
Sex Male Female
1RM Test, kg 43.2 ± 13.4 11.6 ± 3.1
1RM Retest, kg 44.7 ± 13.1 12.2 ± 3.2
Ntrial test 4.7 ± 0.6 0,04 ± 0.8 Ntrial retest ,03 ± 1.2 02.6 ± 0.9
Where Ntrial test is the number of trials in the test and Ntrial retest is the number of trials in the
retest.
TABLE 3
Determination coefficient and the significance level between the anthropometric variables and performance
in the 1RM test in the development exercise
Variables Men Women
R2 Value-p R2 Value-p
Age 0.01 0.569 0.23 0.023
Height 0.09 0.158 0.09 0.173
Weight 0.28 0.012 0.16 0.059
FFM 0.31 0.007 0.19 0.038
RF 0.04 0.345 0.04 0.361
AC 0.73 0.000 0.10 0.143
Experience 0.31 0.008 0.07 0.207
SA 0.73 0.000 0.10 0.134
MA 0.13 0.106 0.12 0.101
FA 0.11 0.139 0.00 0.693
Where FFM is fat-free mass; RG is relative fat; AC is arm circumference; experience is experience time in counter-resistance training; AS is segmental area; MA is muscular area and FA is fat area.
that no information is added to the prediction capacity of the mod-els. Therefore, the best model for the estimation of 1RM was giv-en to the equation which presgiv-ented the highest determination co-efficient and lowest standard error of the statistics. The models
resulted in r2 = 0.84 with error equivalent to 12% (SEE = 5.94 kg,
p < 0.001) in the SM. In the SF though, the predictive capacity of the model obtained was weaker, resulting in r2 = 0.56 and
stan-dard error of 20% (SEE = 2.52 kg, p < 0.05).
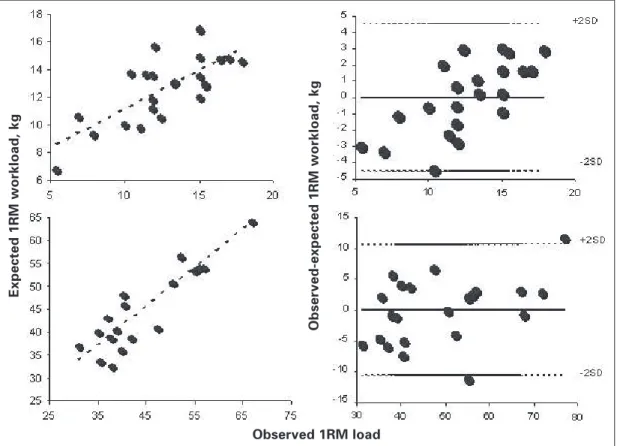
The reliability of the regression models was studied through the Bland and Altman method(32), in which the measured 1RM
work-load was applied on the horizontal axis and the difference between the measured values and those obtained by the model were ap-plied on the vertical axis. Figure 1 illustrates the ratio between the measured and expected 1RM values in both sexes, as well as the Bland and Altman analysis. The obtained models showed reliability of 95% of the limit of agreement, being expressed as the interval between two standard deviations (± 2SD). The SM model present-ed a steady error behavior, being independent from the load, de-spite having presented two volunteers outside the limit of agree-ment, that is, 9.09% of the group. The SF model presented its data within the 95% of the limit of agreement; however, the error tends to increase as the workload is increased. When observing the Bland and Altman table(32) applied to the SF (figure 1), one can
notice a tendency in workloads lighter than 12 kg, to overestimate the results, while in workloads heavier than 12 kg, the result is underestimated. Therefore, higher reliability and boldness can be given to the SM model when compared with the SF model.
DISCUSSION
The 1RM test is usually used for the evaluation of the maximal strength in a single repetition; nevertheless, massive discussion has been raised concerning its risk of injury(11), as well as its
dura-tion and intensity of muscular discomfort(10) generated from a 1RM
test. Massive previous research has proposed estimations of 1RM workload from submaximal tests, based on the maximum number TABLE 4
Determination coefficient; standard error of the estimation and the significance level of the anthropometric variables and the experience time in counter-resistance training, when added to the male and female models
Prediction equation of male 1RM r² SEE p
1RM = –13.64 + 0.60 · SA 0.73 6.99 < 0.001
1RM = –15.23 + 0.72 · SA – 0.89 · RF 0.80 6.17 < 0.001 1RM = –24.03 + 0.65 · SA – 1.26 · RF + 0.25 · BM 0.83 5.94 < 0.001 1RM = –19.82 + 0.65 · SA – 1.15 · RF + 0.27 · BM
– 0.32 · age 0.84 5.94 < 0.001
Prediction equation of female 1RM r² SEE p
1RM = 20.41 – 0.36 · age 0.23 2.89 0.023
1RM = 20.50 – 0.42 · age + 0.06 · E 0.39 2.65 0.009 1RM = 13 – 0.38 · age + 0.05 · E + 0.12 · BM 0.44 2.61 0.014 1RM = 33.56 – 0.41 · age + 0.04 · E + 0.27 · BM
– 0.17 · H 0.46 2.62 0.025
1RM = 40.92 – 0.38 · age + 0.04 · E – 0.06 · BM
– 0.24 · H + 0.49 · FFM 0.49 2.63 0.039
1RM = 82.17 – 0.42 · age + 0.03 · E + 3.5 · BM
– 0.22 · H – 3.87 · FFM – 2.32 · RF 0.56 2.52 0.031 Where E represents the experience time in counter-resistance training; BM the body mass; AS segmental area; RF relative fat; H, height and FFM fat-free mass.
Observed 1RM load
Expected 1RM workload, kg
Obser
ved-expected 1RM workload, kg
of repetitions for a given workload(12-13), on the 1RM percentage (14-15); on the maximal workload for a given number of repetitions(16-20);
on the body mass percentage(10,27); or simply on the
anthropomet-ric characteristics(20-25). The present study follows such panorama,
since few studies have been dedicated to the anthropometric char-acteristics of the Brazilian population. In our study, a 1RM work-load prediction model was developed in the exercise in develop-ment, exclusively based on the anthropometric variables and the experience on CRT.
According to the procedures pointed by the literature, all volun-teers performed a previous familiarization test. Contrary to previ-ous studies(20,33), it did not result in significant differences when
comparing test and retest, so that the repeatability of the mea-sures was guaranteed. Possibly, the experience time of at least six months in CRT has influenced in this result. In a recent study(14)
with young weightlifting athletes, the experience time was much more correlated to a 1RM than any other anthropometric variable, resulting in 49% of the explained variance. In the present study, the experience resulted in 31% of the 1 RM explained variance.
Very low correlations between the 1RM workload and anthropo-metric variables have been shown(13,21-22,24-25); consequently, the
pre-diction power of 1RM from these variables tends to be fairly weak. However, in the present study, the arm circumference and the trans-versal section area (in the SM group) resulted in 73% of the ex-plained variance, respectively. The same variables (in the SF group) obtained weaker results, contributing with 10% of the explained variance, respectively. Conversely, the MA presented low correla-tions (r = = = = = 0.35 SM and r = 0.37 SF) with the 1RM workload. Such finding clashes with a recent study(34), in which a correlation
of 0.81 between the MA and the 1RM load performed in the straight free supine exercise was found. In a very interesting study(35), such
difference was given to the large number of muscles and joints involved during the performance of the straight supine when com-pared with the exercise of the present study, which according to the same authors(35), may lead to misinterpretation of results.
The prediction models of 1RM found here were based on the variables that presented the highest partial correlation coefficients with the 1RM load. Later, polynomial models from the first to sixth order were found, that is, with 1-6 independent variables. The models results were significant, presenting an increase in the ex-planation coefficient as independent variables are added. Converse-ly, the SEE tends to stabilize, which gives the impression that no information is added to the prediction capacity of the models. The equation which presented the highest determination coefficient and the lowest standard error of the statistics was used as predic-tion model for the estimative of 1RM.
In the male individuals, the prediction model of 1RM resulted in 84% of the explained variance, with standard error equivalent to 12% (SEE = 6.06 Kg, p < 0.001). On the other hand, in the SF, the prediction capacity of the obtained model was weaker, result-ing in 56% of the explained variance (SEE = 2.61 kg, p < 0.05) and standard error equivalent to 20%. Considering that the sample group(36), the selected exercise(36), the age(37), the physical
condi-tioning level(14), among other factors may interfere in the boldness
of the model, one could expect distinct results between SF and SM. Although previous work has found error in the 1-10% order with models based on tests of 7-10RM(17-20), considering that in
this work only anthropometric measurements without any physi-cal stress were used, the results obtained show suitable consis-tency so that the models can be considered as an alternative tool for the estimation of the maximal strength. Moreover, despite of the prediction model of 1RM obtained in the SF group being more modest than that of the SM, it can be, with some reserve, taken as acceptable.
The difference in the prediction capacity in the male model in comparison with the female one was very remarkable, which can be associated with the differences in the male and female
perfor-mances(38), or with distinct types of strength training(39-40). In
addi-tion to that, men present more muscular mass(38), which tends to
result in higher absolute strength than in women(38). As seen in
table 1, the segmental and muscular areas were respectively 96.7% and 116.5% higher in men than in women. While in exercises for lower limbs such difference tends to be lower or inexistent(38-39),
anthropometric differences with magnitude similar to those found here corroborate the expectation that great differences are found in muscular strength. In a previous study(21) where the 1RM
work-load was estimated in the leg press in women using the anthropo-metric characteristics, a model explaining 67% of the variance of 1RM (SEE = 20.2 Kg) was presented, which corroborates the fact that the model is sensitive to the followed training patterns. Alter-natively, one may hypothesize that the higher experience level in men (38.9 ± 34.9 SM and 19.7 ± 19.5 SF), as well as the motiva-tion in the exercise, may have influenced in the results.
It is worth mentioning that the present study is restricted to strength measurement of upper limbs, whose extrapolation for endurance measurements, despite commonly mentioned in the literature, and deserves more detailed study, since the prediction of loads equivalent to a higher number of repetitions would imply in error propagation. Additionally, the group of volunteers is restrict-ed to young individuals with experience in CRT, so that, a priori, the obtained equations here are limited to application in groups with such characteristic.
It is explicit that the obtained models may be used as potential tools for the prediction of the 1RM workload in individuals with physical and anthropometric characteristics similar to those de-scribed here. Finally, based on the results found, it was possible to develop prediction models for 1RM workload in men and women using exclusively anthropometric variables, resulting in acceptable errors and suitable reliability.
All the authors declared there is not any potential conflict of inter-ests regarding this article.
REFERENCES
1. Morales J, Sobonya S. Use of submaximal repetition tests for predicting 1rm strength in class athletes. J Strength Cond Res. 1996;10:186-9.
2. Hoeger WWK, Hopkins DR, Barette SL, Hale DF. Relationship between repeti-tions and selected percentages of one repetition maximum: a comparison be-tween untrained and trained males and females. J Appl Sport Sci Res. 1990;4: 47-54.
3. Hoeger WWK, Barette SL, Hale DF, Hopkins DR. Relationship between repeti-tions and selected percentages of one repetition maximum. J Appl Sport Sci Res. 1987;1:11-3.
4. Maney I, Waterhouse J, Atkison G, Reily T, Vavenne D. The effect of nigh’s sleep deprivation on temperature, mood, and physical performance in subjects with different amounts of habitual physical activity. Chronobiol Int. 1998;15:349-63.
5. Leveritt M, Abernethy P, Barry B, Logan P. Effects of carbohydrate restriction on strength performance. J Strength Cond Res. 1999;28:413-27.
6. Atkison G, Reilly T. Circadian variation in sports performance. Sports Med. 1996; 36:292-312.
7. Fry MD, Fry AC. Goal perspectives and motivational responses of elite junior weightilifters. J Strength Cond Res. 1999;13:311-7.
8. Birc K, Reilly T. The diurnal rhythm in isometric muscular performance differ with eumenorrheic mestral cycle phase. Chronobiol Int. 2002;19:731-42.
9. Behm DG, St-Pierre DMM. Fatigue mechanisms in trained and untrained plantar flexors. J Strength Cond Res. 1998;12:166-71.
10. Kuramoto AK, Payne VG. Predicting muscular strength in women: a preliminary study. Res Q Exerc Sport. 1995;66:168-72.
11. Faigenbaum AD, Milliken lA, Westcott WL. Maximal strength testing in healthy children. J Strength Cond Res. 2003;17:162-6.
12. Horvat M, Ramsey V, Franklin C, Gavin C, Palumbo T, Glass LA. A method for predicting maximal strength in collegiate women athletes. J Strength Cond Res. 2003;17:324-8.
2002];30:[2 telas]. Disponível em URL: http://www.mim.edu/exss_dept/iahperd/ journal/j97s_bench.html.
14. Kravitz L, Akalan C, Nowicki K, Kinzey SJ. Prediction of 1 repetition maximum in high-school power lifters. J Strength Cond Res. 2003;17:167-72.
15. Ware JS, Clemens CT, Mayhew JL, Johnston TJ. Muscular endurance repeti-tions to predict bench press and squat strength in college football players. J Strength Cond Res. 1995;9:99-103.
16. Kim PS, Mayhew JL, Peterson DF. A modified YMCA bench press test as a predictor of 1 repetition maximal bench press strength. J Strength Cond Res. 2002; 16:440-5.
17. Abadie BR, Altorfer Gl, Schuler PR. Does a regression equation to predict max-imal strength in untrained lifters remain valid when the subjects are technique trained? J Strength Cond Res. 1999;13:259-63.
18. Knutzen KM, Brilla LR, Caine D. Validity of 1rm prediction equation for older adults. J Strength Cond Res. 1999;13:242-6.
19. Hopkins L, Cochrane J, Mayhew Jl. Prediction of arm and leg strength from the 7-10rm before and after training on nautilus machine weigths. IAHPERD Jour-nal. 1999;33:40-1.
20. Braith RW, Graves JE, Leggett SH, Pollock Ml. Effect of training on the relation-ship between maximal and submaximal strength. Med Sci Sports Exerc. 1993; 25:132-8.
21. Mayhew DL, Hafertepe M. Relationship of structural dimensions to leg press strength in trained adolescent females. IAHPERD Journal [periódico online] 1996 [citado em agosto de 2002]; 29:[2 telas]. Disponível em URL: http://www.mum. edu/exss_dept/iahperd/journal/j96s_legpress.htlm.
22. Mayhew JL, Piper FC, Ware JS. Anthropometric correlates with strength perfor-mance among resistance trained athletes. J Sports Med Phys Fitness. 1993;33: 159-65.
23. Cummings B, Finn KJ. Estimation of a one repetition maximal bench press for untrained women. J Strength Cond Res. 1998;12:262-5.
24. Scanlan JM, Ballmann KL, Mayhew JL, Lantz CD. Anthropometric dimensions to predict 1RM bench press in untrained females. J Sports Med Phys Fitness. 1999; 39:54-60.
25. Bale P, Colley E, Mayhew JL, Lantz CD. Anthropometric and somatotype vari-ables related to strength in American football players. J Sports Med Phys Fit-ness. 1994;34:383-9.
26. Mayhew JL, Jack JA, Ware JS, Chapman PP, Bemben MG, Ward TE, Slovak JP. Anthropometric dimensions do not enhance one repetition maximum prediction
from the NFL-225 test in college football players. J Strength Cond Res. 2004; 18:572-8.
27. Schell J, Ware JS, Mayhew Jl. Muscular endurance performance relative to body weight to predict 1-RM bench press in college football players. IAHPERD Jour-nal. 1999;32:30-1.
28. Brown LE, Weir JP. ASEP Procedures recommendation I: accurate assessment of muscular strength and power. J Exerc Physiol. online 2001;4:1-21.
29. Jackson AS, Pollock M. Generalized equations for predicting body density of men. Br J Nutr. 1978;40:497-504.
30. Jackson AS, Pollock ML, Ward LC. Generalized equation for predicting body density of women. Med Sci Sports Exerc. 1980;13:175-82.
31. Siri WE. Body composition from fluid spaces and density: analysis of methods. Apud Brozek J, Henschel. Techniques for measuring body composition. Wash-ington National Academy of Science, 1961;223-4.
32. Bland JM, Altman DG. Statistical methods for assessing agreement between two methods of clinical measurement. Lancet. 1986;307-10.
33. Ploutz-Snyder LL, Giamis EL. Orientation and familiarization to 1rm strength test-ing in old and young women. J Strength Cond Res. 2001;15:519-23.
34. Pompeu FAMS, Gabriel D, Pena BG, Ribeiro P. Áreas de secção transversa do braço: implicações técnicas e aplicações para avaliação da composição corporal e da força dinâmica máxima. Rev Bras Med Esporte. 2004;10:202-6.
35. Hortobagyi T, Katch FL, Katch VL, LaChance PF, Behnke AR. Relationship of body size, segmental dimensions, and ponderal equivalents to muscular strength in high-strength and low-strength subjects. Eur J Appl Physiol. 1990;11:349-56. 36. Materko W, Santos EL, Neves CEB. Predição de uma repetição máxima basea-da nas características de homens e mulheres. (Resumo apresentado no XXVIII Simpósio Internacional de Ciência do Esporte), São Paulo, de 15 a 17 de outubro de 2005.
37. Abadie BR, Wentworth MC. Prediction of one repetition maximal strength from a 5-10 repetition submaximal strength test in college-aged female. J Exerc Physiol. online. 2000;3:1-7.
38. Shephard RJ. Exercise and training in women. Part I: Influence of gender on exercise and training responses. Can J Appl Physiol. 2000;25:19-34.
39. Cotterman ML, Darby LA, Skelly WA. Comparison of muscle force production using the Smith machine and free weights for bench press and squat exercises. J Strength Cond Res. 2005;19:169-76.