1. Grupo de Pesquisas em Fisiologia do Exercício – FEF – Universidade Presbiteriana M ackenzie.
2. Laboratório de Desempenho Esportivo – EEFE – Universidade do Esta-do de São Paulo.
3. Grupo de Estudo das Adaptações Fisiológicas ao Treinamento – GEAFIT – Universidade Estadual de Londrina.
Received in 25 / 9 / 05. Approved in 25 / 1 / 06.
Correspondence to: Rômulo Cássio de M oraes Bertuzzi, Rua Clorindo de Oliveira Café, 91, Jd. Nelly, Butantã – 05371-140 – São Paulo, SP. E-mail: [email protected]
Temporal independence of perceived exertion
response and heart rate in relation to run velocity
at a 10 km test simulation
Rômulo Cássio de M oraes Bertuzzi1,2,3, Fábio Yuzo Nakamura3, Luiz Claudio Rossi2, M aria Augusta Peduti Dal’M olin Kiss2 and Emerson Franchini2,3
O
RIGINALA
RTICLEKeyw ords: Borg scale. Teleoanticipation. Pacing strategy. Fatigue. Afferent
sig-nals. ENGLISH VERSION
ABSTRACT
The objective of this study w as to investigate pacing strategy, perceived exertion and heart rate during a competitive run simula-tion. Eight recreational runners ran a 10 km distance in an outdoor 400 m track w ith 28-30oC temperature. Before the run they w ere asked to run the 10 km as faster as possible. The run velocity, the perceived exertion and the heart rate w ere measured each 400 m. The speed of run decreased on 19th and 20th laps (p < 0.05). The heart rate increased significantly on 7th and 10th laps (p < 0.05) and achieved steady state afterw ards, w hile the perceived exertion increased statistically until the 13th lap (p < 0.05). These data su-ggest that pacing strategy, perceived exertion and heart rate have different temporal adjustments during a competitive run. Possibly the run strategy is established before the competition simulation and has an economic aspect to the last lap. This economic effect of run strategy is determined until the half of the distance is com-pleted by rate of perceived exertion modulation, w hich is a result of metabolic, context and cognitive feedbacks.
INTRODUCTION
Due to the low cost and the easiness of access to the practice site, the middle and long distance runs are probably w ithin the most popular kinds of run in athletics. In these competitions, the athletes have the aim to run a certain distance in a period of time shorter than the other competitors‘ or than a record previously set. Such fact has leaded some researchers to discuss about the main physiological variables that determine the performance of theses athletes. Noakes(1) suggested that part of the events related to the excitement/contraction combination are essential to the success in these competitions, w hile Basset and How ley(2) relied the ath-letes‘ performance to the aptitude of the cardiorespiratory system. On the other hand, it is know n that provided that the middle and long distance runs have duration longer than tw o minutes, the energy transfer during these tasks is mainly conceived by the oxi-dative system(3). M oreover, it is believed that independently of the aptitude level of the individuals, the heart rate (HR) is the main responsible for the increase of the cardiac debt in the intensities betw een 60% and 70% of the maximum oxygen consumption(4). Therefore, the results of some studies pointed to the possibility of
the use of the monitoring of the HR to represent the physiological demand in tasks predominantly aerobic(5-7).
Besides the HR, the scale of perceived exertion (PE) presented by Borg(8) has also been w idely used in the control(9-10) and in the indirect determination of fulfillment of continuous cycle tasks(11) and intermittent(12) w ith aerobic predominance. The use of this scale is based on the premise that the physiological adjustments pro-moted by the physical stress produce measurable sensory signals w hich are able to alter the subjective perception of exertion. It is supposed that the PE processing is given by the interaction of multiple measurable signals come from the cardiorespiratory(12-13) and neuromuscular systems(14). How ever, Rejeski and Ribisl(15) dem-onstrated that the PE response can be dissociated from the exer-cise intensity w hen the individuals have some kind of information about the time of duration of the task. Furthermore, recent evi-dence has suggested that the muscular pow er and PE adjustments suffer influence of a model of anticipation program called teleoan-ticipation(16-17).
According to Lambert et al.(17), the teleoanticiaption is a result of complex interactions betw een the past and current cognitive and contextual metabolic feedback, w hich determine the rhythm to be applied in a given task, w ith the aim to early avoid the triggering of the physiological processes responsible for fatigue. Therefore, it is probable that the performance of middle and long distance run-ners does not depend only on the metabolical potential, but mainly on the elaboration of the pacing strategy (PS) adopted, w ith the objective to be more efficient(18).
It is relevant to highlight that the great majority of the experi-mental outline of the mentioned studies consisted of laboratory or field tasks w hich had the intensity, duration and environment con-trol, w hile in the real situation of the sport practice the athletes self- select the applied rhythm and are constantly exposed to dif-ferent types of internal and external feedback. Consequently, the aim of the present w ork w as to analyze the PS, HR and PE behav-ior during the simulation of a 10 km run, in w hich the runners w ere asked to complete this distance in the shortest period of time as possible.
M ETHODOLOGY
Subjects
Anthropometrical measures
The total body w eight w as measured by means of a mechanical scale (Filizola®, Brazil). The measurement of the suscapular, tricip-ital and abdominal skinfolds w as done three times in a rotation system, according to the standardization recommended by the In-ternational Society for the Advancement of Kinanthropometry(19) CESCORF dividers w ith 1 mm precision w ere used to take these measures, being adopted the values of the respective medium lines to represent them. The body density w as estimated by the equa-tion presented by Lohman(20), w hile the body fat percentage w as estimated by the equation proposed by Siri(21).
10 km run
The simulation of the 10 km run w as conducted in an athletics track w ith official dimensions. Such track w as surrounded by con-crete structures (locker rooms, for instance) and trees that w ould hamper the w ind flow. Besides that, during this simulation the tem-perature varied betw een 28oC and 30oC.
The individuals w ere asked not to do any vigorous training or drink alcohol in the 72 h prior the development of this investiga-tion. The subjects w ere also asked not to ingest food w ith caffeine and to have their last meal at least 2 h prior the test simulation. The data collection w as conducted in times close to the ones w hen the individuals w ere used to train.
After the general instructions w hich involved the study, the sub-jects w ere asked to run the 10 km distance in the shortest time as possible. The runners w ent off in tw o groups w ith four individuals each. The total and partial time in each 400 m lap w as individually measured through a manual timer brand name Casio (HS 50 W, Japan). The PS w as established in relation to the average velocity (υ_) w hich the individuals kept in the 400 m partial runs [υ_ (m.s-1) = 400 m/partial time (s)].
The monitoring of the heart rate during the 400 m partials w as conducted through frequency meters brand name Polar (A1 mod-el, Finland). The measurement of the PE w as conducted through the 15 points scale presented by Borg (1982), w hich w as previous-ly translated to Portuguese (figure 1). The copies of this scale w ere laminated and reduced to 10 cm of length by 5 cm of w idth, being later tied close to the w rist of the dominant low er arm of the indi-viduals. Before the beginning of the simulation of the test, it w as show n to the runners how the PE should be reported. The repro-ducibility of the measurement of the PE in progressive test or of constant load in athletics track has been already demonstrated(22).
Statistical analysis
The data w ere statistically analyzed through the computerized program SPSS (10.0 version) and later presented in averages ± standard deviations. The level of association among the average velocity, the heart rate and the perceived exertion w as verified through the Pearson correlation coefficient. The comparison of the heart rate response, of the perceived exertion and the average velocity during the 400 m laps w as conducted through the vari-ance analysis w ith repeated measures to a factor (lap), follow ed by
the test for multiple comparisons by Bonferroni. The significance level of 5% w as adopted for all analyses (p < 0,05).
RESULTS
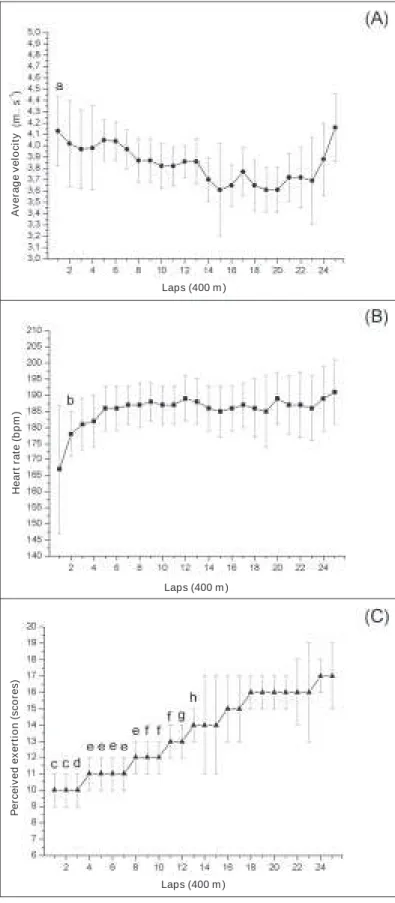
The main results are in table 2 and are graphically presented in figure 2. Both the HR (r = –0,53; p = 0,006) and the PE (r = –0,60; p = 0,001) negatively correlated w ith the υ_, w hile the HR positively correlated w ith the PE (r = 0,44; p = 0,027). As one can observe, the υ_ of the second lap w as statistically low er than the 19th (F = 6,041; p < 0,05) and the 20th (F = 6,041; p < 0,05) laps. Only the HR response of the 2nd lap w as significantly low er than the 7th (F = 6,476; p < 0,05) and the 10th (F = 6,476; p < 0,05) laps. The PE statistically changed up to approximately half of the test, since in the 1st and the 2nd laps the values w ere statistically low er than in the 11th, 13th, 16th, 17th, 18th, 19th, 20th, 21st, 22nd, 23rd, 24th and 25th laps (F = 35,446; p < 0,05). In the 3rd lap the PE w as also signifi-cantly low er than the 13th, 17th, 18th, 19th, 20th, 21st, 22nd, 23rd, 24th and 25th laps (F = 35,446; p < 0,05). The PE responses in the 4th, 5th, 6th, 7th and 8th laps w ere again low er than the 18th, 19th, 20th, 21st, 24th and 25th laps (F = 35,446; p < 0,05). Likew ise, the PE of the 9th, 10th and 11th laps w as low er than the 18th, 19th and 24th laps (F = 35,446; p < 0,05). In the 12th lap the PE w as still low er w hen compared to the 20th and 21st laps (F = 35,446; p < 0,05). Finally, the PE response in the 13th lap w as low er than in the 18th, 19th, 20th and 24th laps (F = 35,446; p < 0,05).
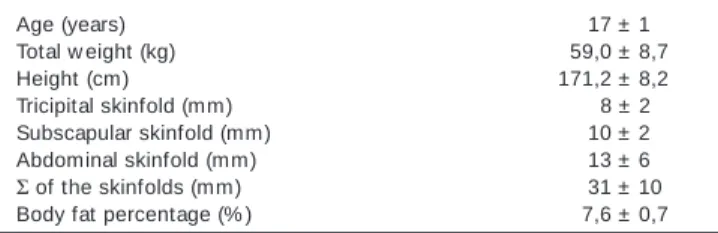
TABLE 1
Chronological age and anthropometrical variables of the recreational runners (n = 8)
Age (years) 17 ± 10
Total w eight (kg) 59,0 ± 8,70
Height (cm) 171,2 ± 8,200
Tricipital skinfold (mm) 8 ± 2
Subscapular skinfold (mm) 10 ± 20
Abdominal skinfold (mm) 13 ± 60
Σ of the skinfolds (mm) 31 ± 10
Body fat percentage (% ) 7,6 ± 0,7
The values are averages ± standard deviation
Figure 1 – Fifteen points-scale of the perceived exertion translated to Por-tuguese
Very, very easy
Very easy
Quite easy
A little difficult
Difficult
Very difficult
Very, very difficult
TABLE 2
Averages and standard deviation of time, velocity, heart rate and of perceived exertion during the 10 km test simulation (n = 8)
Time (min) 44 ± 20
Average velocity (m•s-1) 3,8 ± 0,2
Average velocity (km•h-1) 13,8 ± 0,60
Heart rate (bpm) 185 ± 400
Subjective exertion scale (score) 14 ± 20
DISCUSSION
In other sports predominantly aerobic, especially in row ing(23), it has been suggested that the ideal PS determination can have di-rect implications in the maximization of the performance of the
athletes. Garland(23) observed that row ers champions in the 2000 m international competitions tended to do the first 500 m in the highest average velocity of the competition, how ever, a reduction of approximately 2% in the remaining 1500 m is common to be observed. According to Garland(23), despite the mentioned strategy potentializing of the processes that trigger the acute muscular fa-tigue, it seems the athletes tactically benefited, since they w ere in positions that allow ed the monitoring of their opponents‘ boats. This is possible since in such sport, the athletes row facing the exit site. In the present study, the runners also started the 10 km simulation in the highest υ_ of the w hole distance, how ever, later, especially in the 20th lap, they expressively reduced the applied rhythm up to 13% . M oreover, close to the end of the test, the individuals increased again the applied rhythm, surpassing the ve-locity of the first lap. Therefore, it is clear that recreational runners adopt as PS a great reduction of the velocity during the run as a saving agent for a possible final sprint.
It is possible that in the middle and long distance competitions the PS of the runners is mainly determined by the aerobic capacity w hen w e admit that the average velocity of the 4 mM lactate thresh-old of recreational runners is of approximately 14,3 km h-1(24), w hich w ould be similar to the one in the present study (≅ 13,8 km • h-1). Possibly, the influence of the aerobic capacity in the PS is due to the fact that the supra threshold velocities induce the increase in the production of lactate(25), w hich w ould be related to the increase of the cell acidosis and, consequently, to acute muscular fatigue(26). Thus, it is probable that the recreational runners have constantly adjusted the υ_ in a manner inverse to the contribution of the glyc-olytic system, at least up to the one before the last lap. It is know n that w ith the participation of the glycolytic system in protocols w ith continuous load, an increase of the PE proportional to the anaero-bic mobilization rate is observed (11). How ever, such discourse should be cautiously interpreted, since in the present investigation no measurement of this physiological variable w as taken.
The correlation inversely proportional detected betw een the HR and the υ_ show s that, besides the aerobic ability, the stress of the cardiovascular system can be another variable that shapes the PS via central nervous system. Our results corroborate part of the hypothesis presented by Noakes et al.(27), w ho suggested that the limitation of physical exercise is given by a theoretical model called ‘Central Governor’. In this model, one assumes that the chimiore-ceptors placed in the myocardium w ould send inhibiting signals to the central nervous system before the maximum heart’s capacity is reached. Such fact w ould result in the reduction of the neural commands to the skeletal muscle, w ith the aim to avoid the is-chemic response of the myocardium. The increase of the maxi-mum HR and the maximaxi-mum cardiac debt itself identified in exer-cise under hyperoxia, and the inverse response, under laboratory induced-hyperoxia, is an evidence for this hypothesis. On the oth-er hand, the increase of the HR during physical exoth-ercise has been commonly attributed to the increase of the metabolic demand im-posed by the task’s intensity(6-7). How ever, during the 10 km, the HR had its first significant increase only from the seventh lap (ap-proximately 12 minutes) and remained high until the end of the test, w hile the highest υ_ w as detected in the beginning of the run, follow ed by an expressive reduction in the simulation According to Achten and Jeukendrup(5), the HR response during the physical exercise can also be influenced by various extrinsic factors, among them, the environmental temperature and the hydration of the in-dividuals. Nevertheless, the great majority of studies collected by Achten and Jeukendrup(5) used the environmental temperature above 35oC and the reduction of approximately 5% of the body w eight. Hence, it is probable that such variables have little influ-enced in the HR response during the simulation, once that besides the individuals being instructed not to ingest food that could in-duce the hypo hydration, the environmental temperature has al-w ays been beloal-w 35oC.
Figure 2 – Behavior of the running strategy (A), of the heart rate (B) and of the perceived exertion (C) during the 10 km simulation test (n = 8) The values are averages ± standard deviations. a = significant difference of the 19th and 20th laps;
b = significant difference of the 7th and 10th laps; c = significant difference of the 11th, 13th, 16th,
17th, 18th, 19th, 20th, 21st, 22nd, 23rd, 24th and 25th laps; d = significant difference of the 13th, 17th,
18th, 19th, 20th, 21st, 22nd, 23rd, 24th and 25th laps; e = significant difference of the 18th, 19th, 20th,
21st, 24th and 25th laps; f = significant difference of the 18th, 19th and 24th laps; g = significant
difference of the 20th and 21st laps; h = significant difference of the 18th, 19th, 20th and 24th laps.
Significance level of 5% (p < 0,05).
A
v
er
ag
e v
el
o
ci
ty
Laps (400 m )
Hear
t r
at
e (b
p
m
)
Laps (400 m )
P
er
cei
v
ed
ex
er
ti
o
n
(sco
res)
Such idea is reinforced by the results of the study by Boudet et al.(28), in w hich no significant correlation betw een the HR response and the w eather conditions in competitions of street running w as obtained. Somehow, these findings can indicate that during the middle and long distance run competitions, the monitoring of the HR can be an inefficient index for the monitoring of the intensity of the exertion in these situations.
Concerning the PE, it has been w idely associated to a process of sensory interaction of the physiological adjustments originated from the metabolic demand imposed by the physical exertion(8,11,22). How ever, information about the main physiological stimuli (central or peripherical) is still inconclusive. For instance, Noble et al.(14) observed that the increase of the perceived exertion is accompa-nied by the increases of the blood and muscular lactate concentra-tions. On the other hand, the results of the studies collected by Robertson(13) show ed that the adjustments of the perceived exer-tion are mediated by the HR increases, the pulmonary ventilaexer-tion, the respiratory quotient and the oxygen consumption.
In the present study though, the υ_ and the HR of the runners statistically changed only at the beginning of the simulation of the 10 km test, w hile the PE significantly increased up the 13th lap. It is believed that the PE response has also been modeled by the inter-action of the cognitive and contextual factors that constitute the teleoanticipation(17), w hich, in that occasion, w as triggered by the intention to exercise at one’s peak in an objective w ith a set dis-tance. Thus, through the experiences and the current context eval-uation (temperature, internal conditions), the teleoanticipation w ould guide the increase rate of the perceived exertion, w hich w ould remain in bearable levels so that the 10 km distance could be ful-filled in the shortest possible time, causing the end of the test to agree w ith the values of PE close to the maximum. It means that a new interpretation of the relation betw een indicators of overload (mechanical and physiological) and the exertion perception in situ-ations of set objective and variable strategy. The PE w ould be an independent variable and the run velocity a dependent variable, inverting the given idea about conducting rectangular and/or pro-gressive tests. The teleoanticipation and the consistency of the control of exercise intensity through the PE in a 20 km sprint sim-ulation in cycling w as experienced in the results presented by Tucker et al.(29). They show ed that the central temperature measured at each 5 km w as similar during almost the entire distance under external temperature of 35°C (hot) or 15°C (cold), except for the last measure, w hich w as at the end of the simulation, w hich fa-vored higher increase under 35°C. The average time to complete the 20 km in hot w eather (29,6 ± 1,9 min) w as low er than the time spent in the cold w eather (28,8 ± 1,8 min), and the average pow er presented inverse standard (255 ± 47 W versus 272 ± 45 W). The point differences in the mechanical pow er w ithin the different ex-ternal conditions w ere more evident and statistically significant during the final part of the simulation (80-100% of the total dura-tion). The highest average pow er kept in the conducted test in cold w eather w as accompanied by bigger electromyographic ac-tivity, show ing that in hot situations the neuromuscular activation w as reduced from 10 km. Despite the differences in the neuro-muscular activity, the PE show ed similar behavior to the increase under the influence of external temperatures. Therefore, the re-duction of the lectromyographic activity prior to any radical chang-es in the central temperature seems to be related to mechanisms of central control, w hich w ould avoid severe and irreversible per-turbations in the thermoregulation. Probably, the PE evolution, pro-jected from the beginning to the end of the 20 km simulation, through the sensory feedback mechanisms and through influence of the teleoanticipation itself, may have modeled the strategy of neuromuscular activation and consequently, the mechanical per-formance itself. Once again a situation w here the PE w ould be placed as independent variable is faced. The PE w ould model the strategy adopted to complete the distance as w ell.
According to Lambert et al.(17), the individuals previously program the running strategy that w ill be adopted in order to prevent the premature development of fatigue, w hich w ould lead to a time dissociation among the perception of exertion, the heart rate and the external pow er generated. M oreover, Gibson et al.(30) suggest-ed that the processing of the perceivsuggest-ed exertion is also altersuggest-ed by cognitive signals, such as the memory of a training session previ-ously conducted and the motivation at the moment of the task. Thereby, w e believe that differently from other studies in w hich there w as the control of contextual variables that may interfere in the PE(9,11,22), the intention to exercise to the limit in real situations of sports practice, leads to a time dissociation of the PE w ith the HR and w ith the exercise intensity.
CONCLUSIONS
The results of the present study pointed to a time dissociation betw een the PE and the HR due to the PS adopted by recreational runners during the simulation of a middle distance run. It w as pro-posed that the intention to exercise to the limit is determined be-fore the beginning of the task. How ever, it is modeled up to the half of the test through a physiological, contextual and cognitive process of retro alimentation Such intention functions as a saving agent for a possible increase in the velocity close to the end of the test, w hich induces the differentiated response commonly present-ed betw een the PE and the HR in the studies that uspresent-ed tasks w ith bigger control of these variables. It has also been suggested that the HR is a physiological index not very sensitive in the determina-tion of the run intensity in middle distance. On the other hand, other w orks should be elaborated in order to investigate the influ-ence of the aerobic aptitude level and different kinds of feedback in the PS, PE and HR during the situations that are close to the 10 km tests.
ACKNOWLEDGM ENTS
The authors thank to Jefferson Rosa Cardoso, for the help in the statis-tical analysis and Flávio de Oliveira Pires for the suggestions.
All the authors declared there is not any potential conflict of inter-ests regarding this article.
REFERENCES
1. Noakes TD. Implications of exercise testing for prediction of athletic performance: a contemporary perspective. M ed Sci Sports Exerc 1988;20:319-30.
2. Basset DR, How ley ET. Limiting factors for maximum oxygen uptake and deter-minants of endurance performance. M ed Sci Sports Exerc 1999;32:70-84.
3. Gastin PB. Energy system interaction and relative contribution during maximal exercise. Sports M ed 2001;31:725-41.
4. Tanaka K, Yoshimura T, Sumida S, M itsuzono R, Tanaka S, Kinishi Y, et al. Transi-et responses in cardiac function below, at, and above anaerobic threshold. Eur J Appl Physiol 1986;55:356-61.
5. Achten J, Jeukendrup AE. Heart rate monitoring: applications and limitations. Sports M ed 2003;33:517-38.
6. Petit M A, Nelson CM , Rhodes EC. Comparison of a mathematical model to pre-dict 10-km performance from the Conconi Test and ventilatory threshold mea-surements. Can J Appl Physiol 1997;22:562-72.
7. Astrand P, Ryhming I. A nomogram for calculation of aerobic capacity (physical fitness) from pulse rate during submaximal w ork. J Appl Physiol 1954;22:218-21.
8. Borg GA. Psychophysical bases of perceived exertion. M ed Sci Sports Exerc 1982;14:377-81.
9. Garcin M , M ille-Hamard L, Billat V. Influence of aerobic fitness level on mea-sured and estimated perceived exertion during exhausting runs. Int J Sports M ed 2004; 25:270-7.
11. Nakamura FY, Gancedo M R, Silva LA, Lima JRP, Kokubun E. Utilização do esfor-ço percebido na determinação da velocidade crítica em corrida aquática. Revista Brasileira de M edicina do Esporte 2005;11:1-5.
12. Pandolf KB. Differentiated ratings of perceived exertion during physical exer-cise. M ed Sci Sports Exerc 1982;14:397-405.
13. Robertson RJ. Central signals of perceived exertion during dynamic exercise. M ed Sci Sports Exerc 1982;14:390-6.
14. Noble BJ, Borg GA, Jacobs I, Ceci R, Kaiser P. A category-ratio perceived exer-tion scale: relaexer-tionship to blood and muscle lactates and heart rate. M ed Sci Sports Exerc 1983;15:523-8.
15. Rejeski WJ, Ribisl PM . Expected task duration and perceived effort: an attribu-tional analysis. J Sport Psychology 1980;2:227-36.
16. Albertus Y, Tucker R, Gibson AC, Lambert EV, Hampson DB, Noakes TD. Effect of distance feedback on pacing strategy and perceived exertion during cycling. M ed Sci Sports Exerc 2005;37:461-8.
17. Lambert EV, Gibson AC, Noakes TD. Complex systems model of fatigue: inte-grative homoeostatic control of peripheral physiological systems during exer-cise in humans. Br J Sports M ed 2005;39:52-62.
18. Jones AM , Whipp BJ. Bioenergetic constraint on tactical decision making in middle distance running. Br J Sports M ed 2002;36:102-4.
19. Norton K, Olds T. Antropometrica. 1ª ed. Rosario, 1996.
20. Lohman TG. Skinfolds and body density and their relation to body fatness: a review. Hum Biol 1981;53:181-225.
21. Siri WE. Body composition from fluids spaces and density: analysis of tw o meth-ods. In: Brozek J, Henschel A. National Academy of Sciences National Research Council. Washington, 1961;223-44.
22. Garcin M , Wolff M , Bejma T. Reliability of rating scales of perceived exertion an heart rate during progressive and maximal constant load exercise till exhaustion in physical education students. Int J Sports M ed 2003;24:285-90.
23. Garland SW. An analysis of the pacing strategy adopted by elite competitors in 2000 m row ing. Br J Sports M ed 2005;39:39-42.
24. Zamparo P, Perini R, Peano C, di Prampero PE. The self selected speed of run-ning in recreational long distance runners. Int J Sports M ed 2001;22:285-90.
25. Heck H, M ader A, Hess G, M ucke S, M uller R, Hollmann W. Justification of 4 mmol/l lactate threshold. Int J Sports M ed 1985;6:117-30.
26. Jacobs I. Blood lactate: implications for training and sports performance. Sports M ed 1986;3:10-25.
27. Noakes TD, Peltonen JE, Rusko HK. Evidence that a central governor regulates exercise performance during acute hypoxia and hyperoxia. J Exp Biol 2001;204: 3225-34.
28. Boudet G, Garet M , Bedu M , Albuisson E, Chamoux A. M edian maximal heart rate for heart rate calibration in different conditions: laboratory, field and compe-tition. Int J Sports M ed 2001;23:290-7.
29. Tucker R, Rauch L, Harley YX, Noakes TD. Impaired exercise performance in the heat is associated w ith an anticipatory reduction in skeletal muscle recruitment. Pflugers Arch 2004;448:422-30.