Numerical analysis of symmetrical and asymmetrical
reinforced concrete lat slabs – an integrated slab/
column analysis
Análise numérica de lajes planas simétricas e
assimétricas em concreto armado – análise integrada
laje/pilar
a Instituto Federal de Santa Catarina, Departamento Acadêmico da Construção Civil, Florianópolis, Brasil; b Universidade Federal de Santa Catarina, Departamento de Engenharia Civil, Florianópolis, Brasil.
Received: 19 Mar 2015 • Accepted: 06 Jan 2016 • Available Online: 31 May 2016
Abstract
Resumo
This paper studies the modeling of symmetric and asymmetric lat slabs, presenting alternatives to the problem of singularity encountered when the slab is modeled considering columns as local support. A model that includes the integrated slab x column analysis was proposed, distributing the column reactions under the slab. The procedure used transforms the bending moment and column axial force in a distributed load, which will be applied to the slab in the opposite direction of gravitational loads. Thus, the bending moment diagram gets smooth in the punching region with a considerable reduction of values, being very little sensible to the variation of used mesh. About the column, it was not seen any signiicant dif
-ference in the axial force, although the same haven’t occurred with the bending moments results. The inal part of the work uses geoprocessing programs for a three-dimensional view of bending moments, allowing a new comprehension the behavior of these internal forces in the entire slab.
Keywords: lat slabs, reinforced concrete, FEM, singularity.
Este trabalho estuda a modelagem de lajes planas simétricas e assimétricas, apresentando alternativas para o problema da singularidade ocor
-rido quando se modela a laje considerando os pilares como apoio pontual. Foi proposto um modelo que contempla a análise integrada Laje x Pilar, distribuindo a reação do pilar na laje. O procedimento utilizado consiste em transformar o momento letor e o esforço normal do pilar em um carregamento distribuído, que será adicionado na laje como carregamento no sentido contrário à ação das cargas gravitacionais. Com isso, tem-se um arredondamento do diagrama de momento letor da laje na região do pilar puncionado com uma considerável redução dos valores, sendo pouco sensível à variação da malha utilizada. Em relação ao pilar, o esforço normal não apresentou diferenças signiicativas, porém o mesmo não ocorreu com o momento letor. A parte inal do artigo utiliza programas de geoprocessamento para uma visualização tridimensional dos momentos letores, permitindo uma nova compreensão do comportamento desses esforços ao longo de toda a laje.
Palavras-chave: lajes planas, concreto armado, método dos elementos initos, singularidade
A. PUEL a
D. D. LORIGGIO b
1. Introduction
The lat slabs are an interesting structural system for applications in projects, providing layout changes because they don’t require the
use of beams. Analyses of this type of slab are complex and are
often designed using software developed for linear analysis based on the classic plate theory, using numerical analyses (SKORPEN ET AL [1]). The Finite Element Method (FEM) and Grid Analogy Method are examples for numerical analyses, both procedures widely used by technical designers.
The use of numerical models that simulate the slabs-columns
con-nections as being pinned support (singularities) provide results with high concentration of strains across these areas, resulting in peak of bending moments in the slab and distortions of the values
of bending moments columns. Results of this type require a more
reined analysis to be used in structural designs. According CHOI ET AL [2], the structural behavior of the slab- columns connections is very complicated, since they are composed of two diferent types of elements: beams (columns) and plates (slabs).
It is known that the slabs-columns connections are not punctual;
Figure 1 – Distribution of bending moments on a flat slab adapted of SKORPEN ET AL [1]
Code Column stripwidth Column strip Edge strip
TMH 7 1989, Code of practice for the Design of
Highway Bridges and Culverts in South Africa,
Part 3 (discussed under footings)
b + 3d (if the width of col the footing is greater
than 1,5 (b + 3d)col
66,67% 33,33%
SANS 10100 2000, The structural use of
concrete, Part 1 B
Eurocode 2, Design of concrete structures EN
1992-1-1:2003 (E)
b + 3d (if the width of col the footing is greater
than 1,5 (b + 3d)col
66,67% 33,33%
BS 8110:1997 Structural use of concrete, Part 1
b + 3d (if the width of col the footing is greater
than 1,5 (b + 3d)col
66,67% 33,33%
b = column dimension in the long direction; d = depth of the slab; D = longer plan dimension of footing; B = shorter plan dimension col
they are regions of complex behavior. The numerical models using
the columns as pinned supports despise the favorable efect of that interaction region. This efect should be taken into account to
provide a better analysis of the slabs-columns connections.
There-fore, it is necessary improve the models to obtain suitable eforts
across these areas.
There are several possible models that take these efects into ac
-count, which can vary in complexity, and many of them are not suitable for current use in structural projects. MURRAY ET AL [3] comments that the way to model slabs-columns connections be
-havior is the critical point of analysis of lat slabs.
The purpose of this paper is to contribute to the development of
models for structural analysis that can be used in projects of rein
-forced concrete structures, integrating lat slabs with the columns, using the Finite Element Elastic Linear Analysis. To ease the analy -sis of the slabs-columns connections and to obtain results for the
design of the slabs, this work also tried to contribute in graphic
displays of results using available resources in other areas of
engineering, allowing 3D views and mapping sections in regions
of interest.
The softwares SAP2000 [4], ArcGIS / ArcMap [5] and Global Mapper [6] have been adopted as tools for the development of this work.
2. Modeling alternatives slabs-columns
connections
Theoretically, when a concentrated load is applied on a slab, it causes a bending moment that tends to ininity in its point of ap
-plication, creating singularity points. Consequently, in a numeri
-cal method, when a column for supporting slabs is modeled as a pinned support, it causes the efect of a concentrated load in the opposite direction, resulting in very high bending moments on the load application point and around it. Studies by PUEL [7] showed that those moments will be greater as the mesh gets more reined.
According SKORPEN ET AL [1], the basics of using linear FEM
to analyze lat slabs is commonly understood by most designers. However, the modeling of connections between column and slab is
still open to numerous forms of designer interpretation.
The NBR 6118: 2014 [8] and even the Eurocode 2 [9], which is a respected code in the technical community, do not prescribe a type of analysis or modeling nor indicate how to interpret the results
obtained from a numerical analysis of concentrated loads efect. This naturally leads to many forms of interpretation that depend on
how the slabs-columns connections are modeled, leaving it to the experience and feeling of the designers.
Another approach for the design of lat slabs is use the Equivalent Frames Method, which takes into account the plastic behavior of
the cross sections of reinforced concrete slab, that leads to a de
-sign with redistribution of bending moments. According MURRAY ET AL [3], the design of lat slabs is governed by national codes
of practice that have developed as a result of empirical research.
Some international codes prescribe criteria to distribute the peak bending moments for the footings design, as shown in Figure 1. The NBR 6118: 2014 [8], item 14.7.8, allows the structural analy
-sis of lat slabs by the Equivalent Frames Method (EFM). This is a process based on an approximate elastic analysis, with re
-distribution, taking in each direction multiple frames to obtain the internal forces, whose inertias will be equal to the slab’s limited by the half of the distance between two rows of columns, as shown in Figure 2.
For each frame the total loading must be considered. The distri
-bution of moments obtained in each direction, according to NBR 6118: 2014 [8], item 14.7.8, is as follows:
n 45,0 % of positive moments for the two inner strip;
n 27,5 % of positive moments for each of the external strip;
n 25,0 % ofnegative moments for the two inner strip;
n 37,5 % of negative moments for each of the external strip. The Equivalent Frames Method provides more economic results compared with projects based on linear elastic analysis, but should be used only in the Ultimate Limits State (ULS) checks.
For checks of Serviceability Limits Service (SLS), an Elastic Anal
-ysis Linear or Nonlinear anal-ysis is still required. However, the Equivalent Frames Method cannot be used in lat slabs with con
-siderable asymmetries, mainly when they occur in the positioning
of the columns.
ROMBACH [10] summarized some ways to model the
slabs-col-umns connections, shown in Figure 3.
a) Full 3D continuum model – this model is accurate, but very time consuming;
b) Pinned supports over all nodes above the column – does not represent accurately the rigidity of the pillar;
c) Encased supports assigned to the edge of the column in the shell model – does not represent accurately the rigidity of the pillar;
d) Spring supports assigned to the column area in the shell model – no restrictions;
e) Rigid column head – this represents accurately the rigidity of
The cases (a) and (g) showed the best results of this comparative. According to the authors, the case (i) should be avoided as it does not take into account the columns rigidity. The comparative with the experimental tests conirm the results presented for the cases (a) and (g) and also to the criteria presented in Figure 1.
HENNRICHS [12] studied, from a reference slab with dimensions of 10x10m and a middle column, displacements, positive and neg
-ative bending moments, and reaction in the middle column, using
the linear analysis based on the classic plate theory. When consid-ering the middle column as pinned support or as load distributed
in the cross-section area column, there was little diference in the positive moments, displacements and reaction in the middle col
-umn. The maximum negative moment, however, decreases, and
the diagram of moments became smoother in the region of the
mid-dle column. These results were compared with numerical methods, including Finite Element Method and Grid Analogy Method. The values were similar for ine meshes, with signiicant diferences for
Figure 3 – Idealizations of column/flat slab connections (ROMBACH [10])
A
D
B
E
C
T AL [1])
A
D
G
B
E
H
C
F
Figure 5 – Column modeled as solid element (HENNRICHS [12])
developing design examples with and without cantilevers, compar -ing the results with the Equivalent Frames Method and the FEM,
using the software SAP 2000 [4]. In the analysis by the FEM, ex
-amples were studied modeling column as a pinned support and the reaction distributed in the slab in the cross-section area column, with the opposite direction to the application of load on the slab. The models 01 and 02, presented in PEDROSO [13], consider the
column as pinned support, with a mesh of 20x20m and 10x10m
respectively. The models 03 and 04 distribute the column reaction
on the slab, but the model 04 considers the cross-section area column projected at the geometric center of the slab. As a result of these models, the bending moments gets a smoothed surface, more evident in the model 04 (Figure 6).
There was also a comparison of bending moments obtained in the slab for the Model 04 (which considers the analysis by FEM) with the the Equivalent Frames Method (EFM). This type of comparison can provide criteria for design the slab in ULS, based on linear elastic analysis (Figure 7).
The results of this comparison showed that the positive moments had a signiicant diference on the external columns. The same
happened with the negative moments, being numerically greater the moments obtained by the FEM.
PUEL [7] studied on symmetric and asymmetric lat slabs the be -havior of the bending moments in slab and columns by modeling the columns as pinned support, as reaction distributed the slab in the cross-section area column and also reaction distributed in the
column region projected at the geometric center of the slab (similar
criteria to the efects of a wheel on a deck of a bridge), as shown in Figure 8.
PUEL [7] also studied the existence of a rigid sector at the cross-section column head, as prescribed by NBR 6118: 2014 [1], item 14.6.2.1: “The span of linear elements belonging to the common area at the crossing of two or more elements may be considered rigid (nodes of inite dimensions) “. (Figure 9).
The main idea of the model proposed in this paper is to
distrib-ute the column reaction in a given area, with a load applied in the bottom-up direction on the slab, simulating the column dimensions and its interaction with the slab. This procedure is similar to the
one used to smooth the negative moments over the supports in
continuous beams of reinforced concrete, recommended by the NBR 6118: 2014 [8] and also showed by GLÓRIA [11]. This model, as will be demonstrated later, eliminates the singularity, gets the negative bending moments diagram smoothed in both directions, and makes the model less dependent of the mesh adopted for the analysis. And, besides providing good results for the design, it is
a much simpler model than the others found in the bibliography.
3. Methodology for column reaction
distribution on the slab
When the column is positioned asymmetrically in relation to the
slab, the load is asymmetric or horizontal forces exist, besides the
normal force, bending moments appear in the column. The appli -cation of the load as a reaction distributed in the slab at the column
region should take into account binary forces, calculated from the sum of the bending moment applied to the slab, from the upper and lower span column.
The efect of connection between column x slab is obtained through a model analogous to the one used in continuous beam, which is modeled half of the column above and half of the column below. With this, when there is an asymmetry in the loading and/or the geometry between the slab and punched column, spin happens on the joint at the column x slab connection, which causes bending in the column, as shown in Figure 10.
The methodology for simulating the axial forces and bending on the column as a reaction applied to the slab consists an iterative
process, shown briely in Figure 11.
The necessary steps in this process are presented in detail
as follows:
1) Initially, analyze the structure modeling the column as pinned
support to obtain the diagrams of normal forces and bending
moments on the column;
2) Find the value of “q” and “qM”. Overlap the normal (q) and bend
-ing (qM) column efects, getting a inal loading diagram with qE and qD values, adding it in the slab.
Where:
q = Load value applied as a reaction on the slab due to the column normal stress;
a = colum dimension at the moment action plan; b = another column dimension;
P = axial force on the column;
Mlaje = slab bending moment, obtained by the sum of upper
=>?@ABCDEFGBAHIG>JBKGLABM ABKBHGGNBOLF@PHIKK@MM LAGQLAQFIGKFIRSTUVWXYZ[
aprojected
moment column and lower moment column;
qM = Edge value load applied as reaction on the slab; qE = load at the column left face;
qD = load at the column right face.
3) Replace column modeled as line (half up and half down) for a hinged support, as shown in Figure 12.
4) Analyze the structure again, obtaining the forces on column joint restricted (red circle in Figure 12);
5) The support reaction should be zero or close to zero. If not, correct the initial axial force from the diference found in this iteration;
6) Through spin joint, check the new active moment, multiplying the spin joint by the spring with stifness that simulates the ri
-gidity of the column line, modeled half upper and half lower of the slab, as shown in Figure 13.
The spring stifness (kmola) is calculated as follows.
(2)
Where:
kmola = spring stifness, which corresponds to the sum of the stif
-nesses of upper and lower span column; Ecs = Secant Elastic Modulus of concrete;
Isup = upper column inertia; Iinf = lower column inertia;
Lsup = upper column dimension;
Linf = lower column dimension.
Finally, the moment is calculated as follows:
(3)
Where:
Mlaje = Slab action moment;
kmola = springs stifness;
ϕ = column joint spin restricted (red circle in Figure 12), obtained by load diagram with qE and qD, applied as a reaction on the slab,
as shown in Figure 14.
If the bending moment in this iteration that occurs the column joint restricted is not equal to the previous bending moment, used to ind
qE and qD, it is necessary to repeat the process. Convergence occurs
when the moment obtained in the current iteration is equal or practi -cally equal to that used in the previous interaction. It is necessary to stipulate a minimum limit of convergence for the spring moments.
Figure 9 – Rigid sections according NBR 6118:2014 [8]
Figure
10 – Column modeled as continuous beam model (PUEL [7])
Figure 11 – Method scheme simulating the column as reaction to the slab (PUEL [7])
Figure 13 – Spring stiffness: half column
upper and half column down (PUEL [7])
Figure 14 – Column joint spin restricted (PUEL [7])
7) Thus, when the process does not converge, it is necessary to adjust the “q” and “qM” values from the new axial forces and
bending moment values, composing a new load diagram from
qE and qD values . This new diagram will once again applied to the slab until it has the convergence of axial force and bending
moment, within a minimum tolerance adopted by the designer.
4. Column as reaction on the slab
To represent the pillar as a reaction on the lat slab distributed at the column cross-section area, it is necessary that the geometry of the mesh used in FEM modeling matches these dimensions. The
same occurs when there is a rigid sector on the column head and when it distributes the reaction in the column region projected at the geometric center of the slab (similar criteria to the efects of a wheel on bridge slabs)
Thus, it is necessary to create transitions in the mesh to make this geometric adjustment, as shown in Figure 15 and Figure 16.
The adoption of rigid sectors on head column follows the NBR
6118: 2014 [8] requirements, item 14.6.2.1. This model was also suggested by ROMBACH [10] Case “e” Figure 3.
5. Models description
The numerical analyses made in this paper model the column in
diferent ways, the irst being a bar connected directly on the slab plate elements. This modeling is used only for comparison with the results obtained in more suitable models. Models were made to
replace the column reaction as load applied to the slab in opposite
direction as gravity loads, using the column cross-section area and column cross-section area projected at the geometric center of the slab. Finally, models were made with rigid sectors to simulate the column head, with or without distributed reactions.
Two structures were studied, one with a symmetrically middle col
-umn and another with an asymmetry on the col-umn position. The models developing for each structure were called “Cases” and are
presented in the next chapter.
The Figure 17 shows the structure with an asymmetric column po
-sition, with a 1m eccentricity to the vertical axis when compared with the symmetrical structure.
With:
n F
ck = 25 MPa;
n E
cs = 2,38 x 10⁷ kN/m 2;
n Floor covering = 1,0 kN/m2;
n Self wheigth = 0,16 x 25 = 4,0 kN/m2;
n Slab thickness = 16,0 cm
n Total load applied to the slab= 7,0 kN/m2;
n Vincinity beams sections 20 x 50 cm;
n Vincinity columns sections 20 x 20 cm;
n Middle column sections 50 x 50 cm;
n k
spring = 371875 kNm;
n Rigid sector dimension = 40,4 cm;
n Column projected dimension = 66 cm;
n Rigid sector stiiness = 100x slab thickness stifness.
As boundary conditions, the upper and lower column joints were restricted with roller and hinged supports, respectively. This model
is analogous to the continuous beam prescribed in NBR
6118: 2014 [8].
The slab was modeled with “THIN PLATE” elements, according to the Thin Plates Theory, based on the of Kirchhof´s theory (DKQ - discrete Kirchhof quadrilateral), which ignores transverse shear
\]^_`abcde ]^]fgahij `jkilahjm _nklaof
Figure 16 – Column region projected
at the geometric center of the slab
efects. The columns and beams were modeled with “FRAMES”
elements.
6. Summary models analyzed in
the software SAP 2000 [4]
The models that will be studied in this paper are summarized in
Table 1.
Remark:The Cases presented were modeled with diferent mesh
-es, whose dimensions are cited in the results.
7.
Analysis results
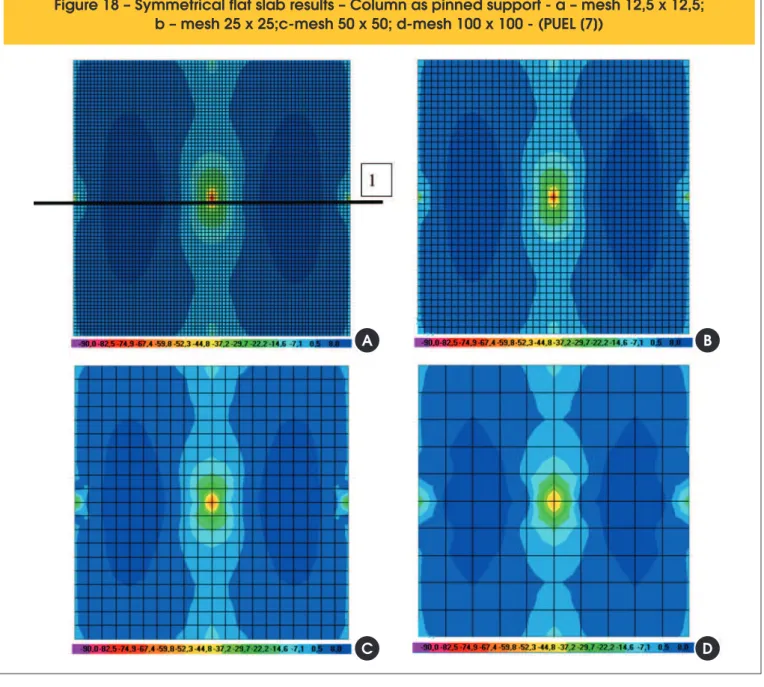
Models of symmetrical lat slabs (Case 1.1) are shown in Figure 18. The results (Figure 19) showed that the slabs positive mo
-ments are little inluenced modeling the column as line or by the mesh adopted. However, the same cannot be said about the nega -tive moments in the slab.
The Figure 19 also shows that the maximum negative moment over the column P5 is strongly inluenced by the mesh adopted, which tends to always increase with the reinement of this mesh. This moment is not suitable for use in structural analysis, showing
that the column modeled as a bar directly connected to the slab should be avoided if the purpose analysis is to obtain bending mo-ments in the region slab x column connection
It is shown in Figure 20 the bending moments over the column P5, section 1-1, using mesh 12.5, shown in Figure 18.
The bending moments diagrams provided by the Cases 1.2 and
1.3 were smoothed over the column P5 compared with Case 1.1 (where is pinned considered) because they consider the column reaction distributed in the slab. Analogous results were obtained by PEDROZO [13]. The other meshes studied also showed simi
-lar results as presented in Figure 20, showing that the Cases 1.2 and 1.3 are less sensitive to mesh used. Therefore, modeling the
column reaction as a distributed load solves the singularities, pro -viding suitable moments for structural analysis. The distribution of these loads over the section area column or the cross-section area column projected in the geometric center of the slab
changes a little the value of the maximum moment. The Figure 21, which shows the maximum moments over the column P5 for Cases 1.1, 1.2 and 1.3 for the various meshes studies, conirms
these partial conclusions.
Besides, it can be noted that Case 1.1 clearly shows the singularity problem, because the negative moments over the column increase when iner meshes are used.
The use of a rigid section at the column head also provides a suitable
modeling. The use of distributed loads together with the rigid sections smooth the moment diagram over the column, but there is some per
-turbation of moments within de column. The moments obtained on
the column face have very similar values to each other. It can be an appropriate alternative to represent the moments on this region.
The Figure 22 shows the bending moment’s variation at the P5 column face to the Cases 2.1, 2.2 and 2.3.
It may be noted that the values are practically the same for
Cas-es 1.2 and 1.3, obtained at the P5 column face, whatever mCas-esh used. In the Case 2.1, the moments at the face using a mesh with 12,5x12,5cm were almost the same obtained on Cases 1.2, 1.3, 2.2 and 2.3. The rigid section at column head allows modelling adequately the column stifness, also observed by ROMBACH [10] (Case “e” Figure 3).
When introduced an asymmetry in the column position, the struc
-tural behavior changes signiicantly. To calculate the distributed
reaction must include the column bending moment.
It’s showed at Figure 23 the bending moment on the lat slab with asymmetry in the column position. It was used a mesh with 25x25cm, carrying out reinements in the cross-section area column, using meshes with 12,5x12,5cm 6,25x6,25cm and 3,125x3,125cm.
Table 1 – Summary of used models
Case Asymmetry middle column
Rigid sector
middle column Subcases
1 No No
1.1 – Column as pinned support 1.2 – Column as reaction distributed to the slab 1.3 – Column as reaction distributed projected at the
geometric center of the slab
2 No Yes
2.1 – Column as pinned support 2.2 – Column as reaction distributed to the slab 2.3 – Column as reaction distributed projected at the
geometric center of the slab
3 1 m No
3.1 – Column as pinned support 3.2 – Column as reaction distributed to the slab 3.3 – Column as reaction distributed projected at the
geometric center of the slab
4 1 m Yes
4.1 – Column as pinned support 4.2 – Column as reaction distributed to the slab 4.3 – Column as reaction distributed projected at the
Figure 18 – Symmetrical flat slab results – Column as pinned support - a – mesh 12,5 x 12,5;
b – mesh 25 x 25;c-mesh 50 x 50; d-mesh 100 x 100 - (PUEL [7])
A
B
The results are shown in graphs, using the Section 1 as reference. The Figure 24 shows the bending moments for the Cases 3.1 / 3.2 / 3.3. The Figure 25 shows the maximum negative bending mo -ments over the P5 column for the Cases 3.1 / 3.2 / 3.3.
It is clearly noted that modeling column as bar directly connected to the plates elements is not an appropriate model. Modeling
column reaction distributed at the cross-section area, however,
smooths the moments over the column´s region. The qualitative results of this model are analogous to the negative moments
smoothed on the supports of continuous beams. Besides, the quantitative results are little dependent on the mesh used, solv -ing the s-ingularity problem.
The Figure 26 shows the bending moments for Cases 4.1 / 4.2 / 4.3.
When using the rigid section at column head to simulate the
col-umn dimensions, in case 4.1, the maximum negative moment
remains dependent on the mesh used (Figure 26).
However, modeling the column reaction distributed at the rigid sec -tions gets the moments smoothed over the column cross-section
and little dependent on the mesh used, as had occurred in the symmetrical structure (Figure 27).
The use of rigid section at column head results bigger bending
moments than compared with models without rigid sections, and there is also a perturbation of moments within de column
cross-section.
Figure 19 – Bending moments – Section 1 - symmetrical flat slab
pqrstuvwxyuz{qzr|}|uz~xurq}z}s|zx uv
2.1/ 2.2/ 2.3
When there is asymmetry on the column position, the loading dia
-gram of the column reaction is not uniform and, therefore, the maxi -mum negative moment to the slab does not occur in the column
cen-ter, as can be observed in Cases 1.2 and 1.3. The moments diagram gets moved in the opposite direction to the column joint spin.
Figure 29 and Figure 30 show the bending moments at the left and right sides of the column P5, respectively.
Figure 21 – Bending moments over column P5 – Cases 1.1/1.2/1.3
Figure 22 – Bending moments – face of column P5 - Cases 2.1/2.2/2.3
The Case 4.1, although has the problem of the singularity, the moments on both sides were consistent. This does not happen in Case 3.1, which also has the singularity problem, but without rigid
section on the column head.
Besides the analyses of slab bending moments, which is inter
-est to the slabs design, analyzing the column bending moments can be of interest, which will later be used for punching check
and column design.
Figure 23 – Asymmetrical flat slab results – Case 3.1 (PUEL [7])
A
C
B
D
In general, the bending moments at the column P5 for Case 4 were greater than those obtained for Case 3, on average 10% higher. The Cases 3.3 and 4.3 resulted in moments higher when com
-pared with the Cases 3.2 and 4.2, respectively. The diference to the mesh of 3,125x3,125cm was 8.0% of Case 3.3 compared to Case 3.2 and 3.0% of Case 4.3 compared to Case 4.2. Therefore, the models with rigid section at column head lead to minor difer
-ences when distributing the column reaction in the cross-section area than the cross-section area column projected at the geomet -ric center of the slab.
Comparing the Cases 3.2 and 3.3 with 3.1 and the Cases 4.2 and 4.3 with 4.1, it can be noticed that the Case 4.1, although having the singularity problem, the column P5 moments are not very diferent from Cases 4.2 and 4.3, which does not happen in Case 3. The rigid section at column head allows adequately model
the column stifness, also observed by ROMBACH [10] (Case “e” Figure 3).
8. 3D Graphics
With computer graphics booming, it’s possible to explore the 3D features in viewing results. In this article in particular, as there are regions with signiicant concentration stress, the 3D views allow a better understanding in these regions behavior as well as the use
of graphics resources to obtain sections of interest.
This type of visualization, often used in image processing, is much better than 2D views.
Thus, 3D graphics will be generated from the data obtained from linear analysis with the help of the following software:
Figure 24 – Bending moments – Asymmetrical flat slab – Section 1 – Cases 3.1/ 3.2/ 3.3
¡
n Global Mapper [6]: software used to render the triangulation.
From the models generated in software SAP 2000 [4] for Case 3, exportsed to the X, Y and Z mesh joints coordinates and imported for the software ArcGIS / ArcMap [5] and Global Mapper [6] . The X and Y coordinates giving the joint position
in plant. The coordinate Z represents the bending moment at each joint mesh. The final product is an Rastes image with pixels of 0.04 cm, generated from points arranged according
actual values.
Figure 26 – Bending moments – Asymmetrical flat slab – Section 1 – Cases 4.1/ 4.2/ 4.3
¢£¤¥¦§¨©ª«§¬£¬¤®¯®§¬°±ª²±³®®§°¦£´µ¶·¶µ°±¶µ¸ª¹§´°£¯¬
occurs, it shows the 3D display bending moments. The graphics will be presented to the Cases 3.1, 3.2 and 3.3 (the column region with
-out rigid section with asymmetry 1 meter), considering the mesh of 25x25 cm, with transition in the column region to 12,5x12,5 cm. In all cases a section was made in the slab (Figure 32), which pass
through the column P5 center (Section 1).
Figure 28 – Bending moments – Region Column P5 – Cases 3.1/3.2/3.3/4.1/4.2/4.3
º»¼½¾¿ÀÁÂÃÄŻƽÆÇ¿¼ÄȻɿʿÇ˻ǼÆÌÆ¿ÇÈÍÎÏ¿ÐÈÐÄÑ¿ÑÌÒ½ÆÇÓÔ
The Figure 33 shows the 3D display of the moments in the direc
-tion X, for Case 3.1, Figure 33a without rendering and Figure 33b with rendering.
The Figure 34 shows the section 1 to Case 3.1.
The Figure 35 shows the 3D display of the moments in the direc
-tion X, for Case 3.2, Figure 35a without rendering and Figure 35b with rendering.
The Figure 36 shows the section 1 to Case 3.2.
The Figure 37 shows the 3D display of the moments in the di
Figure 30 – Maximum negative bending moments - Right face column P5
ÕÖ×ØÙÚÛÜÝÞÚßàÖß×áâáÚßãäããåÚæâçØáßèéÝêëìááÚãÙÖæäçíçäãëçäî
Figure 37b with rendering.
The Figure 38 shows the section 1 to Case 3.3.
The 3D view allows the visualization of the bending moments along the all slab, facilitating detailed analysis of their behavior in the vicinity column region. The results before have allowed a quick
visualization of large stress concentrations in the column region,
and its possible see that the reaction distribution gets smoothed the bending moments.
The use of GIS software allows, besides to obtaining predeter
ïðñòóôõö÷øùúûüýôþÿô ðùÿ ðùõðô÷ðóô ðù
Figure 33 – Graphic 3D – Asymmetrical flat slab – Case 3.1 – Direction X
these sections, which in this case correspond to moments resulting slab sections. These tools may be important for deining criteria for
the design of slab cross sections.
9. Conclusions
The elastic-linear analysis of structures studied showed the use
of suitable modeling to the column x slab connections. The
pro-cedure proposed in this work, distributing the column reaction as a distributed load, was eicient and can be applied easily even in
commercial structural analysis programs.
The modeling used solve the singularity problem can be applied in
both symmetric and asymmetric structures, and it was little sensi
-tive to the mesh variation after a suitable reinement.
The results obtained with the bending moments smoothed over the column allowed an easy understanding of the phenomenon on P5 region, facilitating future decisions to use these results.
The column reaction distributed on the slab in the column cross-section and also the reaction distributed in the column region
pro-jected at the geometric center of the slab, provided a small change in the maximum moment value, and the distribution projected at the geometric center of the slab decreased a little this value, going towards results when models with rigid section at the head column.
The use of rigid sections at the column head could include in the
model, the stifness column efect in this region. The distributed load inclusion provided the best quality results within the column area. However, the values closer to the column face are best suit
-ed to represent the eforts in this region.
When analyzing a model column x slab integrated, in addition to eforts on the slab may be necessary to study the eforts on the columns for punching check and column design.
While the column P5 axial forces in models with or without rigid section, distributing or not the column reaction as loading the slab, present results with little variation between themselves, the bend
-ing moments depends on the model-ing. When it models the column as pinned support and does not consider the rigid section at the
column head (Case 3.1), the results were much smaller for reined mesh within column P5 region. This occur due a lot of elements within the column with small stifness, damaging the slabs-columns connection. These models must be avoided. However, when dis
-tributing the P5 column reaction at the column cross-section area, keeping the column region without rigid sections, the bending mo
-ment in column P5 was low sensitive to the mesh used in both ana
Figure 34 – Section 1 - Asymmetrical flat slab – Case 3.1 – Direction X
A
B
Figure 35 – Graphic 3D – Asymmetrical flat slab – Case 3.2 – Direction X
3.1. When use rigid sections at the column head, in all subcases ofthe Case 4, the bending moment at the column are close to each other, and numerically great than those obtained in the Cases 3.2
and 3.3. By adding rigid elements on the column P5 area made
the slab-column connection present a behavior that takes into ac
-count the correctly stifness of this connection, as showed in Case 4.1: even with the singularity problem, the bending moment at the column P5 showed good results, being also a possible solution. Finally, the bending moments displayed in the slab in 3D graphics
with the help of specialized software for GIS promotes the analysis results. It´s possible to view the bending moments in a spatial form, in all directions. This type of resource may to be important in dein -ing criteria for the slab design.
10. Acknowledgements
Figure 36 – Section 1 - Asymmetrical flat slab – Case 3.2 – Direction X
Figure 37 – Graphic 3D – Asymmetrical flat slab – Case 3.3 – Direction X
geoprocessing programs necessary for the development of this work.
11. References
[1] SKORPEN S. A. & DEKKER N. W. The application and inter
-pretation of liner inite element analysis results in the design
and detailing of hogging moment regions in reinforced
con-crete lat slaps. Technical Paper. Journal of the South African Institution of Civil Engineering. South African, 2014.
[2] CHOI K. K. & KIM J.C., Nonlinear model simulating load-defornation relationship of lat plate structures. Technical Pa
-per. Engineering Structures. South Korea, 2014.
[3] MURRAY K.A. & CLELAND D.J. & GILBERT S. The De -velopment of a non-linear numerical model to simulate the
behaviour of reinforced concrete lat slabs in the vicinity of
edge columns. Technical Paper. Construction and Building
Materials. Belfast, 2005.
Figure 38 – Section 1 - Asymmetrical flat slab – Case 3.3 – Direction X
Software for Structural Analysis and Design. Version 11. USA, 2008.
[5] ArcGis/ArcMap, ESRI - suite of geospatial processing pro
-grams, and is used primarily to view, edit, create, and ana
-lyze geospatial data. Version , 10.2.2. USA, 2013.
[6] Global Mapper, Blue Marble Geographics - Handles both vec
-tor, raster, and elevation data, and provides viewing, conver
-sion, and other general GIS features. Version 16.1. USA, 2013. [7] PUEL, André. Modelagem de lajes planas simétricas e as
-simétricas em concreto armado – Análise integrada laje x pi
-lar. Dissertação de Mestrado. Programa de Pós-Graduação em Engenharia Civil, Universidade Federal de Santa Cata
-rina, 2009. 152 páginas.
[8] ASSOCIAÇÃO BRASILEIRA DE NORMAS TÉCNICAS. NBR 6118:2014 – Projeto de Estruturas de Concreto – Pro
-cedimentos. Rio de Janeiro, 2014.
[9] EUROCODE 2 2003. BS EN 1992-1-1:2003. Design of concrete structures. Part 1-1: General – Rules and rules for buildings. Brussels: European Committee for Standardisation.
[10] ROMBACH, G A. Finite element design of concrete struc
-tures. London: Thomas Telford, 2004.
[11] GLÓRIA, Rodrigo Luz. Estudo do Dimensionamento de Vi
-gas na Ligação com Pilares em Projeto de Estruturas de Concreto, Dissertação de Mestrado. UFSC. Florianópolis, 2003. 113 páginas.
[12] HENNRICHS, Carlos A., Estudo sobre a modelagem de lajes planas de concreto armado, Dissertação de Mestrado. UFSC. Florianópolis, 2003.
![Figure 1 – Distribution of bending moments on a flat slab adapted of SKORPEN ET AL [1]](https://thumb-eu.123doks.com/thumbv2/123dok_br/18861237.417961/2.892.61.834.369.1128/figure-distribution-bending-moments-flat-slab-adapted-skorpen.webp)
![Figure 2 – Strip distribution of bending moments according NBR 6118:2014 [8]](https://thumb-eu.123doks.com/thumbv2/123dok_br/18861237.417961/3.892.63.832.769.1133/figure-strip-distribution-bending-moments-according-nbr.webp)
![Figure 3 – Idealizations of column/flat slab connections (ROMBACH [10])](https://thumb-eu.123doks.com/thumbv2/123dok_br/18861237.417961/4.892.69.828.228.678/figure-idealizations-column-flat-slab-connections-rombach.webp)
![Figure 5 – Column modeled as solid element (HENNRICHS [12])](https://thumb-eu.123doks.com/thumbv2/123dok_br/18861237.417961/6.892.66.828.119.438/figure-column-modeled-solid-element-hennrichs.webp)
![Figure 7 – Comparative FEM/EFM – Section E (PEDROZO [13])](https://thumb-eu.123doks.com/thumbv2/123dok_br/18861237.417961/7.892.68.828.185.686/figure-comparative-fem-efm-section-e-pedrozo.webp)
![Figure 9 – Rigid sections according NBR 6118:2014 [8]](https://thumb-eu.123doks.com/thumbv2/123dok_br/18861237.417961/9.892.73.830.75.286/figure-rigid-sections-according-nbr.webp)
![Figure 11 – Method scheme simulating the column as reaction to the slab (PUEL [7])](https://thumb-eu.123doks.com/thumbv2/123dok_br/18861237.417961/10.892.62.842.58.1133/figure-method-scheme-simulating-column-reaction-slab-puel.webp)
![Figure 13 – Spring stiffness: half column upper and half column down (PUEL [7])](https://thumb-eu.123doks.com/thumbv2/123dok_br/18861237.417961/11.892.64.438.175.489/figure-spring-stiffness-half-column-upper-column-puel.webp)
![Figure 17 – Description of adopted model (PUEL [7])](https://thumb-eu.123doks.com/thumbv2/123dok_br/18861237.417961/12.892.454.826.183.503/figure-description-adopted-model-puel.webp)