A machine learning approach to identify and prioritize college
students at risk of dropping out
Artur Mesquita Barbosa1, Emanuele Santos1, Jo˜ao Paulo P. Gomes1
1Departamento de Computac¸˜ao
Universidade Federal do Cear´a (UFC) – Fortaleza – CE – Brazil
{artur,emanuele,jpaulo}@lia.ufc.br
Abstract. In this paper, we present a student dropout prediction strategy based
on the classification with reject option paradigm. In such strategy, our method classifies students into dropout prone or non-dropout prone classes and may also reject classifying students when the algorithm does not provide a reliable prediction. The rejected students are the ones that could be classified into either class, and so are probably the ones with more chances of success when subjected to personalized intervention activities. In the proposed method, the reject zone can be adjusted so that the number of rejected students can meet the available workforce of the educational institution. Our method was tested on a dataset collected from 892 undergraduate students from 2005 to 2016.
1. Introduction
The reduction of the student dropout rate is one of the biggest challenges faced by educa-tors in their institutions. In Brazil, the student dropout causes a loss of public resources in federal universities and produces a lack of skilled workers, which impacts negatively on the country’s development [Silva Filho et al. 2007].
The Brazilian Ministry of Education (MEC) defines evasion as “the departure of a student from his or her undergraduate program of origin, without graduating” [MEC 1995, pp. 15]. There have been many works that aim to understand and to predict evasion using data collected from students and courses. Their goals consisted in dividing the students into two groups: those who are at risk of evading the program and those who will probably graduate. Unfortunately, this information is not enough for educators to make interventions on the students at risk. First of all, there are a few reasons for the evasion, such as personal and social issues [Aparecida et al. 2011], which are out of the institution’s scope. Also, the number of students considered at risk may be too large for the university’s limited human resources, and so that there should be a way to select the students most likely to dropout, but with more chances to stay in the program with some counseling.
The Computer Science program at the Federal University of Cear´a (UFC) achieved one of the highest scores in the 2014 edition of the ENADE – an exam that evaluates the quality of Brazilian undergraduate programs [Brasil 2015, pp. 75]. Despite the program’s excellence, its average dropout rate between 2005 and 2015 was about
Figure 1. Dropout rate by year of Computer Science students at UFC who were admitted by entrance examination or by ENEM. The blue area indicates the num-ber of admitted students and the orange area indicates the numnum-ber of these stu-dents that eventually dropped out.
Figure 1 shows the dropout rate of the students in the Computer Science’s 2000.1 curriculum, from 2005 to 2015. Despite having a few fluctuations, it depicts an upward trend starting in 2009. The class of 2012 was considered the worst with relation to evaded students, showing that more than 50% of the students dropped out.
The purpose of this paper is to use a data mining technique that classifies these students into two groups, as explained before, but rejecting those with great probability of misclassification by the algorithm. Since the choice between dropout prone or non-dropout prone classes is uncertain for the rejected ones, they may probably succeed if subjected to an intervention process and remain on the program until their graduation. In this experiment, data has been collected from 892 Computer Science students, from 2005 to 2016.
The paper is organized as follows: in Section 2, we discuss and review the related literature. In Section 3, we introduce the classification with reject option methods. We then describe the collected dataset and the methodology we used in Section 4. In Section 5 we discuss our experiments and our results before concluding with future directions in Section 6.
2. Related Work
Most of the papers about identifying the students at risk of evading or retaining used white box algorithms that performed a binary classification between dropout prone or non-dropout prone students. Such methods are very important to clearly see which attributes lead to that behavior [Roberto and Adeodato 2012, Balaniuk et al. 2011, Tamhane et al. 2014, M´arquez-Vera et al. 2013, Lakkaraju et al. 2015, Costa et al. 2015, de Brito et al. 2014, Maria et al. 2016, Kantorski et al. 2016, Pascoal et al. 2016].
dis-covered how soon the retention could be detected, so that the educators could intervene and avoid it. According to the authors, this could save up to 5 million dollars of the university’s resources. Also, the prediction resulted in an area under the ROC curve of 0.84, which is a good result.
In another work, a framework was created to predict the risk of retention in High School [Lakkaraju et al. 2015]. The researches tested it on a dataset of 200.000 students from two U.S. school districts, containing their grade averages, absence rates, social and demographic informations, etc. But these districts had limited resources, so the students were ranked to select the most risky ones. The approach used the confidence estimates provided by the following algorithms: Random Forest, Adaboost, Logistic Regression, SVM and Decision Tree. The experiments showed that Random Forest had the best re-sults. Our approach differs in the way we generate our confidence estimates, which is by minimizing the risk of misclassification (explained in Section 3).
Another work used Bayesian Network to predict dropout on a technical school in Brazil called SENAI [Maria et al. 2016]. A network was modeled with the supervision of two of its Faculty members, selecting the most important attributes to calculate the chances of evading the school. Then, the algorithm is applied to do a binary classifica-tion as a candidate to dropout or not. The results were displayed on a Web page for each student containing the academic information, probability of evading and the student’s sit-uation compared to others. There is no ranking of the most at risk, which makes it difficult to prioritize the interventions on them. Our approach makes it possible for rejecting only a certain number of students that could be attended by the available educators.
3. Classification with reject option
Classification with reject option comprises a set of techniques to improve classification results in decision support systems. Roughly speaking, it consists in avoiding to classify an unseen instance x, if the decision is considered not sufficiently reliable so that the
rejected instance can then be handled by a different classifier, or manually by a human.
As mentioned before, in possession of a “complex” dataset, every classifier is bound to misclassify some data samples. Depending on the costs of the errors, misclas-sification can degrade the classifier’s performance. Therefore, techniques in which the classifier can abstain from providing a decision by delegating it to a human expert (or to another classifier) are very appealing. In the following, we limit the discussion of reject option strategies to the binary classification problem. For that, we assume that the problem involves only two classes, i.e., whenN = 2, henceforth referred to as{C1,C2}. However, the classifier must be able to output a third class, the reject one{C1,CReject,C2}).
The implementation of reject option strategies requires finding a trade-off between the achievable reduction of the cost due to classification errors, and the cost of handling rejections (which are application-dependent). Thus, Chow [Chow 1970] proposed to de-sign classifiers by minimizing the empirical risk, defined as
b
R=E+αR (1)
advance by the user). It is worth highlighting that a lowαleads to a classifier that rejects many patterns, thus decreasing its error rate. A high value forα, on the other hand, leads to a classifier that rejects few patterns which, in turn, increases its error rate.
The design of classifiers with reject option can be systematized in three different approaches for the binary problem:
1. Method 1: It involves the design of a single, standard binary classifier. If the clas-sifier provides some approximation to the a posteriori class probabilities,P(Ck|x),
k = 1,2, then a pattern is rejected if the largest value among the posterior prob-abilities is lower than a given threshold. For this method, the classifier is trained as usual and the rejection region is determinedafterthe training phase, heuristi-cally or based on the optimization of some post-training criterion that weighs the trade-off between the costs of misclassification and rejection.
2. Method 2: It requires the design of two, independent, classifiers. A first classi-fier is trained to output C1 only when the probability of C1 is high and a second classifier trained to outputC2 only when the probability ofC2is high. When both classifiers agree on the decision, the corresponding class is output. Otherwise, in case of disagreement, the reject class is the chosen one. The intuition behind this approach is that if both classifiers have high levels of confidence in their deci-sions then the aggregated decision should be correct in case of agreement. In case of disagreement, the aggregated decision is prone to be unreliable and hence the rejection would be preferable [Sousa et al. 2009].
3. Method 3: It involves the design of a single classifier with embedded reject op-tion; that is, the classifier is trained following optimality criteria that automati-cally take into account the costs of misclassification and rejection in their loss functions, leading to the design of algorithms specifically built for this kind of problem [Fumera and Roli 2002, Sousa et al. 2009].
4. Methodology
The proposed methodology can be divided in two steps: data collection and classifier design. In the first step we collect social and academic data from a set of computer science students. Using such dataset, we designed a classifier with reject option where a Feedforward Neural Network with Random Weights (FNNRW) [Schmidt et al. 1992] was used as a base learner.
4.1. Dataset description
We collected a dataset of 892 students from the Computer Science program at UFC, from 2005 to 2016, enrolled in the 2000.1 curriculum. Some of the students were left out because they changed programs or they changed to the new 2016.1 Computer Science curriculum. The dataset was obtained in collaboration with the computer science depart-ment and with the director of Undergraduate Studies in Computer Science at UFC.
Table 1. Description of the data attributes collected from each Computer Science student at UFC.
Attribute Type Description
Time int Time in seconds from the neighborhood to the campus (calculated by Google MapsR). Gender int Gender of the student: 1 for Male, 2 for Female.
Mobility int The student participated in international academic mobility: 1 for yes, 0 for no. Age int Student’s age at the admission.
Admission Method int Admission method of the student: ENEM, entrance exam, transferred from another institution, etc.
Readmission int
1 if the student was admitted again (by the entrance exam or by ENEM), 0 otherwise.
(It’s possible for an active or an evaded student to be readmitted in the same program and in this case all his or her failed records will be erased from the transcript).
Attendance rate float Attendance rate in first semester.
GPA float Partial GPA of the first and second semester (GPA is the weighted arithmetic average of the grades, where the weights are the courses’ credits).
Course Status int Status of the mandatory courses of the first year: 0 for fail, 1 for passed. Student status int Student’s status at the university: 1 for graduated, 2 for dropped out, 3 for active.
We decided to work only with the students’ first year information because the eva-sion rate in this period is two to three times higher than the following years, not only in Brazil, but all over the world [Silva Filho et al. 2007]. In fact, we confirmed this behavior in our data for those admitted by ENEM, as demonstrated in Figure 2. Also, it is im-portant to detect the risk of evasion as early as possible, so educators can do appropriate interventions quickly.
Figure 2. Dropout rate by semester of Computer Science students at UFC who were admitted by entrance examination (orange line) or by ENEM (purple line).
Finally, we tested the algorithm with 32 students admitted in 2015, so that the program director could validate our method with a very recent example.
4.2. Classifier Design
In this work, we used the aforementioned Method 2 to generate classifiers with reject option. When choosing such an approach, we considered two main aspects: classifier adaptation and classification performance. The first criterion is related to the easiness of using any classifier as the base classifier of our method. In this sense, Method 3
is the worst choice since the formulation of the classifier has to be modified. In both
We selected the Feedforward Neural Network with Random Weights (FNNRW, [Schmidt et al. 1992]) as the base learner. The FNNRW is a Perceptron based neural network that randomly assigns the weights of its hidden layer. After that, the weights of the output layer are estimated using Ordinary Least Squares. The method is widely used because of its simple formulation and remarkable performance in various applications.
The adaptation of the standard FNNRW to Method 2 is achieved by using a weighted cost function, where the weights are chosen according to the class of each train-ing example. With this modification, two FNNRWs can be trained and each of them is biased to one of the classes. This characteristic is essential to the design of a reject op-tion classifier according toMethod 2. The adaptation used in this work was proposed by [Mesquita et al. 2016] and further details can be found in that paper.
5. Experiments and Results
As a first step, we conducted an experiment where several popular machine learning meth-ods are used in the dropout prediction task. Note that in this initial test, no reject option is included in any method. The goal of the test is to verify if dropout-prone students can be identified by using the features presented in Section 4.1, along with classification algorithms.
In this experiment, the dataset was randomly split into training (2/3of the dataset) and testing (1/3of the dataset). The whole test was repeated ten times and the average accuracies are shown in Table 2.
Table 2. Performance of several classifiers in dropout prediction.
Classifier Accuracy (%)
FNNRW 86.37
MLP 86.43
SVM 88.32
Naive Bayes 85.82
K-NN 84.12
The results presented in Table 2 show that any classifier can correctly identify dropout prone and non-dropout prone students in at least84%of the cases. We can also notice that FNNRW had the second best performance, being outperformed only by Sup-port Vector Machine (SVM). It is worth emphasizing that our objective is not to advocate in favor of FNNRW, but to show that any classifier can achieve good results.
To verify the impact of the reject option, we conducted tests varying the rejection costα. For eachαvalue we chose the classifier that minimizes the risk of misclassification
b
R. By doing so, our algorithm is designed to classify a student only when the probability and incorrect classification is minimized.
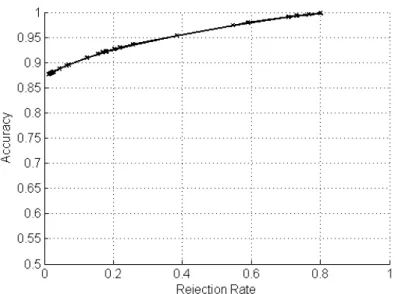
Figure 3. Accuracy Rejection curve for the FNNRW with reject option in the dropout prediction problem.
According to the A-R curve, we can notice that the accuracy of our method in-creases with the number of rejections. Such an accuracy improvement is expected since increasing the rejection rates turns the algorithm to be more conservative, only classifying students when the degree of certainty is very high.
Another interesting point regarding our approach is that the rejected students are the ones that are difficult to predict whether they are going to leave the program or not. In the current setting, one can suppose that students classified as dropout prone are the ones that will almost certainly leave the program. Non-dropout prone students are probably doing well and may conclude their studies, and the reject students comprise a risky class, where the effort of advisors and educators can possibly lead to good results. To validate this hypothesis, we used a trained classifier with a reject option of20%in a dataset com-prising students that started the course in2015. A subset of32students was used in our experiments. Under the described conditions, the classifier achieved an accuracy of71%. Detailed results are presented in the confusion matrix in Table 3.
Table 3. Confusion Matrix of the 32 students admitted in 2015 classification.
ACTIVE DROPOUT
ACTIVE 9 0
DROPOUT 8 11
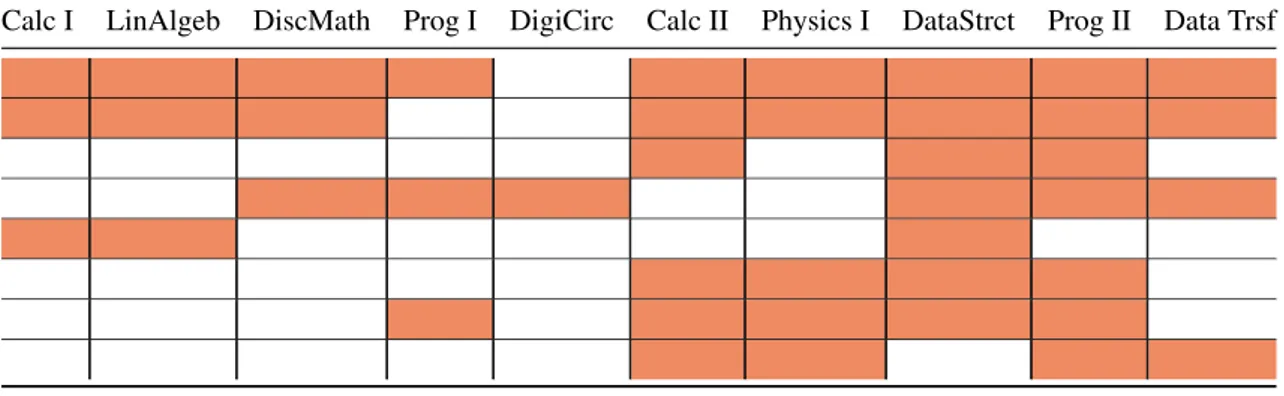
Table 4. Misclassified students’ performance in their first year. Each row repre-sents a student, and each column reprerepre-sents a course. A cell is colored orange if the student failed that course, otherwise it is colored white.
Calc I LinAlgeb DiscMath Prog I DigiCirc Calc II Physics I DataStrct Prog II Data Trsf
Table 5. Rejected students’ performance in their first year. Each row represents a student and each column represents a course. A cell is colored orange if the student failed that course, otherwise it is colored white.
Calc I LinAlgeb DiscMath Prog I DigiCirc Calc II Physics I DataStrct Prog II Data Trsf
As can be seen, all students failed at least 3 courses. We can suppose, considering this situation, although these students are still active, they have a high dropout probability. In contrast with this result, we can verify the same features for the4students that were rejected by our method. The data in Table 5 show that, in most cases, the student failed in less courses and may have higher chances to stay in the program.
A deeper analysis on rejected students’ data shows some interesting cases. Some of these students were readmitted at this year by using their ENEM scores, so that the failed courses are erased from the university’s record and they were able to transfer the credits from the courses they passed. This is a strategy to gain more time to stay in the program, erasing their bad records and earning opportunities such as getting a scholarship, which would not be available to the students with a certain number of failed courses. Furthermore, the rejected students have an attendance rate average higher than the ones classified as dropout prone, which indicates their effort to graduate.
6. Conclusion
This work presented a new approach to the problem of evading students, classifying in three groups: the ones who will certainly get their diploma, the ones who will certain drop out of college and the ones whom we are not sure about their future. It gives the possibility to advisors and educators to follow more closely the students who are trying to finish the course, but for some personal or any other problem, are not getting good grades, and, in turn, can be a trigger to drop out.
into two groups and rejected those students that are not clear in which group they should belong to. We validated our approach with the Rejection curve. Also, the hypothesis about the rejected students to be the ones who might need counseling was verified ap-plying our approach on a sample of 32 students from the 2015 class, followed by a deep analysis using their academic data. This is a different approach is different from all the aforementioned approached, since we didn’t make the usual binary classification, neither got the ones with the greatest probability of evading. We believe our approach is very use-ful for programs with limited human resources, providing a way to prioritize the students that need intervention.
As future work, we are planning on acquiring other datasets in our institution to see if the same behavior observed in the Computer Science students is also present in other programs. We also plan on devising a more thorough study to follow the rejected students for a year and see if we obtain positive results.
References
Aparecida, C., Baggi, S., and Lopes, D. A. (2011). EVAS ˜AO E AVALIAC¸ ˜AO INSTITU-CIONAL: UMA DISCUSS ˜AO BIBLIOGR ´AFICA.
Balaniuk, R., Antonio Do Prado, H., Da Veiga Guadagnin, R., Ferneda, E., and Cobbe, P. R. (2011). Predicting evasion candidates in higher education institutions. InLecture Notes in Computer Science (including subseries Lecture Notes in Artificial Intelligence and Lecture Notes in Bioinformatics), volume 6918 LNCS, pages 143–151. Springer Berlin Heidelberg.
Brasil (2015). Portaria no564, de 18 de dezembro de 2015, anexo i. Di´ario Oficial [da] Rep´ublica Federativa do Brasil. Sec¸˜ao 1, p. 75.
Chow, C. (1970). On optimum recognition error and reject tradeoff. IEEE Transactions on Information Theory, 16(1):41–46.
Costa, F., Silva, A. R. d. S., de Brito, D. M., and do Rˆego, T. G. (2015). Predic¸˜ao de sucesso de estudantes cotistas utilizando algoritmos de classificac¸˜ao. Anais do Simpo-sio Brasileiro de Inform´atica na Educac¸˜ao, 26(Sbie):997.
d. Oliveira, A. C., Gomes, J. P. P., Neto, A. R. R., and d. Souza, A. H. (2016). Efficient minimal learning machines with reject option. In 2016 5th Brazilian Conference on Intelligent Systems (BRACIS), pages 397–402.
de Brito, D. M., J´unior, I. A. d. A., Queiroga, E. V., and do Rˆego, T. G. (2014). Predic¸˜ao de desempenho de alunos do primeiro per´ıodo baseado nas notas de ingresso utilizando m´etodos de aprendizagem de m´aquina. Anais do Simp´osio Brasileiro de Inform´atica na Educac¸˜ao, 25(1):882–890.
Fumera, G. and Roli, F. (2002). Support vector machines with embedded reject option. InProceedings of the 1st International Workshop on Pattern Recognition with Support Vector Machines (SVM’2002), pages 68–82. Springer.
Lakkaraju, H., Aguiar, E., Shan, C., Miller, D., Bhanpuri, N., Ghani, R., and Addison, K. L. (2015). A Machine Learning Framework to Identify Students at Risk of Adverse Academic Outcomes. KDD ’15 Proceedings of the 21th ACM SIGKDD International Conference on Knowledge Discovery and Data Mining, pages 1909–1918.
Maria, W., Damiani, J. L., and Pereira, M. (2016). Rede Bayesiana para previs˜ao de Evas˜ao Escolar. Anais dos Workshops do Congresso Brasileiro de Inform´atica na Educac¸˜ao, 5(1):920.
M´arquez-Vera, C., Cano, A., Romero, C., and Ventura, S. (2013). Predicting student failure at school using genetic programming and different data mining approaches with high dimensional and imbalanced data. Applied Intelligence.
MEC (1995). Comiss˜ao especial de estudos sobre a evas˜ao nas universidades p´ublicas brasileiras. ANDIFES/ABRUEM, SESu, MEC, Bras´ılia, DF.
Mesquita, D. P., Rocha, L. S., Gomes, J. P. P., and Neto, A. R. R. (2016). Classification with reject option for software defect prediction. Applied Soft Computing, 49:1085 – 1093.
Pascoal, T., Brito, D. M. d., Andrade, L., and Rˆego, T. G. d. (2016). Evas˜ao de estudantes universit´arios: diagn´ostico a partir de dados acadˆemicos e socieconˆomicos. Brazil-ian Symposium on Computers in Education (Simp´osio Brasileiro de Inform´atica na Educac¸˜ao - SBIE), 27(1):926.
Roberto, H. and Adeodato, P. J. L. (2012). A data mining approach for preventing un-dergraduate students retention. IEEE World Congress on Computational Intelligence, pages 1–8.
Schmidt, W. F., Kraaijveld, M. A., and Duin, R. P. W. (1992). Feedforward neural net-works with random weights. In Proceedings., 11th IAPR International Conference on Pattern Recognition. Vol.II. Conference B: Pattern Recognition Methodology and Systems, pages 1–4.
Silva Filho, R. L. L. e., Motejunas, P. R., Hip´olito, O., and Lobo, M. B. D. C. M. (2007). A evas˜ao no ensino superior brasileiro. Cadernos de Pesquisa, 37(132):641–659.
Sousa, R., Mora, B., and Cardoso, J. S. (2009). An ordinal data method for the classifi-cation with reject option. InProceedings of the International Conference on Machine Learning and Applications (ICMLA’09), pages 746–750.