A Work Project presented as part of the requirements for the Award of a Masters Degree in Economics from the Nova School of Business and Economics.
Returns to Vocational Education in Portugal
Sofia Carina dos Santos Oliveira Student Number 552
A project carried out on the Applied Policy Analysis major, under the supervision of: Ana Balcão Reis, Maria do Carmo Seabra and Luís Catela Nunes
Returns to Vocational Education in Portugal
Abstract
In a context of increasing investment in vocational education, it is highly relevant to investigate the impact of this type of education over labor market outcomes. Following a panel of individuals with upper secondary attainment born between January 1974 and December 1990, this study assesses the wage returns to vocational education and general education, between 1993 and 2009. Estimates from a random effects model revealed a wage advantage for workers with vocational education vis-à-vis workers with general education, in the beginning of the career. However, the earnings of the former group grow at a slower rate and are surpassed by the earnings of the latter group at around eight years of experience.
JEL classification: I21, J31
Keywords: Human Capital, Vocational Education, Returns to Education, Wage Differentials
Acknowledgments
The author would like to thank Professors Ana Balcão Reis, Maria do Carmo Seabra, Luís Catela Nunes and José Mata. Comments by Pedro Freitas and Marta Lopes are also appreciated.
1
1. Introduction
According to the OECD “[v]ocational education and training (VET) includes education and training programmes designed for, and typically leading to, a particular job or type of job. It normally involves practical training as well as the learning of relevant theory” (OECD, 2009).
Many authors have discussed the advantages of this type of education. Since it equips students with skills that are valued and required by firms, vocational education1 eases the transition from school to the labor market and potentially increases youth employment. In addition, it helps to avoid school dropouts by serving as an alternative path and perhaps a more motivating one for low-achievement students. (Kulik, 1998; Neuman and Ziderman, 1999; Wolter and Ryan, 2011; Cörvers et al., 2011; Hanushek, 2012).
Nevertheless, Krueger and Kumar (2004) stress that education systems strongly based on
“skill-specific” knowledge, as opposed to “concept-based” knowledge, may shape a less flexible
labor force and lead to a lower country’s growth rate in an era of rapid technological change2. In Portugal, the Memorandum of Understanding signed in May 2011 commits the Government to tackle the low qualifications of human capital and “facilitate labor market matching”. Its intention is to boost the “attractiveness and labor market relevance of vocational education and training”. Particularly, one of the targets is to increase the number of students in job-oriented tracks in upper secondary from about 40% in 2012 to 50% in a near future3.
In this context, it is highly relevant to investigate the impact of vocational education over labor market outcomes in the last decades. Hence, this study assesses how students’ investments in differentiated types of education have been paying off in the labor market, from an earnings
1 In this report, the terms “vocational education” and “job-oriented tracks” are used interchangeably, as opposed to
“general education” or “academic track” (see table A.1 in the appendix for the English-Portuguese translations of the terms used in this report).
2 According to the authors, this explains why the US (essentially based on general education) grew more than Europe
(strongly focused on vocational education) in the eighties and nineties.
2 perspective. Particularly, I address the following questions. First, is there a wage premium to vocational education vis-à-vis general education when entering the labor market? And second, in the presence of such wage advantage, does it dissipates over the worker's lifecycle? Answering both questions will enable the derivation of wage-experience patterns for two groups of workers, one with vocational and the other with general education.
This report is structured as follows. Section 2 links this study to the human capital theory and surveys the relevant literature. Section 3 provides a review of the Portuguese education system, from 1960 to 2004, detailing the evolution of job-oriented tracks. The dataset is presented in section 4, as well as a brief analysis of the data. Section 5 explains the econometric procedure and the relevant findings whilst section 6 derives the policy implications, suggests avenues for further research and concludes the report.
2. Literature Review
Literature on individuals’ returns to education focuses on two main lines of investigation: employment and earnings. The earnings approach is nevertheless the most classic one due to the earnings function popularized by Mincer (1974). Moreover, it relates to the seminal work by Becker (1964) where the author develops the human capital theory, firstly introduced by Schultz (1961). This theory establishes schooling and training as investments through which individuals acquire the necessary skills to become more productive in the labor market (Schultz, 1961; Becker, 1964).
3 alignment. Then, the quality of the match rises due to on-the-job training4 and continuous long-life learning. Therefore, wages increase over time, even though at a decreasing rate (Becker, 1964).
Given the relation between education and the labor market, it is reasonable to expect different
types of education to yield different returns. As noted by Weber and Falter (2011), “workers with
a different educational background possess a different kind of human capital, which leads to a
different pattern of wage growth”. Additionally, job-oriented streams may serve as ability signals
in a labor market characterized by asymmetric information, thus representing a wage gain for vocationally educated workers at the beginning of their career (Wolter and Ryan, 2011).
In this literature, a common concern across all studies regards self-selection. Concerning ability, socioeconomic background and aspirations, students who chose job-oriented tracks are likely to differ from those who followed general education (Kulik, 1998; Meer, 2007; Cörvers et al., 2011). Accordingly, Cörvers et al. (2011) stress that “the unobserved heterogeneity may play a role for both the decision to follow a vocational or general educational track and the subsequent
earnings profile”. Consequently, in the absence of natural experiments5, the potential bias posed
by unobserved heterogeneity requires econometric controls6 (Wolter and Ryan, 2011).
Another common feature to all studies on the returns to different types of education is the
inclusion of firms’ characteristics in order to control for selection into some categories of jobs and
firms; for instance, the working field, occupation, firms’ location, bargaining agreement and firms’ size (Neuman and Ziderman, 1999; Pereira and Martins, 2001). Wolter and Ryan (2011) explain
4 Wolter and Ryan (2011) provide an extensive revision on firms’ incentive to finance training to their workers.
5 In Romania, Malamud and Pop-Eleches (2010) studied a natural experiment of an educational reform in 1973. Using a
regression discontinuity model the authors found that having augmented the general component of vocational courses “did not cause an increase in labor market participation or earnings”. In the Netherlands, Ooosterbeek and Webbink (2007) also investigated a natural experiment, employing a difference-in-difference approach. After a reform in 1975 all vocational courses became of four years length but the authors estimated no effect of an extra year over wages of students subject to the reform.
6 Bishop and Mane (2004) offer a comprehensive list of such controls; namely, the number of years failed, a dummy for
4
that “apprenticeship might be superior to other forms of learning for particular skills and
occupations, but inferior for others”, so models must account for “occupation-specific factors”. A cross-country analysis reveals that the existence of differentiated returns to different types of education is not a global and consensual phenomenon. In Austria, Fersterer, Pischke and Winter-Ebmer (2008) showed that workers coming from apprenticeship courses can earn up to 12% more than generally educated workers. Whilst in Israel, Neuman and Ziderman (1999) estimated wage returns of about 8% higher for workers with vocational education but only if the working field is related to the vocational course pursued.
Hanushek, Woessman and Zhang (2011) studied a cross-section of 18 countries. Estimates of a Mincer earnings function revealed that vocationally educated workers have an initial wage advantage (wages are 15.5% higher) but generally educated ones catch up as they become older and end up earning more7. Cörvers et al. (2011) investigated this topic in the UK, Germany and Netherlands. The authors estimated a mixed-effects linear regression model and found higher initial earnings for vocational education in both Germany and UK (of about 10% and 5%, respectively). However, wages for generally educated individuals grow faster and surpass those of vocationally educated ones at six years of labor market experience. The authors argue that
“general education focuses relatively more on general knowledge and problem solving skills,
which could lead to higher learning abilities throughout working life”. For the Netherlands,
coefficients on initial and subsequent earnings are both statistically insignificant.
Because Hanushek, Woessman and Zhang (2011) and Cörvers et al. (2011) are interested in the wage-age and wage-experience patterns, respectively, these are the main references for my work. Cörvers et al. (2011) is of particular importance given the panel nature of the dataset used.
7 Using a sample of countries that in the dataset had at least 40% of workers with vocational education: Belgium, Check
5 Previous research for the Portuguese labor market is, to my knowledge, very scarce. Only Pereira and Martins (2001) estimated the returns to different education levels and tracks in a Mincer earnings function, using the dataset Quadros de Pessoal over the period 1982-1995. The authors concluded that over the time period observed “a lower secondary technical degree pays
always more than its academic counterpart”. Regarding upper secondary, data on differentiated
tracks was only available for 1994 and 1995, and in both years the obtained coefficients were higher for vocational education.
Another stream of the literature focuses on the returns to training. That is, beyond individuals’ educational attainment, some authors were interested in estimating the impact of participating in different types of vocational training whether in school or during the working life. Saraiva (1999) based his work on the Portuguese Labor Force Survey (last quarter of 1996) and Hartog, Pereira and Vieira (2000) used the 1994’s wave of the European Community Household Panel. Both papers concluded that vocational training in training centers, vocational schools and apprenticeships do not yield a wage advantage relative to individuals without training. Conversely, there is a positive and high impact of receiving training in a firm – a result corroborated later by Budría and Pereira (2007), who used the Portuguese Labor Force Survey from 1998 to 2000.
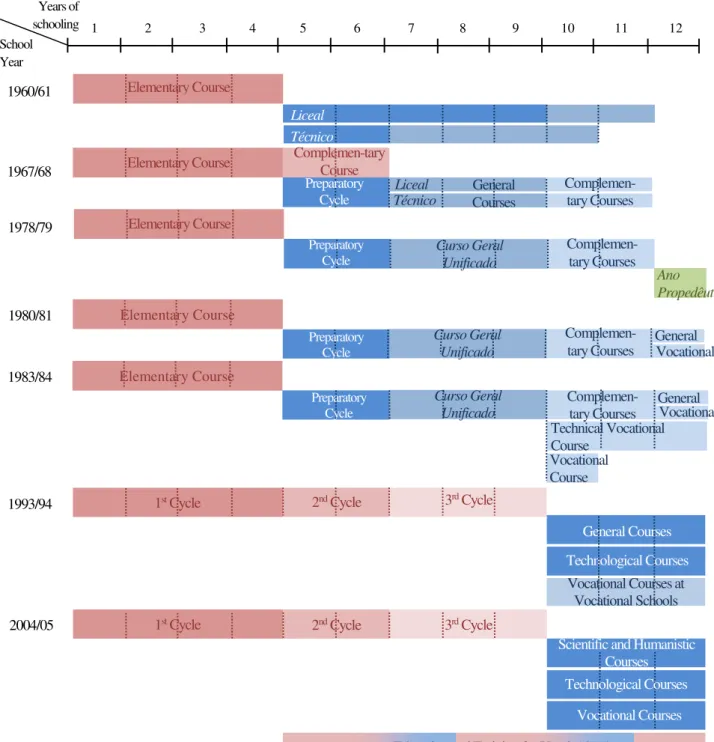
3. The Portuguese Education System
By 1960, mandatory schooling was four years of primary education and for those wanting to pursue their studies at the secondary level two tracks were available: ensino liceal and ensino técnico8. The former was mainly available in urban areas thus accessible by privileged social classes, and was largely oriented towards higher education. The latter targeted mostly students
8 By that time, secondary education (starting after four years of schooling) could last for a maximum of seven years.
Pereira and Martins (2001) explain that ensino liceal consisted of a first cycle of five years and a second cycle of two years, after which students could apply for universities. Ensino técnico, the “labour-market focused stream”, had a first
6 leaned to learn an occupation and was seen as less prestigious given the lower social status of its students. This partition provided very different educational experiences for its students, hence jeopardizing the principle of equality of opportunities.
In 1973, the Veiga Simão’s Reform introduced the idea that education should be made accessible for everyone on a meritocratic basis, hence irrespective of one’s socioeconomic background. Albeit this reform had not been fully enforced due to the Revolution of April 25th 1974, it promoted a turning point in education policy in the seventies (Stoer, 1982). Accordingly, in 1975 ensino técnicowas abolished since “[t]his branch of the education system was regarded as
incompatible with the revolution goals of equality” (Pereira and Martins, 2001). Around this time
ensino técnico “was relegated to a residual evening course” (Cerqueira and Martins, 2011).
Nevertheless, two attempts to reintroduce vocational studies in the system were made in the eighties. The first took place in 1980, upon the creation of the 12th grade9. Two streams were made available: a general and a vocational one10. However, the demand for the vocational stream fell
short of expectations and was considered a “tremendous failure” (Grácio, 1986). The second was
in 1983. A pilot experience shaped by the Seabra’s Reform added two job-oriented tracks in upper secondary: a three-year technical vocational course and a one-year vocational course. Nonetheless, these courses were not very successful (Azevedo, 1988). Pereira and Martins (2001)
argued that “the academic path was overwhelmingly preferred by prospective upper secondary
students”. All in all, despite these two attempts to reintroduce ensino técnico, vocational education
became nearly absent after 1975.
The system’s structure as we know it today was setup in 1986 in Lei de Bases do Sistema
Educativo (Law 46/86 October 14th). Compulsory schooling increased to nine years of basic
9
The 12th grade (final year of upper secondary education) was created in replacement of ano propedêutico, the first year
of higher education studies.
7 education, from 1st to 9th grade11. Upper secondary education, from 10th to 12th grade, stipulated two alternative routes: courses geared towards further studies (labeled general courses, and later renamed scientific and humanistic courses) and those geared for working life (named technological courses).
However, the landmark for vocational education in Portugal occurred later, in January 1989, through the creation of fifty vocational schools, following a commitment to enlarge and diversify the provision of education. These were mainly private schools financially supported by both the Government and the European Union. The courses offered by these schools, called vocational courses of level III, certified equivalence to the 12th grade and professional qualification of level III12. In the literature, the creation of vocational schools is seen as the renascence of vocational education in Portugal. Moreover, these schools played an essential role in launching job-oriented streams as credible avenues for the completion of upper secondary (Cerqueira and Martins, 2011).
In the beginning of the new century, Government’s priority was to tackle a worrying rate of
school dropouts and academic underachievement. In particular, it was crucial to assure a soften transition from school to the labor market and to prevent students from leaving the education system early and without the necessary skills to succeed in the labor market. Therefore, the education and training courses for youth (or CEF) were created. These courses provided professional qualification of level I, II or III and equivalence to the 6th, 9th or 12th grade, respectively.
Meanwhile, the demand for vocational courses of level III had been increasing in excess of vocational schools’ capacity (ANESPO, 2003). Consequently,these courses were integrated in
11 Divided in three sequential cycles: first cycle, from 1st to 4th grade; second cycle, 5th and 6th grades; and third cycle (or
lower secondary education), from 7th to 9th grade.
12 See table A.2 in the appendix for the correspondence to Quadro Nacional de Qualificações, a national framework that
8 public high-schools in 2004, thus materializing another milestone for this type of education in Portugal. Technological courses were progressively reduced in the subsequent years.
Recent data, from the school year 2011/1213, reveals that job-oriented tracks account for about 40% of the students enrolled in upper secondary and 10% of those enrolled in lower secondary.
To conclude this review on the Portuguese education system it is relevant to note that its possibilities are not all displayed here. This analysis is neglecting the apprenticeship courses14 and the education and training for adults (or EFA)15. Such courses are designed for those who have left the education system and want to return later in life in order to complete a given schooling level (often conciliating studies with a career).
A simplified version of the system is presented in the appendix in figure A.1, while an overview of the Portuguese legislation in education matters can be found in table A.3.
4. Data and Methodology
The dataset used in the empirical study is Quadros de Pessoal, a matched employer-employee dataset based on a survey fulfilled every year since 1982 (except 1990 and 2001) by firms with at least one wage earner. The information available in this dataset is therefore immense. On the
workers’ side I used data on earnings, gender, age, experience, tenure, the type of education
(whether vocational or general), the hours worked per week and the hierarchy level within the
firm. On the firms’ side I used data on the region where the firm is located, the business industry,
the ownership (the share of capital stock that is public, private and national or foreign), the number of branches, the number of employees and sales in Euros.
13 DGEEC/MEC. Estatísticas da Educação 2011/12.
14 These were created in 1984 under the wing of IEFP (Institute of Employment and Vocational Training), an institute of
the Ministry of Employment.
9 The selected sample focuses on individuals with upper secondary attainment, since the main reforms of vocational education after the Revolution of 1974 targeted precisely this education level. Moreover, this strategy restrains the sample to individuals with the same schooling level as a way to increase similarity in terms of ability16.
As explained in section 3, the renascence of vocational education in the post-revolution period occurred in 1989 upon the creation of the vocational schools. Thenceforth, vocational studies expanded rapidly. As a result, the first cohort of students to have obtained a vocational diploma entered the labor market no sooner than the second half of 1992, and no older than 18 years old, have they completed their education in due time. Nevertheless, admitting that students may have failed one year or that recent graduates may dedicate a certain period of time to job-search, I will assume that the first cohort is expected to be observed in the labor market by 1993, and thus with 19 years old. Consequently, applying the same reasoning in every subsequent year, the selected sample is narrowed to individuals born between January 1974 (with 19 years old in 1993) and December 1990 (with 19 years old in 2009). Such panel is therefore an unbalanced one, since individuals born in 1974 can potentially be present in all 17 years of analysis, while those born in proceeding years are observed in a shorter time span.
In summary, I will follow a panel of individuals with upper secondary attainment born between January 1974 and December 1990, between 1993 and 2009. Keeping only the observations with positive earnings, the selected sample accounts for 1,794,272 observations representing 633,549 individuals17.
Table 1 reports the descriptive statistics. 86.63% of the individuals followed a general track in upper secondary while the remaining ones, 13.37%, followed a job-oriented stream. The share of women is larger in the former group (52.66% and 46.61%, respectively) and the average labor
16 A similar argument was provided by Cörvers et al. (2011).
17 In the dataset there are individuals with more than one record per year. Given the impossibility to disentangle potential
10 market experience and average tenure are slightly lower for vocational educated workers. However, almost one third of both groups claim to have entered the labor market before completing the upper secondary level, meaning that they have previous experience. The two groups of workers are also very similar concerning labor supply: the average amount of hours worked per week is between 39 and 40, and about 85% of the workers work full-time18.
18 I defined full-time workers as workers who work 35 hours or more per week. Table 1. Descriptive Statistics
(continuation)
General
Education
Vocational Education
General
Education
Vocational Education No. of individuals 548874 84675 Industry (%)*
% of the sample 86.63 13.37 Primary 0.83 1.12
Women (%) 52.66 46.61 Extractive industry 0.18 0.23
Experience (mean) 4.06 3.00 Manufacturing 17.34 17.93
Tenure (mean) 4.06 3.00 Utilities 0.41 0.52
Previous experience (%) 31.06 30.61 Construction 7.05 9.86
Hours worked per week (mean)
39.20 39.63 Commerce, restaurants, and hotels
45.37 33.24
Full-time workers (%) 84.63 85.10 Transports and communication
7.15 5.81
Wage (€, mean) 830.95 808.82 Financial institutions,
consultancy and real estate
24.73 24.01
Part-time Workers 473.53 445.36 Community services 12.68 12.86
Full-time Workers 891.96 859.55 Total 115.71 105.58
Workers aged ≤20 556.08 587.96 Region (%)*
Workers aged [21,25] 727.67 752.16 Norte 28.63 29.71
Workers aged [26,30] 933.07 893.48 Algarve 3.96 4.72
Workers aged [31,35] 1077.34 973.83 Centro 16.06 18.53
Women 724.98 696.89 Lisboa 49.87 39.94
Men 952.71 905.66 Alentejo 5.08 4.74
Hierarchy Level (%)* Açores 1.96 2.24
Senior management 1.84 2.28 Madeira 2.61 2.19
Middle management 3.15 4.02 Foreign 0.01 0.00
Crew chiefs 2.64 1.98 Total 108.18 102.07
Highly qualified professional 9.92 10.39 Present with 18yr old (%) 5.81 5.04 Qualified professionals 49.13 43.01 Present with 19yr old (%) 13.46 12.16 Semi-qualified professionals 24.95 19.23 Present with 20yr old (%) 20.81 18.43 Non-qualified professionals
and Apprentices
38.63 28.45 Present with 21yr old (%) 26.91 23.64
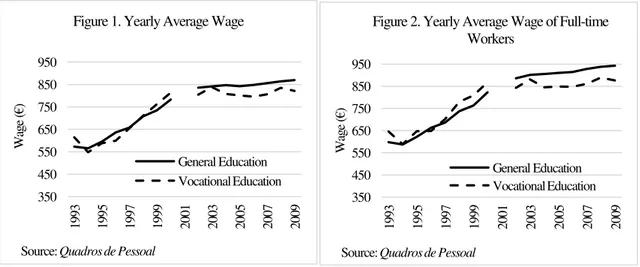
11 Figure 1 provides an overview of the wages19 of both groups, from 1993 to 2009. At a first glance, with exception for four data points (1993, 1998, 1999 and 2000), vocationally educated workers earn persistently less than their counterparts. However, when concentrating on full-time workers only, figure 2 reveals that until 2000 vocationally educated workers earned more than generally educated ones, while from 2002 onwards the reserve happened. This behavior is related to an important feature of the sample: the panel is unbalanced in such a way that the average age increases with time. The average age in the first decade under analysis is lower than in the second decade, and, if the answers to the research questions of this empirical work are positive, the difference in the earnings of the two groups should favor vocationally educated workers for recent entrants (thus younger cohorts) and favor the other group for older and more experienced individuals. Indeed, in table 1, the average wage broken down by age cohorts supports the argument that the wage-differential in the two decades is being driven by the age composition of the sample in the two moments.
To investigate further differences between the two groups of workers, table 1 reports the share of individuals by hierarchy levels of the firm, business industry and region. Statistics reveal that the percentage of vocationally educated workers in positions of senior and middle management is
19 “Wage” refers to the total real wage. That is, I summed the fixed pay with regular and occasional payments to obtain
the total nominal wage, and then I converted it into real values using the CPI deflator (basis 2009).
350 450 550 650 750 850 950
1993 1995 1997 1999 2001 2003 2005 2007 2009
W
ag
e
(
€
)
Figure 1. Yearly Average Wage
General Education Vocational Education
Source: Quadros de Pessoal
350 450 550 650 750 850 950
1993 1995 1997 1999 2001 2003 2005 2007 2009
W
ag
e
(
€
)
Figure 2. Yearly Average Wage of Full-time Workers
General Education Vocational Education
12 slightly higher than that of generally educated ones (6.3% and 5%, respectively) and that the share of individuals that are (or were at some point in time) non-qualified professionals and apprentices is much larger among workers with general education than within the other group (38.63% and 28.45%, respectively). However, the “total” row does not sum to 100% since workers can climb the hierarchical structure and report different levels in different years. This “total” is larger for the group of workers with general education indicating that there were more promotions in this group. Regarding the business industry, both groups of workers work predominantly in the same sectors (commerce, restaurants and hotels are on top in the employment structure followed by financial institutions, consultancy and real estate and then manufacturing). The main differences are verified in construction, which employs about 10% of the individuals with vocational education and 7% of the individuals with general studies, and in commerce, restaurants and hotels, where are employed 45% of the generally educated workers against 33% of the vocationally educated ones. Once more, the “total” figure is larger for workers with general education suggesting a higher flexibility in changing between sectors of activity.
5. Empirical Model and Results
The benchmark model to analyze the liaison between the type of education and earnings is the following:
𝑙𝑤𝑎𝑔𝑒𝑖𝑡 = 𝛽0+ 𝛽1𝑓𝑒𝑚𝑎𝑙𝑒𝑖+ 𝛽2𝑎𝑔𝑒𝑖𝑡+ 𝛽3𝑎𝑔𝑒𝑖𝑡2 + 𝛽4𝑒𝑥𝑝𝑖𝑡+ 𝛽5𝑒𝑥𝑝𝑖𝑡2 + 𝛽6𝑣𝑜𝑐𝑖+ 𝛽7𝑣𝑜𝑐𝑖∗ 𝑒𝑥𝑝𝑖𝑡 + 𝛽8𝑣𝑜𝑐𝑖∗ 𝑒𝑥𝑝𝑖𝑡2 + 𝛽9𝑝𝑟𝑒𝑣𝑖𝑜𝑢𝑠𝑒𝑥𝑝𝑖+ 𝛽10𝑣𝑜𝑐𝑖∗ 𝑝𝑟𝑒𝑣𝑖𝑜𝑢𝑠𝑒𝑥𝑝𝑖+
𝛽11𝑡𝑒𝑛𝑢𝑟𝑒𝑖𝑡+ 𝛽12𝑡𝑒𝑛𝑢𝑟𝑒𝑖𝑡2 + 𝛽13𝑇𝑡+ 𝜀𝑖𝑡 (1)
13 is a binary variable equal to 1 if the individual followed a job-oriented track in upper secondary and 0 if it followed a general stream, 𝑝𝑟𝑒𝑣𝑖𝑜𝑢𝑠𝑒𝑥𝑝 is a dummy variable equal to 1 if the individual was registered in Quadros de Pessoal before reporting upper secondary attainment (that is, if he has working experience prior to completing upper secondary education), 𝑡𝑒𝑛𝑢𝑟𝑒 is the number of years an employee has been working in that firm and 𝑡𝑒𝑛𝑢𝑟𝑒2corresponds to its square. 𝑇𝑡 refers to a vector of time dummies in order to control for macroeconomic events20.
The wage-experiences patterns are captured by the coefficients of 𝑣𝑜𝑐, 𝑒𝑥𝑝, 𝑒𝑥𝑝2, and the interactions 𝑣𝑜𝑐 ∗ 𝑒𝑥𝑝 and 𝑣𝑜𝑐 ∗ 𝑒𝑥𝑝2. The coefficient of 𝑣𝑜𝑐 denotes the initial (when experience is equal to zero) wage advantage (if it is positive) of workers with vocational education relative to those with general education. The coefficients of 𝑒𝑥𝑝 and 𝑒𝑥𝑝2 show how the wage evolves with labor market experience for the group of generally educated workers, specifically the slope and curvature of their wage pattern. Whilst 𝑣𝑜𝑐 ∗ 𝑒𝑥𝑝 and 𝑣𝑜𝑐 ∗ 𝑒𝑥𝑝2 represent existent differences in that pattern (slope and concavity, respectively) for the vocationally educated ones.
Firstly, I estimated model (1) by OLS. Results are shown in column (A) of table 2. The coefficient of 𝑣𝑜𝑐 is positive thus suggesting that there is indeed a wage gain at the beginning of the career for workers with vocational education. However, the negative coefficients of 𝑣𝑜𝑐 ∗
𝑒𝑥𝑝 and 𝑣𝑜𝑐 ∗ 𝑒𝑥𝑝2 reveal that wages for this group grow slower than for workers with general
education and that the former group will eventually be surpassed by the latter.
Nevertheless, because the pooled OLS model does not account for the fact that the same individual is observed several times in the sample, I then moved towards a panel method. Thus, I estimated model (2) (where 𝜇𝑖 denotes the individual-specific effects) by random effects (RE) and employed the Breusch and Pagan Lagrangian Multiplier Test to test for the presence of random
20 I tested for the inclusion of time fixed-effects. Table A.4 in the appendix shows that the null hypothesis that the
14 effects21. The test rejected the null hypothesis that the variance of the individual-specific effects is zero, and hence OLS is not efficient.
𝑙𝑤𝑎𝑔𝑒𝑖𝑡 = 𝛽0+ 𝛽1𝑓𝑒𝑚𝑎𝑙𝑒𝑖+ 𝛽2𝑎𝑔𝑒𝑖𝑡+ 𝛽3𝑎𝑔𝑒𝑖𝑡2 + 𝛽4𝑒𝑥𝑝𝑖𝑡+ 𝛽5𝑒𝑥𝑝𝑖𝑡2 + 𝛽6𝑣𝑜𝑐𝑖+ 𝛽7𝑣𝑜𝑐𝑖∗ 𝑒𝑥𝑝𝑖𝑡 + 𝛽8𝑣𝑜𝑐𝑖∗ 𝑒𝑥𝑝𝑖𝑡2 + 𝛽9𝑝𝑟𝑒𝑣𝑖𝑜𝑢𝑠𝑒𝑥𝑝𝑖+ 𝛽10𝑣𝑜𝑐𝑖∗ 𝑝𝑟𝑒𝑣𝑖𝑜𝑢𝑠𝑒𝑥𝑝𝑖+
𝛽11𝑡𝑒𝑛𝑢𝑟𝑒𝑖𝑡+ 𝛽12𝑡𝑒𝑛𝑢𝑟𝑒𝑖𝑡2 + 𝛽13𝑇𝑡+ 𝜇𝑖+ 𝜀𝑖𝑡 (2)
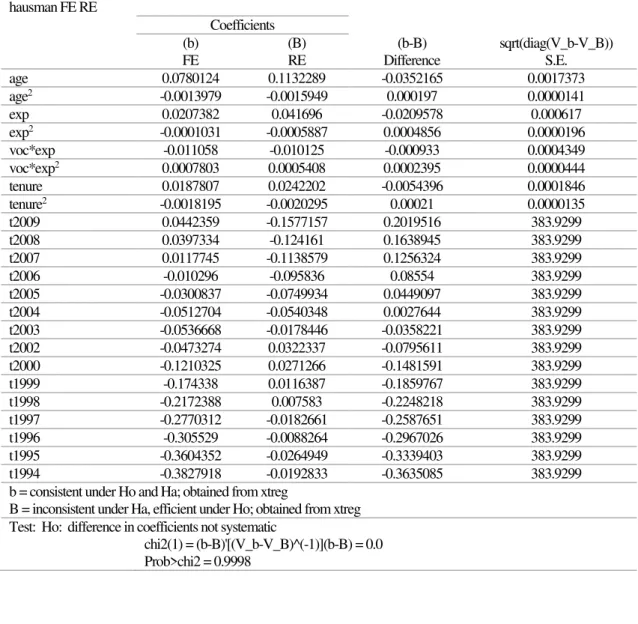
Afterwards, I estimated model (2) by fixed effects (FE) and run an Hausman Test to test for the difference between FE and RE estimates22. The Hausman Test failed to reject the null hypothesis that the difference in coefficients is not systematic, and therefore, both estimators are consistent
while the RE one is efficient. This implies that individuals’ time-invariant unobserved
characteristics (such as ability), otherwise likely to represent a potential source of bias, are uncorrelated with the error term or duly accounted for in the model.
Since a FE estimator removes the individual mean for each regressor, it does not provide an estimate for the impact of time-invariant variables, namely 𝑣𝑜𝑐 and its interactions with experience. As a result, the choice of the estimation method falls on the RE one23.
Estimates of model (2) by RE are presented in column (B) of table 224. The coefficient of
𝑣𝑜𝑐 indicates that workers who pursued vocational education in upper secondary earn about 2.8%
more than those with general education when entering the labor market, on average and all else constant. However, and as suggested by the pooled OLS estimates, the slope is less steep for the group of vocationally educated workers (given the negative coefficient of 𝑣𝑜𝑐 ∗ 𝑒𝑥𝑝) and the concavity is less pronounced or inexistent (given the positive coefficient of 𝑣𝑜𝑐 ∗ 𝑒𝑥𝑝2).
21 See table A.5 in the appendix. 22 See table A.6 in the appendix.
23 An alternative method to estimate the returns to education is the Hausman-Taylor estimator, as proposed by Hausman
and Taylor (1981). However, since in my study the Hausman Test does not reject the exogeneity condition between the error term and the individual-specific effects, the premise to rely on the Hausman-Taylor estimator fails to hold. Therefore, the Hausman-Taylor estimation will not be performed in this paper.
24 This model assumes a compounded error term, composed by the individual-specific effects 𝜇
𝑖 and the idiosyncratic
15
Table 2. Estimates of empirical models.
(A) OLS (B) RE (C) RE (D) RE (E) RE (F) RE (G) RE (H) RE
Exp 0.0590
(0.0007)*** 0.0417 (0.0006)*** 0.0345 (0.0006)*** 0.0416 (0.0006)*** 0.0356 (0.0006)*** 0.0378 (0.0006)*** 0.0211 (0.0006)*** 0.0204 (0.0005)***
Exp2 -0.0015
(0.0001)*** -0.0006 (0.0001)*** -0.0005 (0.0001)*** -0.0006 (0.0001)*** -0.0006 (0.0001)*** -0.0005 (0.0001)*** -0.0001 (0.0001)** -0.0001 (0.0001)
Voc 0.0269
(0.0024)*** 0.0275 (0.0024)*** 0.0200 (0.0023)*** 0.0351 (0.0024)*** 0.0499 (0.0025)*** 0.0281 (0.0024)*** 0.0190 (0.0018)*** 0.0206 (0.0017)***
Voc*Exp -0.0055
(0.0016)*** -0.0101 (0.0011)*** -0.0093 (0.0011)*** -0.0094 (0.0011)*** -0.0123 (0.0012)*** -0.0100 (0.0011)*** -0.0025 (0.0010)** -0.0020 (0.0010)**
Voc*Exp2 -0.0004
(0.0002)* 0.0005 (0.0001)*** 0.0005 (0.0001)*** 0.0005 (0.0001)*** 0.0010 (0.0002)*** 0.0005 (0.0001)*** -0.0001 (0.0001) -0.0000 (.0001218)
Time dummies Yes Yes Yes Yes Yes Yes Yes Yes
Dummies for industry
and hierarchy levels No No Yes No No No Yes Yes
Dummies for region No No No Yes No No Yes Yes
Firm ownership, sales, no. of branches and no. of employees
No No No No Yes No Yes Yes
Dummies for being present with 18, 19, 20 and 21 years old
No No No No No Yes Yes Yes
Hours worked per week No No No No No No Yes No
Restrained sample: only
full-time workers No No No No No No No Yes
No. of observations 1794272 1794272 1698421 1794268 1593960 1794272 1509643 1311592
No. of individuals - 633549 602531 633548 582554 633549 553319 475860
R-squared (overall) 0.1964 0.1949 0.2750 0.2104 0.2668 0.1948 0.5403 0.4460
𝝆 - 0.6759 0.6506 0.6729 0.6616 0.6758 0.5578 0.5677
Source: Quadros de Pessoal
Note: Dependent variable: logarithm of wage. All models were estimated with a constant and controls for gender, age, age2, tenure, tenure2, a dummy for having labor
16 Hence, results of specification (2) corroborate the existence of an initial wage premium that dissipates over time for workers with vocational studies. Nevertheless, other relevant variables
may be included in the model, such as jobs’ and firms’ characteristics, in order to check the
sensitivity of the coefficients and the robustness of the conclusions. The estimates resulting from the inclusion of additional variables are presented in columns (C) through (F). However, since the access to a given job category or the achievement of a particular hierarchical level may themselves be benefits intrinsic to an education type, the inclusion of such controls narrows the analysis given the conditional nature of the marginal effect.
Column (C) shows the result of including dummy variables for the industry in which the firm operates and the hierarchy level of the worker within the firm. The inclusion of such controls reduces the initial wage advantage of vocational education (the coefficient of 𝑣𝑜𝑐 becomes 0.02).
In column (D) the model is added binary variables for the region where the firm is located, while in column (E) I included the logarithm of firms’ sales, the number of branches, the number of employees and the share of firms’ capital stock that is public, private and national and foreign. Both models result in an augmented coefficient of 𝑣𝑜𝑐 (0.0351 and 0.0499, respectively).
While in most empirical studies the return to education falls when job and firm controls are included25, in this work that is the case when controlling for industry and hierarchy levels but the reverse happens when firms’ region, ownership and size are accounted for.
In column (F) I added four binary variables, each one equal to 1 if the worker was observed in Quadros de Pessoal with 18, 19, 20 and 21 years old, respectively. The aim was to control for differentiated levels of ability and capture a potential signaling effect. For instance, working with 18 years old may give a negative signal to the employer that the worker started working too young. On the other hand, it may signal a proactive individual. In turn, working with 19 years old
25 Pereira and Martins (2002) performed a meta-analysis using several Portuguese studies on the returns to education and
17 may well be seen as a positive signal that the individual completed upper secondary in due time. The inclusion of these variables barely alters the coefficient of 𝑣𝑜𝑐.
Finally, I estimated a model including all variables reported from columns (C) to (F), as well as the hours worked per week, that is:
𝑙𝑤𝑎𝑔𝑒𝑖𝑡 = 𝛽0+ 𝛽1𝑓𝑒𝑚𝑎𝑙𝑒𝑖+ 𝛽2𝑎𝑔𝑒𝑖𝑡+ 𝛽3𝑎𝑔𝑒𝑖𝑡2 + 𝛽4𝑒𝑥𝑝𝑖𝑡+ 𝛽5𝑒𝑥𝑝𝑖𝑡2 + 𝛽6𝑣𝑜𝑐𝑖+ 𝛽7𝑣𝑜𝑐𝑖∗ 𝑒𝑥𝑝𝑖𝑡 + 𝛽8𝑣𝑜𝑐𝑖∗ 𝑒𝑥𝑝𝑖𝑡2 + 𝛽9𝑝𝑟𝑒𝑣𝑖𝑜𝑢𝑠𝑒𝑥𝑝𝑖+ 𝛽10𝑣𝑜𝑐𝑖∗ 𝑝𝑟𝑒𝑣𝑖𝑜𝑢𝑠𝑒𝑥𝑝𝑖+ 𝛽11𝑡𝑒𝑛𝑢𝑟𝑒𝑖𝑡+ 𝛽12𝑡𝑒𝑛𝑢𝑟𝑒𝑖𝑡2 + 𝛽13𝑇𝑡+𝛽14𝐼𝑖𝑡+ 𝛽15𝐻𝑖𝑡+ 𝛽16𝑅𝑖𝑡+ 𝛽17𝐹𝑖𝑡+ 𝛽18𝑃𝑖𝑡+
𝛽19ℎ𝑜𝑢𝑟𝑠𝑖𝑡+ 𝜇𝑖+ 𝜀𝑖𝑡 (3)
In model (3), 𝐼 is a vector of the industries considered, 𝐻 is a vector of the hierarchy levels, 𝑅 is a vector of the regions, 𝐹 stands for a vector of the firms’ characteristics introduced in column (E), 𝑃 is a vector of the four binary variables controlling for presence with 18, 19, 20 and 21 years old and ℎ𝑜𝑢𝑟𝑠 denotes hours worked per week. Considering model (2) the restricted model and model (3) the unrestricted one, I computed an F-test which proved that the additional controls are jointly relevant26.
Estimates of such complete specification are shown in column (G) of table 227. Results are that wages of workers with vocational education are about 2% higher than those with general education at the beginning of the career, on average, ceteris paribus. Even though this represents a fall of about 0.8 percentage points relative to the same coefficient in the parsimonious regression (model (2)), it still supports the thesis that job-oriented tracks provide their students differentiated skills that are rewarded by the employer when entering the labor market. The knowledge and competencies acquired in school in such courses may indeed produce a better match between the employer and the employee, who already knows how to perform the job or requires less training (and thus lower training costs) to learn it, vis-à-vis his counterparts. Furthermore, once again, results point to a larger wage growth for generally educated workers (the coefficient of 𝑣𝑜𝑐 ∗ 𝑒𝑥𝑝
18 is negative) who catch up the vocationally educated ones later in time. The coefficient of 𝑣𝑜𝑐 ∗
𝑒𝑥𝑝2 is now insignificant suggesting that the wage-experience patterns of the two groups of
workers have the same curvature.
To compute the earnings profiles I run the same model (model (3)) without the independent variables that yielded insignificant coefficients28 and evaluated the regression at average values of all variables but 𝑣𝑜𝑐, 𝑒𝑥𝑝, 𝑒𝑥𝑝2 and interaction 𝑣𝑜𝑐 ∗ 𝑒𝑥𝑝. I let 𝑒𝑥𝑝 to vary within its whole range (between 0 and 16) and calculated the fitted regression for the group of workers with general and vocational education. The wage-experience patterns obtained are as follows29:
General education: 𝑙𝑤𝑎𝑔𝑒 = 6.5585 + 0.0211𝑒𝑥𝑝 − 0.0001𝑒𝑥𝑝2 (4) Vocational education: 𝑙𝑤𝑎𝑔𝑒 = 6.5781 + 0.0186𝑒𝑥𝑝 − 0.0001𝑒𝑥𝑝2 (5)
The difference in the intercept of the two curves is therefore given by the (re-estimated) coefficient of 𝑣𝑜𝑐 (0.0196) while the difference in slopes is given by that of 𝑣𝑜𝑐 ∗ 𝑒𝑥𝑝 (-0.0026). The graphical representation of both curves is displayed in figure 3. As it is evident in the figure, the marginal effect of pursuing a job-oriented stream in upper secondary decreases with labor market experience30. Particularly, as mentioned before, when entering the labor market workers with vocational studies earn about 2% more than the counterfactual group; after five years of experience they earn 0.68% more, after ten years they face a wage disadvantage of 0.61% and with fifteen years of experience they earn about 2% less. The catch up moment occurs at 7.84 years of experience (approximately seven years and ten months), when the two curves cross each other. From then onwards, the marginal effect becomes negative.
28 The independent variables that yielded insignificant coefficients in model (3) were 𝑣𝑜𝑐 ∗ 𝑒𝑥𝑝2, 𝑣𝑜𝑐 ∗ 𝑝𝑟𝑒𝑣𝑖𝑜𝑢𝑠𝑒𝑥𝑝 and the binary variable for extractive industry.
29 The expression that originated equations (4) and (5) is given by:
𝑙𝑤𝑎𝑔𝑒 = 𝛽̂ + 𝛽′̂𝑋̅ + 𝛽0 ̂ 𝑣𝑜𝑐 + 𝛽𝑣𝑜𝑐 ̂𝑒𝑥𝑝 + 𝛽𝑒𝑥𝑝 𝑣𝑜𝑐∗𝑒𝑥𝑝̂ (𝑣𝑜𝑐 ∗ 𝑒𝑥𝑝) + 𝛽̂ 𝑒𝑥𝑝𝑒𝑥𝑝2 2
⇔ 𝑙𝑤𝑎𝑔𝑒 = 6.5585 + 0.0196𝑣𝑜𝑐 + 0.0211𝑒𝑥𝑝 − 0.0026(𝑣𝑜𝑐 ∗ 𝑒𝑥𝑝) − 0.0001𝑒𝑥𝑝2
The intercept term was obtained by summing the constant estimated in the model and the product of the coefficients and average values of the independent variables displayed in table A.9 in the appendix.
30 The marginal effect is given by the derivative of the regression in order to 𝑣𝑜𝑐. That is: 𝑑𝑙𝑤𝑎𝑔𝑒
19 On the arguments for such differentiated patterns, Hanushek, Woessman and Zhang (2011) state that vocational education helps “improving the transition from schooling to work, but it also appears to have an impact on the adaptability of workers to technological and structural change in
the economy”. Moreover, the authors found that “with increasing age, individuals with general
education are more likely to take any career-related training” which boosts productivity beyond that of workers with vocational education.
Cörvers et al. (2011) point out that the differences in curriculum are responsible for a more or less flexible labor force: “general education delivers a body of general knowledge that is the foundation for efficient job adjustments over their [workers with general education] careers and
for responding rapidly to technological change”.
In Portugal, the ever ongoing debate on the less demanding content of job-oriented tracks, largely seen as alternative paths for students with unsuccessful academic backgrounds, supports the argument that general education prepare its students better in terms of analytical and critical thinking. Such competencies, along with ability itself, may generate a stronger potential for engaging in productivity-enhancing activities, as well as higher adaptability to different jobs and a
6,5 6,6 6,7 6,8 6,9
0 1 2 3 4 5 6 7 8 9 10 11 12 13 14 15 16
L
og
o
f
w
ag
e
Experience
Figure 3. Wage-Experience Profiles
General Education
Vocational Education
20 higher probability of hierarchical mobility31; all of which may result in higher earnings and overcome the initial lower match of these individuals.
Regarding other coefficients of interest32, estimates of model (3) highlight the gender disparity in earnings. The coefficient of 𝑓𝑒𝑚𝑎𝑙𝑒 reveals that women earn about 12% less than men. The coefficient of 𝑝𝑟𝑒𝑣𝑖𝑜𝑢𝑠𝑒𝑥𝑝 (-0.0484) points to a negative impact of having working experience before reporting upper secondary attainment, which may be correlated with the decision of accumulating studies with a job or of returning later to school to finish upper secondary education. Nevertheless, such negative impact is the same across the two groups of workers (the coefficient of 𝑣𝑜𝑐 ∗ 𝑝𝑟𝑒𝑣𝑖𝑜𝑢𝑠𝑒𝑥𝑝 is insignificant). Regarding the four binary variables for being observed in Quadros de Pessoal with 18, 19, 20 and 21 years old, only the first generates a negative effect on wages (-0.0142), which may indicate an early entrance in the labor market to be a negative signal for the employer.
Finally, I estimated model (3) for full-time workers only. The estimates are displayed in column (H) of table 2 and are very similar to those in column (G), which confirms the robustness of the previous results.
5.1. Investigating differences between job-oriented tracks
In order to investigate potential differences between job-oriented tracks I used data on the type of vocational education pursued in upper secondary. I therefore distinguished between workers who completed vocational courses of level III and other type of job-oriented tracks. In the sample, 14.64% of the vocationally educated workers pursued a vocational course of level III while the remaining completed other job-oriented stream.
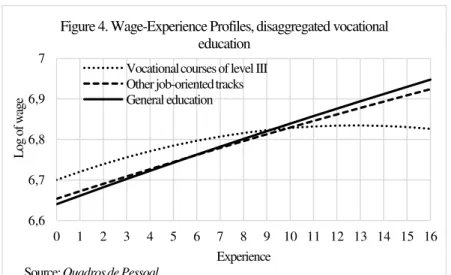
21 At this stage, I repeated the methodology followed before. First, I estimated model (3) replacing the variable 𝑣𝑜𝑐 by two dummy variables for having attended a vocational course of level III (𝑣𝑜𝑐𝐼𝐼𝐼) or other job-oriented track (𝑜𝑡ℎ𝑒𝑟𝑡𝑟𝑎𝑐𝑘). Afterwards, I reestimated that model without the variables that provided insignificant coefficients and then evaluated the regression at average values of all variables but 𝑒𝑥𝑝, 𝑒𝑥𝑝2, 𝑣𝑜𝑐𝐼𝐼𝐼, 𝑜𝑡ℎ𝑒𝑟𝑡𝑟𝑎𝑐𝑘 and the respective interactions. The resultant wage-experience patterns, graphically represented in figure 4, are33:
General education: 𝑙𝑤𝑎𝑔𝑒 = 6.6404 + 0.021𝑒𝑥𝑝 − 0.0001𝑒𝑥𝑝2 (6) Vocational courses of level III: 𝑙𝑤𝑎𝑔𝑒 = 6.7 + 0.021𝑒𝑥𝑝 − 0.0008𝑒𝑥𝑝2 (7) Other job-oriented tracks: 𝑙𝑤𝑎𝑔𝑒 = 6.6534 + 0.0187𝑒𝑥𝑝 − 0.0001𝑒𝑥𝑝2 (8)
Results are that the initial wage advantage of vocational education is larger for vocational courses of level III than for other job-oriented tracks. The coefficients on 𝑣𝑜𝑐𝐼𝐼𝐼 and
𝑜𝑡ℎ𝑒𝑟𝑡𝑟𝑎𝑐𝑘 indicate a marginal impact of about 6% and 1.3%, respectively, relative to the
academic stream when the worker has no experience (on average and all else constant)34. Moreover, workers with general education catch up workers with vocational courses of level III around ten years of experience, while they catch up workers from other job-oriented streams at five years and eight months of experience. Furthermore, given the more pronounced concavity of the wage-experience pattern of workers who pursued a vocational course of level III, the earnings of these workers will diverge further from the earnings of the comparison group later in life.
33 The expression that originated equations (6), (7) and (8) is given by:
𝑙𝑤𝑎𝑔𝑒 = 𝛽̂ + 𝛽′̂𝑋̅ + 𝛽0 ̂ 𝑣𝑜𝑐𝐼𝐼𝐼 + 𝛽𝑣𝑜𝑐𝐼𝐼𝐼 𝑜𝑡ℎ𝑒𝑟𝑡𝑟𝑎𝑐𝑘̂ 𝑜𝑡ℎ𝑒𝑟𝑡𝑟𝑎𝑐𝑘 + 𝛽̂𝑒𝑥𝑝𝑒𝑥𝑝
+ 𝛽𝑜𝑡ℎ𝑒𝑟𝑡𝑟𝑎𝑐𝑘∗𝑒𝑥𝑝̂ (𝑜𝑡ℎ𝑒𝑟𝑡𝑟𝑎𝑐𝑘 ∗ 𝑒𝑥𝑝) + 𝛽̂ 𝑒𝑥𝑝𝑒𝑥𝑝2 2+ 𝛽𝑣𝑜𝑐𝐼𝐼𝐼∗𝑒𝑥𝑝̂ 2𝑣𝑜𝑐𝐼𝐼𝐼 ∗ 𝑒𝑥𝑝2
⇔ 𝑙𝑤𝑎𝑔𝑒 = 6.6404 + 0.0598𝑣𝑜𝑐𝐼𝐼𝐼 + 0.013𝑜𝑡ℎ𝑒𝑟𝑡𝑟𝑎𝑐𝑘 + 0.021𝑒𝑥𝑝 − 0.0023(𝑜𝑡ℎ𝑒𝑟𝑡𝑟𝑎𝑐𝑘 ∗ 𝑒𝑥𝑝) − 0.0001𝑒𝑥𝑝2− 0.0007(𝑣𝑜𝑐𝐼𝐼𝐼 ∗ 𝑒𝑥𝑝2)
The intercept term was obtained by summing the constant estimated in the model and the product of the coefficients and average values of the independent variables displayed in table A.10 in the appendix.
34 The marginal effects are given by 𝑑𝑙𝑤𝑎𝑔𝑒
𝑑𝑣𝑜𝑐𝐼𝐼𝐼 = 0.0598 − 0.0007𝑒𝑥𝑝2 and
𝑑𝑙𝑤𝑎𝑔𝑒
𝑑𝑜𝑡ℎ𝑒𝑟𝑡𝑟𝑎𝑐𝑘= 0.013 − 0.0023𝑒𝑥𝑝.
22
6. Conclusion
For the purpose of assessing the wage returns to different types of education, I focused my study on a period of great expansion of vocational studies, that is, after the creation of vocational schools in 1989. Using Quadros de Pessoal, I followed a panel of individuals with upper secondary attainment born between January 1974 and December 1990, between 1993 and 2009.
Given the concerns with self-selection and ability bias common in this literature, I applied the Hausman Test which indicated that individuals’ unobserved characteristics are uncorrelated with the error term or duly accounted for in the model. Therefore, I employed a RE model.
Estimates revealed a wage advantage for workers with vocational education vis-à-vis workers
with general education, in the beginning of the career. Particularly, accounting for both workers’
and firms’ characteristics, the former group earns on average around 2% more than the latter.
However, the earnings of vocationally educated workers grow at a slower rate and are surpassed by the earnings of generally educated workers at around eight years of experience. Such wage-experience profile is more pronounced in the case of vocational courses of level III when compared to other job-oriented tracks.
In a nutshell, I found empirical evidence of a positive answer to both research questions.
6,6 6,7 6,8 6,9 7
0 1 2 3 4 5 6 7 8 9 10 11 12 13 14 15 16
L
og
o
f
w
ag
e
Experience
Figure 4. Wage-Experience Profiles, disaggregated vocational education
Vocational courses of level III Other job-oriented tracks General education
23 The main policy implication derived from these results is the need to offer students of job-oriented tracks a general component that is relevant, properly demanding and aligned with the vocational part. While job-related skills are especially important to assure a smooth transition from school to the labor market, fostering general skills seems to be particularly relevant in the future.
This study represents a valuable contribution to the barely existent literature on the topic of returns to different types of education in Portugal. Specially, in the present context of a growing importance of firms and labor market institutions for the design of education policy.
Nevertheless, its main limitation lies on one characteristic of the dataset. The survey’s question with respect to the type of education is not totally clear regarding the option considered as “general education”; it reads “12th grade of the academic track or equivalent with professional content”. Consequently, some workers with vocational education may have indicated this answer.
In the future, it would be relevant to use other datasets in order to check the robustness of the results and also include socioeconomic controls (absent in Quadros de Pessoal) if available. Further research on outcomes other than the wage is also pertinent, namely the probability of achieving a certain job, hierarchic level or working in a certain industry. Moreover, the inclusion of self-employed and unemployed individuals would be of importance as well as the derivation of employment-experience patterns (which requires a dataset other than Quadros de Pessoal). Ultimately, this would enable the researcher to balance the lifecycle behavior of wages and employment so as to compute the lifetime income of the two groups of workers35. Furthermore, it would be interesting to study the relation between the field of study and the working field (which requires a dataset other than Quadros de Pessoal), and the differences in tenure and job turnover between the two groups (closely related to the job-matching theory). Finally, integrating data about on-the-job training in this study would be an additional contribution.
24
References
2011. Memorandum of Understanding on Specific Economic Policy Conditionality. Available at: http://www.portugal.gov.pt/media/371369/mou_20110517.pdf
ANESPO.2003. “O Ensino Profissional em Portugal. Contributos para a formulação de uma
estratégia para o seu desenvolvimento”. Work requested by ANESPO –Associação Nacional do Ensino Profissional and carried by Fundação Manuel Leão. Coordinator: Joaquim Azevedo.
Azevedo, Joaquim. 1988. Avaliação da Experiência Pedagógica do ensino técnico-profissional: relatório final. Lisboa: DGES.
Becker, Gary S. 1964. Human capital: A theoretical and empirical analysis, with special reference to education. New York, NY: National Bureau of Economic Research.
Bishop, John H., and Ferran Mane. 2004. “The impacts of career-technical education on high
school labor market success.” Economics of Education Review, 23: 381–402.
Budría, Santiago, and Pedro T. Pereira. 2007. “The wage effects of training in Portugal: differences across skill groups, genders, sectors, and training types.” Applied Economics, 39: 787– 807.
Cerqueira, Maria, and Alcina Martins. 2011. “A consolidação da Educação e Formação Profissional na Escola Secundária nos últimos 50 anos em Portugal.” Revista Lusófona de Educação, 17: 123-145.
Cörvers et al. 2011. “High and steady or low and rising? Life-cycle earnings patterns in
vocational and general education.” Maastricht University RM/11/042. DGEEC/MEC. Estatísticas da Educação 2011/12. Lisboa-Portugal.
Diário da República Electrónico. Portuguese legislation available at www.dre.pt.
Fersterer, Josef, Jörn-Steffen Pischke, and Rudolf Winter-Ebmer. 2008. “Returns to apprenticeship training in Austria: Evidence from failed firms.” Scandinavian Journal of Economics, 110(4): 733-753.
Grácio, Sérgio. 1986. Política Educativa como Tecnologia Social. As reformas do ensino técnico de 1948 e 1983. Lisboa: Livros Horizonte
Hanushek, Eric A. 2012. “Dual Education: Europe's Secret Recipe?” CESifo Forum, 13(3): 29-34.
Hanushek, Eric A., Woessman Ludger and Lei Zhang. 2011. “General education, vocational, and labor-market outcomes over the life-cycle.” National Bureau of Economic Research Working Paper 17504.
Hartog, Joop, Pedro T. Pereira and José A. C. Vieira.2000. “Vocational training and earnings
in Portugal.” Economia, 24: 35-52.
Hausman, Jerry A., and William E. Taylor.1981. “Panel Data and Unobservable Individual Effects.” Econometrica, 49(6): 1377-1398.
Jovanovic, Boyan. 1979. “Job matching and the theory of turnover.” Journal of Political
Economy, 87(5): 972 – 990.
25
Krueger, Dirk, and Khrisna B. Kumar. 2004. “Skill-specific rather than general education: A reason for US-Europe growth differences?” Journal of Economic Growth, 9(2): 167-207.
Kulik, James A.1998. “Curricular tracks and high school vocational education.” In The quality of vocational education: Background paper from the 1994 national assessment of vocational education, ed. Adam Gamoran and Harold Himmelfarb, 65-131. Washington, DC: US Department of Education.
Malamud, Ofer, and Cristian Pop-Eleches. 2010. “General education versus vocational training: Evidence from an economy in transition.” Review of Economics and Statistics, 92(1): 43-60.
Meer, Jonathan. 2007. “Evidence on the returns to secondary vocational education.” Economics
of Education Review, 26: 559–573.
Mincer, Jacob. 1974. Schooling, experience and earnings. New York, NY: National Bureau of Economic Research.
Neuman, Shoshana, and Adrian Ziderman. 1999. “Vocational education in Israel: Wage effects of the VocEd-Occupation match.” The Journal of Human Resources, 34(2): 407–420. OECD. 2009. Learning for Jobs: OECD Policy Review of Vocational Education and Training.
OECD Publishing.
Oosterbeek, Hessel, and Dinand Webbink. 2007. “Wage effects of an extra year of basic vocational education.” Economics of Education Review, 26: 408-419.
Pereira, Pedro. T., and Pedro S. Martins. 2001. “Portugal.” In Education and Earnings in Europe – a Cross Country Analysis of Returns to Education, ed. Colm P. Harmon, Ian Walker and Neils Westergaard-Nielsen, 213-233. Cheltenham, UK: Edward Elgar Publishing.
Pereira, Pedro T., and Pedro S. Martins.2002. “Education and Earnings in Portugal”. Paper
presented at the Conference of the Bank of Portugal on “Desenvolvimento Económico Português no Espaço Europeu: Determinantes e Políticas”, Portugal, May 2002
Saraiva, António F. M. G.1999. “Incidência e impacto salarial da formação profissional em
Portugal.” Economia, 23: 27-43.
Schultz, Theodore S.1961. “Investment in Human Capital.” The American Economic Review, 51(1): 1-17.
Stoer, Stephen.1982. Educação, Estado e Desenvolvimento em Portugal. Lisboa: Livros Horizonte
Weber, Sylvain, and Jean-Marc Falter. 2011. “General education, vocational education, and
wage growth over the lifecycle”. Paper presented at the Interdisciplinary Congress on Research in
Vocational Education and Training, Berne (Switzerland), March 2009; at the Young Swiss Economist Meeting (YSEM), Berne (Switzerland), January 2010; and at the Annual Congress of the European Economic Association (EEA), Glasgow (Scotland), August 2010.
26
Liceal Técnico
Liceal Técnico
Elementary Course Complemen-tary Course Preparatory Cycle General Courses Complemen-tary Courses Technological Courses
1st Cycle
General Courses
2nd Cycle 3rd Cycle
Vocational Courses at Vocational Schools
Technological Courses
1st Cycle
Scientific and Humanistic Courses
2nd Cycle 3rd Cycle
Vocational Courses
Education and Training for Youth (CEF)
Elementary Course
Appendix
Figure A.1. The evolution of the Portuguese education system, from 1960 to 2004.
Source: Author’s construction.
Note: Red tones correspond to Primary Education (until 1985/86) and basic education (after 1986/87). Blue tones correspond to secondary education as in the Portuguese terminology. In international terms until 6th grade is primary education, from 7th to 9th
grade is the lower secondary level and from 10th to 12th grade is the upper secondary level. Green tones correspond to higher
education.
1 2 3 4 5 6 7 8 9 10 11 12
27
Table A.1. English-Portuguese translation of terms used in this report (by order of appearance).
English Portuguese
Vocational education or Job-oriented tracks Ensino profissional General education or Academic track Ensino regular
Technical vocational course Curso técnico-profissional
Vocational course Curso profissional
General courses Cursos gerais
Scientific and humanistic courses Cursos científico-humanísticos Technological courses Cursos tecnológicos
Vocational schools Escolas profissionais
Vocational courses of level III Cursos profissionais de nível III Education and training courses for youth Cursos de Educação e Formação (CEF) Apprenticeship courses Cursos de Aprendizagem
Education and training for adults Educação e Formação de Adultos (EFA) Source: Author’s construction.
Table A.2.Quadro Nacional de Qualificações.
Qualification Level from QNQ
Qualification Courses that award that Qualification
1* 2nd cycle of Basic Education General Education
2nd cycle of Basic Education and
professional qualification of level I
Education and Training for Youth (CEF) Education and Training for Adults (EFA) Recurrent Education
2* 3rd cycle of Basic Education General Education
3rd cycle of Basic Education and
professional qualification of level II
Education and Training for Youth (CEF) Education and Training for Adults (EFA) Recurrent Education
3 Upper Secondary Education General Education (Scientific and Humanistic Courses)
4
Upper Secondary Education and professional qualification of level III
Technological Courses Vocational Courses
Education and Training for Youth (CEF) Education and Training for Adults (EFA) Recurrent Education
Apprenticeship Courses
5* Post-secondary Non-tertiary Education and professional qualification of level IV
CET – Curso de Especialização Tecnológica
6* 1st cycle of Tertiary Education Licenciatura 7* 2nd cycle of Tertiary Education Mestrado 8* 3rd cycle of Tertiary Education Doutoramento
* Not covered in this report.
Source: Despacho n.º 978/2011 (published in Diário da República, 2.ª série, N.º 8, 12 de Janeiro de 2011), and author’s
28
Table A.3. Main Portuguese Legislation concerning the evolution of the education system, between 1960 and 2004.
Piece of Legislation Measures/Reforms
Decree-Law no. 42/994, from May 28th 1960 Mandatory schooling was raised to 4 years
Decree-Law no. 45/810, from July 9th 1964 Mandatory schooling was raised to 6 years
Decree-Law no. 47/430, from January 2nd 1967 Unification of the preparatory cycle of Secondary
Education
Law no. 5/73, from July 25th 1973 Veiga Simão’s Reform
Decree-Law no. 260-B/75, from May 26th 1975
Gradual implementation of the curso geral unificado (7th,
8th and 9th grades). All schools providing Secondary
Education were named High-Schools.
Decree-Law no. 491/77, from November 23rd 1977 Creation of ano propedêutico
Despacho Normativo no. 140-A/78, from June 22nd 1978 Unification of the complementary courses of Secondary
Education (10th and 11th grades)
Decree-Law no. 240/80,from July 19th 1980 Creation of the 12th grade Despacho Normativo no. 194-A/83, from October 21st 1983 Seabra’s Reform
Decree-Law no. 102/84, from March 29th 1984 Creation of cursos de aprendizagem (dual system) Law no. 46/86, from October 14th 1986 Lei de Bases do Ensino Educativo; Mandatory schooling
was raised to nine years
Decree-Law no. 26/89, from January 21st 1989 Creation of the Vocational Schools
Decree-Law no. 286/89, from August 29th 1989 Curricular reform for both Basic and Secondary
Education, following the new structure bent in 1986
Despacho Conjunto no. 123/97, from June 16th 1997,
Ministry of Education and Ministry of Employment and Solidarity
Creation of Education and Training Courses for Youth and Adults (CEF and EFA, respectively)
Portaria no. 550-C/2004, from May 21st 2004 Vocational courses were integrated in public high-schools
Source: Diário da República Electrónico
Table A.5. Breusch and Pagan Lagrangian multiplier test for random effects.
xttest0
lwage[i,t] = Xb + u[i] + e[i,t] Estimated results:
Var sd=sqrt(Var) lwage 0.3102943 0.5570407
e 0.0947607 0.3078322 u 0.1976173 0.4445417 Test: Var(u)=0
chibar2(01) = 8.3e+05 Prob>chibar2 = 0.0000
Table A.4. Test for the inclusion of time fixed-effects.
testparm t1994 t1995 t1996 t1997 t1998 t1999 t2000 t2002 t2003 t2004 t2005 t2006 t2007 t2008 t2009 (1) t2009 = 0
(2) t2008 = 0 (3) t2007 = 0 (4) t2006 = 0 (5) t2005 = 0 (6) t2004 = 0 (7) t2003 = 0 (8) t2002 = 0 (9) t2000 = 0 (10) t1999 = 0 (11) t1998 = 0 (12) t1997 = 0 (13) t1996 = 0 (14) t1995 = 0 (15) t1994 = 0
29
Table A.6. Hausman Test
hausman FE RE
Coefficients
(b) (B) (b-B) sqrt(diag(V_b-V_B))
FE RE Difference S.E.
age 0.0780124 0.1132289 -0.0352165 0.0017373
age2 -0.0013979 -0.0015949 0.000197 0.0000141
exp 0.0207382 0.041696 -0.0209578 0.000617
exp2 -0.0001031 -0.0005887 0.0004856 0.0000196
voc*exp -0.011058 -0.010125 -0.000933 0.0004349
voc*exp2 0.0007803 0.0005408 0.0002395 0.0000444
tenure 0.0187807 0.0242202 -0.0054396 0.0001846
tenure2 -0.0018195 -0.0020295 0.00021 0.0000135
t2009 0.0442359 -0.1577157 0.2019516 383.9299
t2008 0.0397334 -0.124161 0.1638945 383.9299
t2007 0.0117745 -0.1138579 0.1256324 383.9299
t2006 -0.010296 -0.095836 0.08554 383.9299
t2005 -0.0300837 -0.0749934 0.0449097 383.9299
t2004 -0.0512704 -0.0540348 0.0027644 383.9299
t2003 -0.0536668 -0.0178446 -0.0358221 383.9299
t2002 -0.0473274 0.0322337 -0.0795611 383.9299
t2000 -0.1210325 0.0271266 -0.1481591 383.9299
t1999 -0.174338 0.0116387 -0.1859767 383.9299
t1998 -0.2172388 0.007583 -0.2248218 383.9299
t1997 -0.2770312 -0.0182661 -0.2587651 383.9299
t1996 -0.305529 -0.0088264 -0.2967026 383.9299
t1995 -0.3604352 -0.0264949 -0.3339403 383.9299
t1994 -0.3827918 -0.0192833 -0.3635085 383.9299
b = consistent under Ho and Ha; obtained from xtreg
B = inconsistent under Ha, efficient under Ho; obtained from xtreg Test: Ho: difference in coefficients not systematic
chi2(1) = (b-B)'[(V_b-V_B)^(-1)](b-B) = 0.0 Prob>chi2 = 0.9998
Table A.7. Test for the inclusion of the controls added in model (3).
testparm hours present18 present19 present20 present21 senior middle crewchief hqualprof qualprof semiqualprof primary extractive manufacturing utilities construction commerceresthot transpcommunic financonsultrestate norte algarve centro lisboa alentejo açores madeira lsales cprivate cpublic cforeign nbranches nemployees
(1) hours = 0 (2) present18 = 0 (3) present19 = 0 (4) present20 = 0 (5) present21 = 0 (6) senior = 0 (7) middle = 0 (8) crewchief = 0 (9) hqualprof = 0 (10) qualprof = 0 (11) semiqualprof = 0
(12) primary = 0 (13) extractive = 0 (14) manufacturing = 0 (15) utilities = 0 (16) construction = 0 (17) commercresthot = 0 (18) transpcommunic = 0 (19) financonsultrestate = 0 (20) norte = 0
(21) algarve = 0 (22) centro = 0
(23) lisboa = 0 (24) alentejo = 0 (25) açores = 0 (26) madeira = 0 (27) lsales = 0 (28) cprivate = 0 (29) cpublic = 0 (30) cforeign = 0 (31) nbranches = 0 (32) nemployees = 0