A Work Project, presented as part of the requirements for the Award of a Master Degree in Management from the NOVA – School of Business and Economics.
APPENDIX OF THE WORK PROJECT
__________________________________________________________________________________
ANALYSIS AND EVALUATION OF GROWTH POSSIBILITIES FOR THE COMPANY POP SOLUTIONS GROUP
FRANZISKA RUTH EVA MARGARETHE BEHRENS 24947
A Project carried out on the Master in Management Program, under the supervision of: Prof. Luis Manuel da Silva Rodrigues
Table of Content
Appendix 1: Example POP Media Instore Nespresso ... 2
Appendix 2: Example POP Merchandising Volkswagen ... 2
Appendix 3: Example POP Design Design Process ... 3
Appendix 4: Example POP Shopper Experience POP Lab ... 3
Appendix 5: Example POP Gifts Beiersdorf ... 4
Appendix 6: Example POP Promotional Beiersdorf ... 4
Appendix 7: Example POP Permanent Moet & Chandon ... 5
Appendix 8: Blue Ocean Theory ... 5
Appendix 9: Organizational Readiness for Internationalization ... 6
Appendix 10: Risks of International Business ... 8
Appendix 11: Advertising expenditures in Western Europe ... 9
Appendix 12: Market Segmentation European Advertising Expenditures ... 10
Appendix 13: Market Data European Food and Grocery Industry ... 10
Appendix 14: Forecast European Food and Grocery Industry ... 11
Appendix 15: Market Segmentation European Food and Grocery Industry ... 12
Appendix 16: Market Data European Personal Care Retail Industry ... 13
Appendix 17: Forecast European Personal Product Retail Industry ... 14
Appendix 18: Market Segmentation European Personal Products Retail Industry ... 15
Appendix 19: Potential Customer Segmentation for POP Solutions Group ... 16
Appendix 20: Explanation of the criteria for the country selection ... 17
Appendix 21: Data for country selection ... 19
Appendix 22: Explanation of country evaluation ... 20
Appendix 1: Example POP Media Instore Nespresso
Source: POP Solutions Group Marketing Presentation, 2015
POP Media Instore incorporates new technologies, for example, interactive presentation stands, digital signage, beacon, Oculus Rift experience, VR Gear Samsung and augmented reality applications for tablets and smartphones into their displays to extend the “Shopper Experience”.1
Appendix 2: Example POP Merchandising Volkswagen
Source: POP Solutions Group Marketing Presentation, 2015
POP Merchandising uses all commercial optimization techniques, e.g. shopper tracking, available in retail spaces and contact points with the customer. It manages all stages of merchandising for the client, including storage, optimal delivery, installation, real-time reporting, and systematic quality control.2
1
POP Solutions Group Website (2016): http://www.popsolutions.be/en/experiential-marketing/ [accessed November, 20th 2016] & POP Solutions Marketing Presentation (2015)
2
Appendix 3: Example POP Design Design Process
Source: POP Solutions Group Website, 2016
POP Design and its display designers manage every part of the designing process with a thorough understanding of production and product constraints, the retail sector as a whole and technical processes which encourage impulse buying of the consumer.3
Appendix 4: Example POP Shopper Experience POP Lab
Source: POP Solutions Group Website, 2016
With the help of POP Shopper Experience, the company can contribute to optimizing its clients´ customer experience. By combining the latest analytical techniques and years of expertise in the analysis of consumer behavior, POP Solutions helps its client to understand their current and future customer base, anticipate customer behavior and effectively manage the relationship with their customers.4
3
POP Solutions Group Website (2016): http://www.popsolutions.be/en/experiential-marketing/ [accessed November, 20th 2016] & POP Solutions Marketing Presentation (2015)
4
Appendix 5: Example POP Gifts Beiersdorf
Source: POP Solutions Group Marketing Presentation, 2015
Through POP Gifts, the company optimizes the impact of promotional gifts to its client
customer base. 5
Appendix 6: Example POP Promotional Beiersdorf
Source: POP Solutions Group Marketing Presentation, 2015
POP Factory offers a modern, high-quality production site with an outstanding team of
professionals. The factory manages all processes of display production, including cutting,
assembling and filling service. POP Promotional delivers POS displays made from cardboard.
POP Promotional designs, produces and also stores the developed cardboard POS material.
Furthermore, it offers professional advice, prototype production, and specific quotations.6
5
POP Solutions Group Website (2016): http://www.popsolutions.be/en/experiential-marketing/ [accessed November, 20th 2016] & POP Solutions Marketing Presentation (2015)
6
Appendix 7: Example POP Permanent Moet & Chandon
Source: POP Solutions Group Marketing Presentation, 2015
POP Permanent can produce high-quality point-of-sales displays with durable materials, such
as plastic, wood, and metal. With the help of specialist workers, high-performance tools, and
on-site production workshops, it is possible to equip the produced displays and furniture with
lighting systems, screens, and other materials.7
Appendix 8: Blue Ocean Theory
The Blue Ocean Strategy was developed by Renée Mauborgne and W. Chan Kim. Most
companies tend to engage in competition with other companies to gain profitable growth.
However, in the nowadays overcrowded industries, this competition leads to a so-called
“bloody” Red Ocean in fighting for the biggest profits in a shrinking profit environment.
Alternatively, the Blue Ocean indicates a “competitive-free” environment due to a company´s
penetration of new market possibilities (Blue Ocean Strategy, 2016). The table below shows
the differences of a Blue and Red Ocean Strategy.8
7
POP Solutions Group Website (2016): http://www.popsolutions.be/en/experiential-marketing/ [accessed November, 20th 2016] & POP Solutions Marketing Presentation (2015)
8
Blue Ocean Strategy Red Ocean Strategy.
Create uncontested market space. Compete in existing market space.
Make the competition irrelevant. Beat the competition.
Create and capture new demand. Exploit existing demand.
Break the value-cost trade-off. Make the value-cost trade-off.
Align the whole system of a company´s
activities in pursuit of differentiation and
low cost.
Align the whole system of a company´s
activities with its strategic choice of
differentiation or low cost.
(Kim & Mauborgne, own elaboration)
Appendix 9: Organizational Readiness for Internationalization
Dimension Score Rating
Competitive Capabilities in Domestic Market 77 Moderate
Motivation for Going International 75 Moderate
Commitment of Owners and Top Management 75-87 High
Product Readiness for Foreign Markets 56 Moderate
Skill, Knowledge, and Resources 79 Moderate
Experience and Training 54 Moderate
CORE 70-73 Moderate
Scoring of each dimension
With the assistance of the CORETM tool, the management of POP Solutions Group analyzed
the company´s readiness for internationalization. The CORETM is a self-assessment tool and
consists of a set of questions on the dimension of competitive capabilities in the domestic
market, commitment of the employees, motivation for going international, product readiness
for a foreign market, skills, knowledge and resources within the company. The scoring is
between 0 and 100 and should give the company an overview, where it stands regarding its
internationalization plans.
As illustrated in the figure below, POP Solutions Group shows a moderate readiness for
internationalization. Thus, the company and the product/services have several strengths and
Solutions Group had 77 points,
which indicates a moderately
competitive position in the
domestic market.
Therefore, the chances of success
in foreign markets are marginally
enhanced, although the company
must take care to address any specific weaknesses in the domestic market. The result or the
dimension “Motivation for Going International” (Score 75) indicates that the listed motivations
for going international are generally acceptable (e.g. desire for significant long-term presence
in foreign markets, exploitation of the company's unique technologies, and improving
company's return on investment), but could also exhibit some possible problems for the
enterprise (e.g. short-term, incremental sales and/or the desire to dispose of excess inventory).
The dimension “Commitment of Owners and Top Management” reached a high score of 87.
This emphasizes the appropriate level of engagement to the international expansion of the
company. A strong commitment of the top management is the most important single factor in
determining the likelihood of success in foreign markets. Companies, which are successful in
international markets put a significant amount of resources (financial and personnel) into their
internationalization effort. The dimension “Product Readiness for Foreign Markets” scored a
lower result in the CORETM analysis with 56 points. Thus, the product/service appears to be
sufficiently, but not outstandingly, equipped for foreign market penetration. Factors, which
influence this assessment are, for example, willingness to modify product/service and its
packaging, training and support needs for after-sales, the ability to meet regulations and
standards in international markets, and comparisons with leading competitive products in
foreign markets. The dimension “Skill, Knowledge and Resources” rated adequately with a
international transaction experience, knowledge of barriers to entry in foreign markets, and
access to resources such as capital. The last dimension “Experience and Training” rated the
lowest score with 54 points. Thus, the company is performing moderately regarding this
criterion in international marketing. Management experience aboard and the participation of
the company in internationalization efforts, such as trade fairs, where the factors influencing
this criterion.
Overall, the POP Solutions Group illustrated various strengths, such as financial control
systems, product lifecycle, risk reduction, long-term expansion, target payback period,
contractual relationships, strategic emphasis, time and managerial commitment, access to
external funds and stained resource commitment.9
Appendix 10: Risks of International Business
Country risks are the risk produced by political systems, such as laws, regulations, unstable
political systems and environments, corruption, expropriation, wars, and terrorism.
Cross-cultural risks arise from cultural differences, for example, different ways of doing
business, ethical practices or negotiation patterns.
Commercial risks are the risk of doing business in a foreign country regarding partnerships,
strategy execution or operational problems.
Financial or currency risk include all risks regarding taxation, inflation, currency exchange and
asset valuation. The figure below illustrates the four main risks of doing business in foreign
countries.10
9
GlobalEdge Evaluation POP Solutions Group (2016)
10
9 Source: Cavusgil et. al, 2012, p.10
Appendix 11: Advertising expenditures in Western Europe
Source: Advertising in Europe - Statista Dossier 2015
The figure above shows the development of advertising spending in Western Europe from 2014
to 2015, with a forecast until 2020. The graph shows a constant increase in spending with
$93.23billion (bn) in 2014 and $95.44bn in 2015. The forecast indicates a spending of $97.88bn
in 2016 and predicts advertising spending of $106.99bn in 2020.11
11
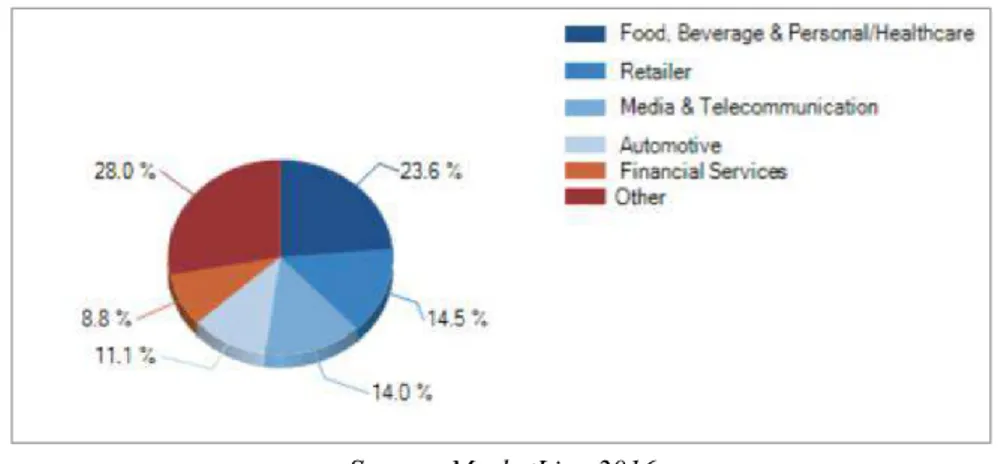
Appendix 12: Market Segmentation European Advertising Expenditures
Source: MarketLine 2016
The figure above illustrates the market segmentation of advertising expenditures in Europe. The
Food, Beverage & Personal/Healthcare market is the largest accounting for 23.6%. It is
followed by the Retailer (14.5%), Media & Telecommunications (14%), Automotive (11.1%),
Financial Services (8.8%) and other various markets (28%).12
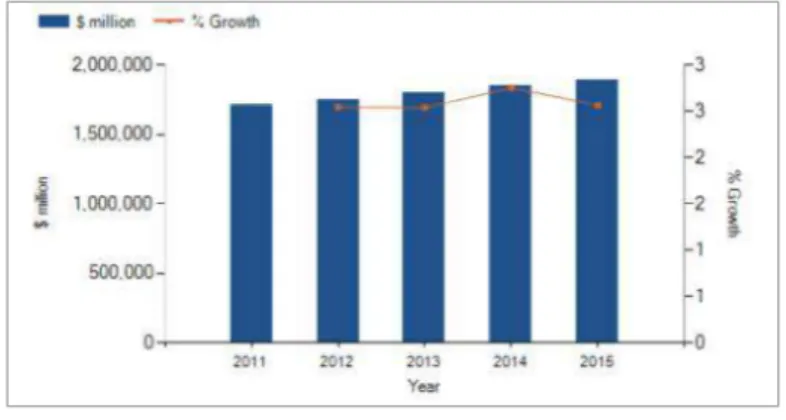
Appendix 13: Market Data European Food and Grocery Industry
Table of development of Europe´s food & grocery retail market value: $ million,2011–15
Source: MarketLine (2), 2016
The table above describes the numerical development of the European food & grocery retail
market from 2011-2015, illustrated in the figure below this table. The growth rate has been
steady in 2012 and 2013 and increased to 2.8% in 2014. However, in 2015, the growth rate fell
to 2.6% around, leaving the market with a compound annual growth rate (CAGR) of 2.6% from
2011-2015.13
12
MarketLine. 2016a. Advertising in Europe. edited by MarketLine Industry Profile. Retrieved from MarketLine database http://advantage.marketline.com [accessed December, 15th 2016]
13
Illustration of development of Europe´s food & grocery retail market value: $ million,2011–15
Source: MarketLine (2), 2016
The illustration above shows the numerical description of the European food & grocery retail
market from 2011-2015 as a graph. The orange line indicates the growth rate, while the blue
pillars stand for the amount spent in million USD.14
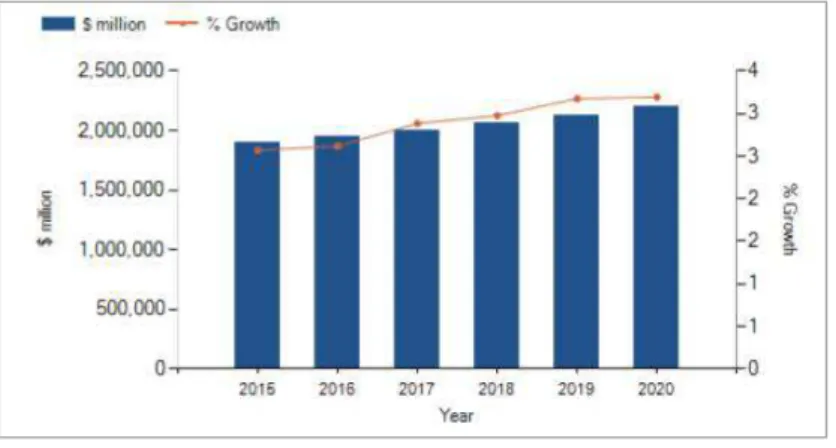
Appendix 14: Forecast European Food and Grocery Industry
Table of Europe´s food & grocery retail market value forecast: $ million, 2015–2020
Source: MarketLine (2), 2016
The table above shows the forecast of the European food and grocery retail industry from
2015-2020. The forecast anticipates a steadily increasing growth rate from 2.6% in 2015 to 3.2% in
2020, indicating a CAGR of 3.0% from 2015-2020 and an industry value of 2,295,455.1 USD.15
14
MarketLine. 2016c. Food & Grocery Retail in Europe. MarketLine Industry Profile. Retrieved from MarketLine database http://advantage.marketline.com . [accessed December, 20th 2016]
15
Illustration of Europe´s food & grocery retail market value forecast: $ million, 2015–2020
Source: MarketLine (2), 2016
The graph above illustrated the numerical forecast of the table above of the European food and
grocery retail industry from 2015-2020.The orange line indicates the percentage growth rate,
while the blue pillars show the amount spent in million USD.16
Appendix 15: Market Segmentation European Food and Grocery Industry
Source: MarketLine (2), 2016
The pie chart above illustrates the market segmentation of the European food and grocery retail
industry. France has the biggest market share with 14.7%, followed by Germany with 12%,
Italy (11.3%), the UK (11.2%), Spain (7.2%) and the rest of Europe (43.6%).17
16
MarketLine. 2016c. Food & Grocery Retail in Europe. MarketLine Industry Profile. Retrieved from MarketLine database http://advantage.marketline.com . [accessed December, 20th 2016]
17
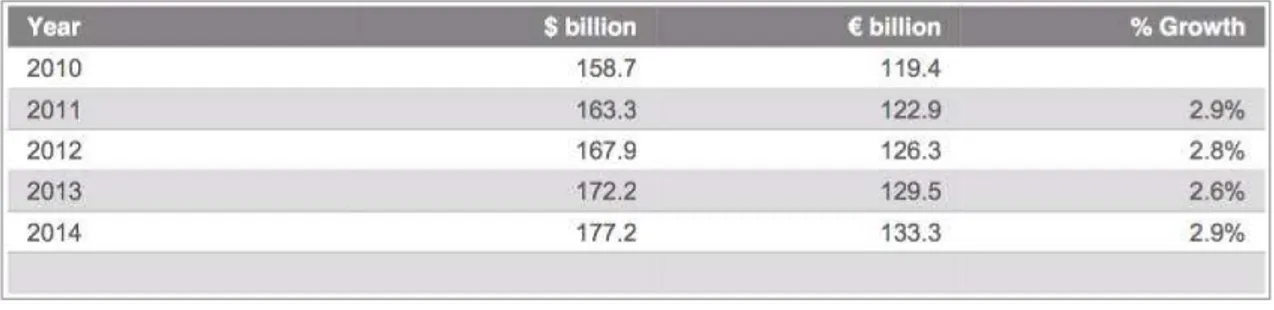
Appendix 16: Market Data European Personal Care Retail Industry
Table of Europe´s personal products market value: $ billion, 2010–14
Source: MarketLine, 2015
The table shows the personal products market in Europe from 2010 to 2014. The market
experienced a constant growth, but fell by 0.2% in 2013 and picked up again to 2.9% in 2014.18
Illustration of Europe´s personal products market value: $ billion, 2010–14
Source: MarketLine, 2015
The graph illustrates the development of the market value of the European personal products
retail market from 2010-2014. The orange line indicates the percentage growth rate and clearly
shows the drop in the growth in 2013. The blue pillars show the value of the market in billion
USD.19
18
MarketLine. 2015a. Personal Products in Europe. MarketLine Industry Profile. Retrieved from MarketLine database http://advantage.marketline.com [accessed December, 24th 2016]
19
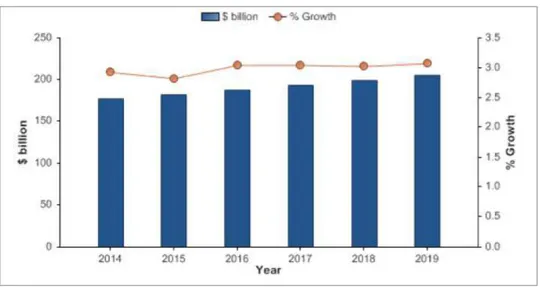
14 Appendix 17: Forecast European Personal Product Retail Industry
Table of Europe´s personal products market value forecast: $ billion; 2014-19
Source: MarketLine, 2015
The table presents the anticipated forecast for the European Personal Product Retail market
from 2014 – 2019. It expects a market value of $205.4 billion by the end of 2019 and a growth
rate in that year of 3.1%. The growth rate is estimated to grow slowly but steadily until 2019.20
Illustration of Europe´s personal products market value forecast: $ billion, 2010–19
Source: MarketLine, 2015
The graph illustrates the forecast for the European Personal Product Retail market from 2014
to 2019. The orange line indicates the percentage growth rate and shows a minor drop of the
growth in 2015 and the recovery of the market until 2019.21
20
MarketLine. 2015a. Personal Products in Europe. MarketLine Industry Profile. Retrieved from MarketLine database http://advantage.marketline.com . [accessed December, 24th 2016]
21
Appendix 18: Market Segmentation European Personal Products Retail Industry
Geographical Segmentation by country
The pie chart below illustrates the geographical segmentation of the Personal Products Retail
Industry in Europe. Germany is the biggest market with 16.2%, followed by France with 13.1%,
the UK (11.9%), Italy (10.2%), Spain (6.6%) and the rest of Europe (41.9%).
Source: MarketLine, 2015 Market Segmentation by company
This pie chart represents the biggest market shares of companies in the European Personal
Products Retail Industry and, therefore, potential clients for POP Solutions Group. The Procter
& Gamble Company has the biggest market share with 12.3%; it is followed by L´Oreal S.A.
with 9.8%, Unilever (4.7%) and Johnson & Johnson (4.5%). The remaining 68.7% are divided
between various companies.22
Source: MarketLine, 2015
22
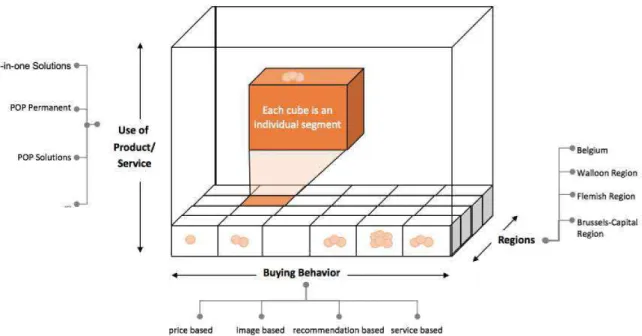
Appendix 19: Potential Customer Segmentation for POP Solutions Group
Figure 13: Customer Segmentation Model by Horváth & Partners (own elaboration for POP)
The figure above illustrates the customer segmentation model of the company Horváth &
Partners Management Consultants. It indicates a potential customer segmentation for POP
Solutions Group in its home market Belgium if the company decides on staying in the domestic
market and focusing its business activities on new customer groups.
POP should divide the potential customers into what kind of product/service they use, their
buying behavior and the particular region of the customers. Afterward, each segment should be
assessed and prioritized for the best fit for the company.
Based on what is important for the company, key performance indicators (KPIs) should be
defined to measure the outcome and success of a segment. For example, for the segment
Flemish region, the number of companies with a certain size could be a KPI.
Afterward, the attractiveness of each segment should be assessed for POP, meaning the
business and market fit of the segment for the company. For example, if in the Walloon Region
only a limited number of companies are operating within the important industries for POP
When every segment is assessed regarding its business and market fit for the company, the
management should prioritize them according to their success potential for POP Solutions
Group. For example, the management evaluates that the companies, which are located in the
Brussels-capital region, use POP´s all-in-one solution and are mostly price-based, are the most
segment with the biggest potential for a successful customer diversification, these segment
should be prioritized. A customer development plan, especially for this segment should be
developed to allocate the right amount of resources and sales personnel on this segment.
Appendix 20: Explanation of the criteria for the country selection
The table above is an own elaboration for this work projects and describes the chosen criteria
for the country selection.
The macroeconomic factors, nominal GDP per capita, real GDP growth rate and Index of
Economic Freedom, have been selected to deliver an overview of the most important economic
indicators of the preselected countries. The databases of EIU Country Data, the International
Monetary Fund, and the Heritage Foundation has been consulted to gather this information.
The other criteria were chosen on an elaboration which criteria are the most important for POP
Solutions Group and would indicate the highest possibility of the fit of a country for the
company. Since a foreign direct investment means a large financial and personal investment of
18 establishment of business. To gather information for this criterion, each government website
has been consulted.
POP Solutions Group is mainly doing businesses with companies that have a revenue bigger
than $300 million, and in the case of internationalization, the company would like to do to
business with a similar customer group as in Belgium. Therefore, the criterion of “number of
companies with revenue higher than $300 million” has been included. This figure gives an
indication on how many potential clients POP Solutions Group could target in the new country.
To obtain the number of companies, the website ORBIS company data has been consulted, and
a list of all businesses has been evaluated.
Since the company is operating within the advertising industry, the amount spent on
advertising was also identified as an important criterion. If a country does not spend a lot on
advertising, the possibility of success for a company such as POP Solutions Group are highly
unlikely. Furthermore, the growth in advertising expenditures is also a criterion which indicates
potential success. If an industry is not growing, it might be a dying market and, therefore, it
would not be advisable for POP Solutions Group to enter such a market. Statista and
MarketLine provided the necessary information to obtain data for these two criteria.
The last measure has been the current competition in the countries. MarketLine and Statista
provided some information about the existing competition, and a guesstimate has been
Appendix 21: Data for country selection
This table gives an overview of the obtained data for each
criterion, explained in Appendix 20. For comparison, the
data for the EU and Belgium has been gathered as well,
Appendix 22: Explanation of country evaluation
The scoring table above shows how each country scored on each criterion. To better compare
the countries, each was compared to the European value and the value of the home market
Belgium. For example, Germany scored a 3 on the criterion number of companies with a
revenue>&300mn since the country has a higher (relative and absolute) number of companies
than Belgium and a lower (relative and absolute) number than the European Union. However,
even though the relative number in Germany is lower than the relative number in the EU,
Germany scored a 3 since the score (relative number ~ 26.000) is only slightly below the
European number (relative number ~ 28.000).
To better illustrate the results, the scoring of 1-4 has been put into an illustration with Harvey
Balls, which can be found in the work project. The score 4 indicates a full Harvey Ball, 3 a
three-quarters Harvey Ball, 2 a half filled, 1 indicates one-quarter and a scoring of 0 means a
The table above illustrates the weighting and final score of each country. The weighting criteria
as been determined due to the importance for the company. The score of each criterion was
multiplied by the weighting and then added up to an overall rating. Therefore, each country has
been allocated a Harvey Ball depending on their scoring in the model.
As it can be seen in the table, the United Kingdom and Germany scored the highest ranking
22 Appendix 23: PESTEL Analysis Germany
Political23
¨ strong democratic structure (describes perception of country's citizens if they can
participate in selecting their government, freedom of expression, freedom of association, and a free media): #95 (out of 100)
¨ Political Stability and Absence of Violence/Terrorism (perceptions of the
likelihood of political instability and politically-motivated violence, including terrorism): #70 (out of 100)
¨ government effectiveness (perceptions of the quality of public services, the quality
of the civil service and the degree of its independence from political pressures, the quality of policy formulation and implementation, and the credibility of the government's commitment to such policies): #94 (out of 100)
¨ control of corruption (perceptions of the extent to which public power is exercised
for private gain, including both petty and grand forms of corruption, as well as "capture" of the state by elites and private interests): #93 (out of 100)
¨ regulatory quality (perceptions of the ability of the government to formulate and
implement sound policies and regulations that permit and promote private sector development): # 93 (out of 100)
¨ strong position in the EU
¨ refugee crisis is still unsolved
Economical24
¨ largest economy in the EU
¨ 4th biggest in the world in USD terms; #4 in GDP 2015 (US$3,4 trillion)
¨ #24 in GDP per capita 2015 (US$41)
¨ growing trade surplus
¨ Gross Fixed Capital Formation grew solidly by 13.1% in 2010-2015 ¨ Germany’s attractiveness as an FDI destination is boosted by its solid
infrastructure offering and large manufacturing base in specialist industries
Social-cultural25
¨ 3rd highest educated workforce in the EU ¨ rapidly aging population
¨ growing spending on food and personal products (as analyzed in the work project)
Technological26 ¨ new high-tech strategy of the German government ¨ digital agenda of the government
Environmental27 ¨ focus on sustainability: the German government has a sustainability strategy for the
next years
Legal28
¨ the rule of law (perceptions of the extent to which agents have confidence in and
abide by the rules of society, and in particular the quality of contract enforcement, property rights, the police, and the courts, as well as the likelihood of crime and violence): #93 (out of 100)29
23
Worldbank (2016): Worldwide Governance Indicators.
http://info.worldbank.org/governance/wgi/index.aspx#home [accessed January 2nd 2017]
24
Euromonitor International (2016): ECONOMY, FINANCE ANDTRADE: GERMANY.
http://www.portal.euromonitor.com. [accessed January 2nd 2017]
25
Euromonitor International (2016): ECONOMY, FINANCE ANDTRADE: GERMANY.
http://www.portal.euromonitor.com. [accessed January 2nd 2017]
26
Federal Republic of Germany (2016): Innovation Policy
https://www.bundesregierung.de/Webs/Breg/DE/Themen/Innovationspolitik/_node.html [accessed January 2nd 2017]
27
Federal Republic of Germany (2016): Energy Revolution
https://www.bundesregierung.de/Webs/Breg/DE/Themen/Energiewende/_node.html . [accessed January 2nd 2017]
28
Worldbank (2016): Worldwide Governance Indicators.
http://info.worldbank.org/governance/wgi/index.aspx#home [accessed January 2nd 2017]
29
Worldbank (2016): Worldwide Governance Indicators.