SYSTEMATICS, MORPHOLOGY AND PHYSIOLOGY
Comparative Genetic Diversity and Genetic Structure of Three Chinese
Silkworm Species Bombyx mori L. (Lepidoptera: Bombycidae), Antheraea
pernyi Guérin-Meneville and Samia cynthia ricini Donovan (Lepidoptera:
Saturniidae)
Y
AN-Q
UNL
IU1,2*, L
IQ
IN1*, Y
U-P
INGL
I1, H
UANW
ANG1, R
UN-X
IX
IA1, Y
ONG-H
ONGQ
I3, X
I-S
HENGL
I4,
C
HENGL
U2, Z
HONG-H
UAIX
IANG21Dept of Sericulture, College of Bioscience and Biotechnology, Shenyang Agricultural Univ, Shenyang 110866, China; 2The Key Sericultural Lab of Agricultural Ministry, Southwest Univ, Chongqing 400716, China; 3Fruitry Station of
Shanxi Province, Taiyuan 030001, China; 4Sericultural Institute of Liaoning Province, Fengcheng 118100, China; [email protected]; [email protected]
Edited by Fernando Noll – UNESP Neotropical Entomology 39(6):967-976 (2010)
ABSTRACT - The genetic diversity and genetic structure of three Chinese silkworm species Bombyx mori L., Antheraea pernyi Guérin-Meneville and Samia cynthia ricini Donovan were comparatively assessed based on RAPD markers. At the species level, A. pernyi and B. mori showed high levels of genetic diversity, whereas S. cynthia ricini showed low level of genetic diversity. However, at the strain level, A. pernyi had relatively highest genetic diversity and B. mori had lowest genetic diversity. Analysis of molecular variance (AMOVA) suggested that 60% and 72% of genetic variation resided within strains in A. pernyi and S. cynthia ricini, respectively, whereas only 16% of genetic variation occurred within strains in B. mori. In UPGMA dendrogram, individuals of A. pernyi and B. mori formed the strain-specifi c genetic clades, whereas those of S. cynthia ricini were distributed in a mixed way. The implications of these results for the conservation and utilization in breeding programs of three silkworm species are discussed.
KEY WORDS: RAPD, genetic variation, AMOVA, dendrogram
Most silkmoths belong to two families of Lepidoptera, Bombycidae and Saturniidae, which secrete several varieties of silk fi bers. They include the domesticated silkworm (Bombyx mori L.) and the wild silkworms, the Chinese oak silkworm (Antheraea pernyi Guérin-Meneville), the Indian tropical tasar silkworm (Antheraea mylitta Drury), the Japanese oak silkworm (Antheraea yamamai Guérin-Meneville), and the eri silkworm (Samia cynthia ricini Donovan). Silk production based on these moths, especially B. mori, A. pernyi and S. cynthia ricini, plays an economically important role in the world. Developing nations like China, India, Brazil, and some of the Latin American countries have taken up sericulture to provide employment to the people in rural area, since it involves intensive labor and is key to locally improve life quality.
The domesticated silkworm B. mori has been used for silk production by Chinese farmers for about 5000 years (Xiang et al 2005). It was progressively spread to Korea, Japan, India, Brazil, and the rest of the world. Today, it is one of the most economically important, benefi cial insect exploited in many developing countries. In the long history of domestication, more than 3000 strains have been developed and maintained. Broadly, four geographical races are identifi ed: Chinese,
Japanese, European and Tropical. Usually, the species needs 20-26 days to complete its larval development. Through intense selection, B. mori has become a truly domesticated insect whose survival and reproduction strictly depends on humans.
The Chinese oak silkworm A. pernyi is the most well-known species among wild silkmoths, and is commercially cultivated for silk production mainly in China, India and Korea. According to historic records, domesticated Chinese oak silkworm originated in the Province of Shandong, China about 400 years ago (Liu et al 2010). It is currently used mostly as a source of insect food (larva, pupa and moth) and for cosmetics. There are more than one hundred strains in China, which are divided into four races based on the larval skin color: yellow, blue, white, and yellow-cyan. In 2005, about seven million kilograms of cocoons (pupae) were produced in China, accounting for 90% of world production. The worms usually take 45-50 days to complete their larval development. This species is semi-domestic, having its larval development in the fi eld, while the egg, pupal and adult stages in the rearing room.
968 Liu et al - Comparative Genetic Diversity and Genetic Structure of Three Chinese Silkworm Species...
and Brazil. Its exploitation for sericulture was initiated in the Brahmaputra valley, Northeastern India (Vijayan et al 2006). In 1950s, this silkworm species was successfully introduced into China for silk production. The hatched larvae are reared in rearing-houses, and require 30-32 days to complete their larval development. Its cocoons cannot be reeled, as they are made up of uneven fi bers. Usually, after moth emergence, cocoons are used for producing spun-yarn. In the present day, more than forty strains have been developed and maintained in China. These strains are classifi ed into different races based on the larval color (yellow, blue, white), blood color and cocoon shape.
In order to better understand the genetic basis of the three silkworm species, it is necessary to assess the pattern of genetic variation within and between strains. Furthermore, the large number of strains within one species has been the focus of study on the role of genetic diversity during and after domestication (Goldsmith et al 2005). Recently, many studies have been carried out to assess the genetic diversity of silkmoths (Gui et al 2001, Zuo et al 2001, Hou et al 2005, Kar et al 2005, Li et al 2005, Vijayan et al 2006, Li et al 2007, Mirhoseini et al 2007); however, the information on genetic diversity within and between strains of the three economically important silkworm species is also scanty.
DNA markers are considered to be the most common means for measuring genetic diversity between individuals or within and between related species or populations because of their abundant polymorphism and the fact that they are independent of environmental conditions (reviewed by Behura 2006). A suitable tool is the RAPD technique (Williams et al 1990), which can provide a virtually unlimited number of neutral DNA markers and can be used to estimate population genetic parameters (Lynch & Milligan 1994). It has proved to be an appropriate method for obtaining
genetic markers for many different kinds of organisms including insects, demanding no prior information about genomic organization (Kim & Sappington 2004). Due to these advantages, RAPD has been widely used to investigate genetic diversity and genetic structure of insects (reviewed by Behura 2006, Hiragi et al 2009, Souza et al 2009). Two major drawbacks of RAPD markers are their lack of reproducibility and the loss of complete genotypic information due to the fact that most RAPD bands are dominantly inherited (Lynch & Milligan 1994). Nevertheless, properly performed RAPD analysis is a useful and reliable tool for studying the genetic diversity and genetic structure (Perrson et al 2002). Analysis of molecular variance (AMOVA), which is not infl uenced by the dominance of the used markers, can be used to determine the partitioning of RAPD variation between and within populations (Huff et al 1993).
In the present study, the genetic diversity and genetic structure of the three silkworm species in China were estimated simultaneously using RAPD markers. The aims to this study were to assess the genetic diversity of the three silkworm species in a parallel study and to investigate the molecular variation within and among strains from the three silkworm species. This information will provide effective and effi cient measures for germplasm conservation and utilization of the three silkworms. This is the fi rst attempt to compare levels of genetic structure among the three silkworm species.
Material and Methods
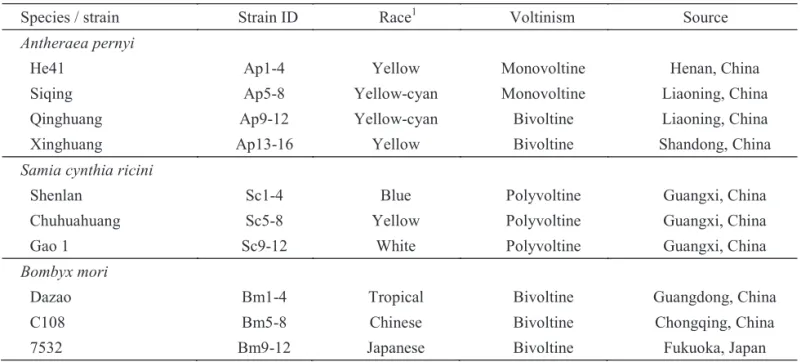
Silkworm materials. A total of 40 samples of A. pernyi (16 from four strains), S. cynthia ricini (12 from three strains) and B. mori (12 from three strains) were collected for the study (Table 1). These strains are reared extensively
Table 1Characteristics of silkworm strains used in this study.
1The strains of A. pernyi and S. cynthia ricini are grouped into different races based on the larval skin color, whereas those of B. mori are based on the geographical origin.
Species / strain Strain ID Race1 Voltinism Source
Antheraea pernyi
He41 Ap1-4 Yellow Monovoltine Henan, China
Siqing Ap5-8 Yellow-cyan Monovoltine Liaoning, China
Qinghuang Ap9-12 Yellow-cyan Bivoltine Liaoning, China
Xinghuang Ap13-16 Yellow Bivoltine Shandong, China
Samia cynthia ricini
Shenlan Sc1-4 Blue Polyvoltine Guangxi, China
Chuhuahuang Sc5-8 Yellow Polyvoltine Guangxi, China
Gao 1 Sc9-12 White Polyvoltine Guangxi, China
Bombyx mori
Dazao Bm1-4 Tropical Bivoltine Guangdong, China
C108 Bm5-8 Chinese Bivoltine Chongqing, China
at different zones in China to produce the cocoon for silk production. They represent a high degree of divergence with respect to geographic origin and morphological, qualitative, quantitative characters. Of the four A. pernyi strains, three named Siqing, Qinghuang and Xinghuang were kindly provided by the Sericultural Institute of Liaoning Province, Fengcheng, Liaoning Province, China, and one named He 41 was obtained from the Sericultural Institute of Henan Province, Nanyang, Henan Province, China. Strains of S. cynthia ricini were obtained from the Sericultural Research Institute, Chinese Academy of Agricultural Sciences, Zhenjing, Jiangsu Province, China, while B. mori strains were obtained from the Institute of Sericulture and System Biology, Southwest University, Chongqing, China. Four individuals were randomly selected from each strain of three silkworm species.
DNA preparation and RAPD analysis. Total genomic DNA of individual insects was extracted by the use of proteinase-K and phenol-chloroform method using about 500 mg of a pupal macerate produced in pre-chilled mortar and pestle with liquid nitrogen. The pupal macerate was transferred to a 5-ml polypropylene tube and incubated at 50ºC overnight in the presence of proteinase-K (75 μg ml-1) by adding 1.5 ml of lysis buffer (10 mM Tris-HCl pH 8.0, 100 mM EDTA, 0.5% SDS). After incubation, an equal volume of phenol-chloroform (1:1) was added to the incubation mixture and mixed thoroughly. The supernatant was collected and the DNA precipitated with two volumes of ethanol after centrifugation. The precipitated DNA was washed with 70% ethanol, air dried, and resuspended in TE buffer (10 mM Tris-HCl, 1 mM EDTA, pH 8.0). The RNA present in the extracts was removed through the treatment with RNAase A (10 mg ml-1) at 37oC for 1h. The DNA was then re-extracted following the steps early described. Quantifi cation of the DNA was performed by electrophoresis on a 0.8% agarose
gel stained with ethidium bromide.
A total of 40 decamer primers obtained from Operon Kit-L and -Y (Operon technologies Inc, USA) were used to screen the suitable primers. Of these, thirteen were selected based on the clarity and consistency of the resulting banding patterns (Table 2). RAPD-PCR was performed in 25 μl of a reaction mixture containing 30 ng DNA, 2.0 μl of 10×Buffer, 2.0 μl of dNTP mix (10 mM), 2 mM MgCl2, 1.0 μl of primer (0.5 μM) and 1.0 U of Taq DNA polymerase (Promega Biotech Co., Ltd, USA). Amplication was carried out in a GeneAmp PCR System 9700 Thermal Cycler (PerkinElmer Inc. USA). The PCR schedule followed was 94ºC for 60 s followed by 35 cycles of 94 ºC for 30 s, 40ºC for 60 s, 72ºC for 90 s and a fi nal extension of 10 min at 72ºC. A negative control without genomic DNA was performed for each series of PCR amplifi cation to ensure no contamination. The PCR products were separated on a 1.4% agarose gel and identifi ed by ethidium bromide staining. The experiment was performed twice and reproducible bands were scored and used for analysis. Weak bands were not considered for analysis.
Data analysis. RAPD markers were scored in a binary form as presence (1) and absence (0) of amplifi ed bands for each sample. In accordance to the dominance relationship usually found in RAPD-PCR loci, the statistical analysis followed four general principles previously describled (Apostol et al 1996): (1) RAPD loci segregate as dominant Mendelian markers, (2) genotypic frequencies are in accordance with Hardy-Weinberg equilibrium, (3) recessive alleles are identical and originate from the same mutational events, (4) dominant alleles also originate from the same mutational events.
The program DCFA 1.1 (Zhang & Ge 2002) was used to process the RAPD data for program POPGENE 1.31 (Yeh et al 1997) and WINAMOVA (Excoffi er et al 1992). To estimate genetic variation with RAPDs, the percentage
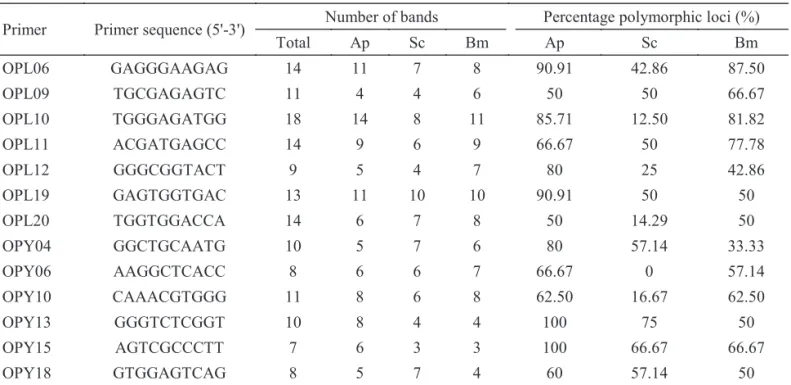
Table 2List of RAPD primers used and polymorphism generated among three silkworms.
Primer Primer sequence (5'-3') Number of bands Percentage polymorphic loci (%)
Total Ap Sc Bm Ap Sc Bm
OPL06 GAGGGAAGAG 14 11 7 8 90.91 42.86 87.50
OPL09 TGCGAGAGTC 11 4 4 6 50 50 66.67
OPL10 TGGGAGATGG 18 14 8 11 85.71 12.50 81.82
OPL11 ACGATGAGCC 14 9 6 9 66.67 50 77.78
OPL12 GGGCGGTACT 9 5 4 7 80 25 42.86
OPL19 GAGTGGTGAC 13 11 10 10 90.91 50 50
OPL20 TGGTGGACCA 14 6 7 8 50 14.29 50
OPY04 GGCTGCAATG 10 5 7 6 80 57.14 33.33
OPY06 AAGGCTCACC 8 6 6 7 66.67 0 57.14
OPY10 CAAACGTGGG 11 8 6 8 62.50 16.67 62.50
OPY13 GGGTCTCGGT 10 8 4 4 100 75 50
OPY15 AGTCGCCCTT 7 6 3 3 100 66.67 66.67
970 Liu et al - Comparative Genetic Diversity and Genetic Structure of Three Chinese Silkworm Species...
of polymorphic bands (PPB), Nei’s gene diversity (h) and Shannon’s index of diversity (I) were calculated with POPGENE. The coeffi cient for gene differentiation (Gst) and gene fl ow (Nm) were calculated by POPGENE on the basis of gene frequencies.
Pair wise genetic distance matrices were generated using Nei’s coeffi cient of similarity (Nei & Li 1979). A dendrogram was generated from the above matrix using unweighted pair group method with arithmetical averages (UPGMA; Sneath & Sokal 1973) on TREECONW 1.3b software program (Van de Peer & De Wachter 1997). The UPGMA method does not assume rate constancy of evolution among the tested strains.
A drawback of RAPD markers is that dominance precludes the use of F statistic-based analysis of population structure. So, analysis of molecular variance (AMOVA; Excoffi er et al 1992), which is not infl uenced by the dominance of the used markers, was preformed to describe the distribution of variance among and within strains for each silkworm species. The statistical program has been used effectively to obtain an assessment of genetic variation in many organisms using dominant RAPD markers (eg. Moya et al 2001, Gallusser et al 2004, Zhang et al 2007, Zhao et al 2008).
Results
RAPD profiles. Of the 40 primers tested, 13 of them producing a clear pattern of bands were selected for further use with all samples. For the selected primers, the same bands were always amplifi ed in subsequent PCR analysis. These 13 primers generated 147 bands (Table 2), of which only two were shared, showing 98.6% polymorphism among the 40 samples analyzed. Most bands were in the range of ~200-2000 bp. The number of bands produced by individual primers varied from 7 (OPY-15) to 18 (OPL-10), with an average of 11.3 bands per primer. The extent of polymorphism within a species also varied. The range of polymorphism in A. pernyi, S. cynthia ricini and B. mori was 50-100%, 0-75% and 33.3-87.5%, respectively.
Strain-specifi c bands were detected in all three strains of B. mori with relatively high frequencies (three bands in Dazao, four in C108 and four in 7532), showing that RAPD divergence among B. mori strains was mainly attributed to allele fi xation. However, no strain-specifi c bands were detected in the strains of A. pernyi and S. cynthia ricini, except for Siqing, a strain of A. pernyi, in which one strain-specifi c band was detected. The results suggested that RAPD divergence among strains of A. pernyi and S. cynthia ricini was mainly attributed to differences in the frequency rather than to allele fi xation.
Genetic diversity at the species level. In the three silkworms, A. pernyi showed the highest genetic diversity at the species level. As for the 16 A. pernyi samples, 13 RAPD primers produced 98 scored bands, of which 77 were polymorphic (PPB 78.57%). Average number of alleles observed and average number of effective alleles was 1.7778 and 1.4613, respectively. Nei’s gene diversity (h) was 0.2666 and Shannon’s
information index (I) was 0.3983 (Table 3).
Samia cynthia ricini showed the lowest genetic diversity at the species level. From the 12 samples of S. cynthia ricini, a total of 79 bands were amplifi ed by 13 primers, and only 30 bands were polymorphic (PPB 37.97%). Average number of alleles observed and average number of effective alleles was 1.3875 and 1.2486, respectively. Nei’s gene diversity (h) was 0.1407 and Shannon’s information index (I) was 0.2079 (Table 3).
Bombyx mori also showed high levels of genetic diversity at the species level. From the 12 samples of B. mori, 13 RAPD primers generated 91 bands, of which 56 were polymorphic (PPB 61.54%). Average number of alleles observed and average number of effective alleles was 1.6264 and 1.4747, respectively. Nei’s gene diversity (h) was 0.2654 and Shannon’s information index (I) was 0.3835 (Table 3).
Genetic diversity at the strain level. At the strain level, all four strains of A. pernyi also showed the highest genetic diversity compared to those of S. cynthia ricini and B. mori. Among the four strains, 13 RAPD primers amplifi ed 72-87 bands, of which 28-39 were polymorphic (PPB 28.28-39.39%). The mean percentage polymorphic loci PPB% was 35.35%. Average number of alleles observed and average number of effective alleles was 1.3535 and 1.2341, respectively. The mean Nei’s gene diversity (h) was 0.1336 (0.1101-0.1520) and the mean Shannon’s information index (I) was 0.1976 (0.1617-0.2208).
All three strains of S. cynthia ricini showed moderate levels of genetic diversity at the strain level. Among the three strains, a total of 76-79 bands were amplifi ed by 13 primers, of which 15-20 were polymorphic (PPB 18.75-25%). The mean percentage polymorphic loci PPB% was 20.83%. Average number of alleles observed and average number of effective alleles was 1.2083 and 1.1556, respectively. The mean Nei’s gene diversity (h) was 0.0858 (0.0738-0.1041) and the mean Shannon’s information index (I) was 0.1244 (0.1079-0.1506).
All three strains of B. mori showed the lowest genetic diversity at the strain level among the three silkworms. Among the three strains, 13 RAPD primers amplifi ed 61-66 bands, of which 6-12 bands were polymorphic (PPB 6.59-13.19%). The mean percentage polymorphic loci PPB% was only 10.99%. Average number of alleles observed and average number of effective alleles was 1.1099 and 1.0845, respectively. The mean Nei’s gene diversity (h) was 0.0458 (0.0281-0.0562) and the mean Shannon’s information index (I) was 0.0663 (0.0405-0.0806).
Genetic structure. In A. pernyi and S. cynthia ricini, AMOVA showed that a large proportion of genetic variation (60.23% and 72.51%, respectively) resided among individuals within strains, where a small part (39.77% and 27.49%, respectively) resided among strains, while a much larger proportion of genetic variation (84.08%) occurred among strains and a relatively smaller proportion of genetic variation (15.92%) occurred among B. mori specimens within strains (Table 4). The P values for all analyses of variance were highly signifi cant.
Neotr
opical Entomology 39(6)
971
Strain Size Number of bands
Number of polymorphic
loci
Percentage polymorphic
loci (%)
Observed number of alleles (Aa)
Effective number of alleles (Ae)
Nei's gene diversity (h)
Shannon's information
index (I)
Antheraea pernyi
He41 4 85 36 36.36 1.3636 1.2301 0.1324 0.1974
Siqing 4 83 39 39.39 1.3939 1.2338 0.1398 0.2104
Qinghuang 4 87 37 37.37 1.3737 1.2766 0.1520 0.2208
Xinghuang 4 72 28 28.28 1.2828 1.1957 0.1101 0.1617
Mean 4 81.8 35 35.35 1.3535 1.2341 0.1336 0.1976
Species 16 98 77 78.57 1.7778 1.4613 0.2666 0.3983
SD 0.4179 0.379 0.1939 0.2676
Samia cynthia ricini
Shenlan 4 79 20 25 1.2500 1.1895 0.1041 0.1506
Chuhuahuang 4 76 15 18.75 1.1875 1.1444 0.0795 0.1147
Gao 1 4 79 15 18.75 1.1875 1.1329 0.0738 0.1079
Mean 4 78 16.7 20.83 1.2083 1.1556 0.0858 0.1244
Species 12 79 30 37.97 1.3875 1.2486 0.1407 0.2079
SD 0.4903 0.3731 0.1994 0.2847
Bombyx mori
Dazao 4 61 12 13.19 1.1319 1.0960 0.0533 0.0777
C108 4 65 6 6.59 1.0659 1.0518 0.0281 0.0405
7532 4 66 12 13.19 1.1319 1.1056 0.0562 0.0806
Mean 4 64 10 10.99 1.1099 1.0845 0.0458 0.0663
Species 12 91 56 61.54 1.6264 1.4747 0.2654 0.3835
SD 0.4864 0.3956 0.2141 0.3050
972 Liu et al - Comparative Genetic Diversity and Genetic Structure of Three Chinese Silkworm Species...
by POPGENE showed similar results (Table 5). In the three species, the Nm (estimate of gene fl ow) values calculated by POPGENE were all smaller than 1 (0.1045-0.7813).
Cluster analysis. The mean genetic distance among individuals within strains of A. pernyi, S. cynthia ricini and B. mori was 0.169 (0.111-0.237), 0.070 (0.044-0.113) and 0.045 (0.008-0.081), while it was 0.280 (0.200-0.366), 0.097 (0.059-0.143) and 0.284 (0.206-0.356) among strains. When all 40 individuals were taken for analysis without considering any strain status, in the dendrogram generated by UPGMA of the Nei’s genetic distance matrices for all the samples, three clusters were clearly formed separating the three silkworm species from each other (Fig 1). In the dendrogram, samples from strains of A. pernyi and B. mori formed strain-specifi c genetic clades. The three B. mori strain-specifi c clades were supported by bootstrap values of 100%, and the four A. pernyi strain-specifi c clades were supported by bootstrap values of 59-85%. However, 12 individuals from three strains of S. cynthia ricini did not form strain-specifi c genetic clades, showing an erratic distribution.
Discussion
RAPD markers. In the present study, RAPD markers generated from 13 random primers revealed sufficient
polymorphism to investigate and compare the genetic diversity of three silkworm species. Several strains with a high degree of divergence were sampled for each silkworm species. Theoretically, the number of molecular marker loci is more important than sample size (Nei 1978). In many studies, the strategy that involves fewer samples and a larger number of molecular marker loci has been used in animals including insects (eg. Georgiadis et al 1990, Nguyen et al 2007). In this study, 79-98 RAPD loci were analyzed for each of the three silkworms; although the sample size was not large, the results obtained are reliable as they were reproducible (Georgiadis et al 1990). The reliability of our data is shown as it compares to the data reported for strains of B. mori by others (Yu et al 2000).
Analysis of the RAPD profi le showed that the percentage of polymorphic loci (PPB%) of S. cynthia ricini was 37.97% (30 out of 79 bands), suggesting a low genetic diversity, which also agreed with those previously observed based on RAPD markers (36.63%) (Zuo et al 2001) and ISSR markers (37.66%) (Xu et al 2005). The calculated Nei’s gene diversity (h) for A. pernyi also agreed with the value (0.2692) estimated from 68 different strains (unpublished data). The large set of markers obtained in this study, as well as the low cost and easiness of use, confi rm the applicability of the RAPD technique in studying silkworm population genetics. Therefore, this effi cient genetic fi ngerprinting technique would be useful for characterizing the large number of strains
Source of variance Degrees of freedom (d.f.)
Sum of squares (SSD)
Expected mean squares (MSD)
Variance component
Percentage
(%) P value
Antheraea pernyi
Among strains 3 0.922 0.307 0.056 39.77% < 0.001 Within strains 12 1.013 0.084 0.084 60.23% < 0.001
Samia cynthia ricini
Among strains 2 0.177 0.089 0.013 27.49% < 0.001 Within strains 9 0.317 0.034 0.035 72.51% < 0.001
Bombyx mori
Among strains 2 0.999 0.500 0.119 84.08% < 0.001 Within strains 9 0.203 0.023 0.023 15.92% < 0.001
Species Total gene diversity (Ht)
Gene diversity within strain (Hs)
Coefficient of gene
differentiation (Gst) Gene flow(Nm)
Antheraea pernyi 0.2666 0.1336 0.4989 0.5023
SD 0.0376 0.0153
Samia cynthia ricini 0.1407 0.0858 0.3902 0.7813
SD 0.0398 0.0019
Bombyx mori 0.2654 0.0458 0.8272 0.1045
SD 0.0458 0.0086
Table 5Partition of genetic diversity within and between strains.
of the three silkworm species kept in germplasm centers.
Genetic diversity. A PPB around 50% is regarded as high genetic diversity (Zhao et al 2006). Therefore, the results reported here revealed high genetic diversity at the species level for A. pernyi (PPB = 78.57%; h = 0.2666; I = 0.3983) and B. mori (PPB = 61.54%; h = 0.2654; I = 0.3835), whereas low genetic diversity for the Chinese populations of S. cynthia ricini (PPB = 37.97%; h = 0.1407; I = 0.2079).
A high genetic diversity for Indian populations of S. cynthia ricini at the species level (PPB = 64.13%; h = 0.3334; I = 0.3475), as well as at the population level (PPB = 14.43-31.52%; h = 0.051-0.109; I = 0.076-0.162) was assessed based on ISSR markers (Vijayan et al 2006). Compared to the data found in Indian populations, the genetic diversity of Chinese populationsobserved in this study (PPB = 37.97%; h = 0.1407; I = 0.2079) was very low at the species level.
However, the genetic diversity of S. cynthia ricini at the strain level (PPB = 20.83%; h = 0.0858; I = 0.1244) was well within the range calculated by Vijayan et al (2006). UPGMA analysis of Indian populations showed that the individuals grouped according to their population affi nity, and none changed its population cluster, which was different from that found in Chinese populations (Fig 1).
Among the Indian populations, the gene differentiation (Gst) was 0.657 (0.3563-0.6971) and 87% of inter-population genetic variability occurred. For the Chinese populations, the gene differentiation (Gst) was 0.390 and only 27.5% of inter-population genetic variability occurred. According to the genetic diversity theory, the maximum genetic diversity of a domesticated species would be presented in the region where it human exploitation was initiated. Eri silkworm was introduced from India into China for wild silk production in 1950s. Therefore, Chinese populations of S. cynthia Fig 1UPGMA dendrogram based on Nei’s genetic distance obtained for Antheraea pernyi, Samia cynthia ricini and Bombyx mori using RAPD markers. Numbers on the branch indicate bootstrap support out of 100 replications.
Sc1
Bm1 Sc11 Ap15
Bm9 Ap12 Ap4
Sc3
Sc10
Bm12 Bm4 Ap16
Ap9 Ap2 Ap6 Ap8 Ap5 Ap7
Ap1 Ap3 Ap13 Ap14
Ap10 Ap11
Sc2 Sc4
Sc5 Sc6 Sc7 Sc8
Sc9 Sc12 Bm2 Bm3
Bm7 Bm8 Bm5 Bm6
Bm10 Bm11 0.1
0.2 0.3
0.4
68
100
100
100
92 67 54
100
100 92
100 89
64 60
78 71
62 59
70
52
50
60
94 0.5
Antheraea pernyi
Samia cynthia ricini
Genetic distance
974 Liu et al - Comparative Genetic Diversity and Genetic Structure of Three Chinese Silkworm Species...
ricini might be derived from a common ancestor population that originated from India, and they were divergent only for a short period of time. Moreover, analysis of genetic diversity of Chinese populations showed that selection and inbreeding of lines from the ancestor population caused genetic divergence, as previously observed (Andrea et al 2000, Pradeep et al 2005).
The genetic diversity for Iranian native B. mori strains is assessed based on AFLP markers by Mirhoseini et al (2007). The dendrogram clustered all individuals belonging to the same strain in the same clade, as found in this study. AFLP markers revealed a relatively high Shannon’s information index (I = 0.502) for Iranian native B. mori strains, when compared with the data revealed by RAPD markers in this study (I = 0.384), although the observed PPB% was very similar between them. The mean Gst value of seven Iranian strains was found to be 0.51, which was lower than the data observed in this study (0.83). The differences may be due to different strains sampled and different marker systems.
Genetic structure. Genetic structure analysis is essential to understand the evolutionary processes such as gene fl ow, natural selection, and genetic drift taking place in a population. Gene flow plays a critical role in differentiation among populations. Generally, Nm > 1 is suffi cient to overcome the effects of genetic drift, and that Nm < 1 indicates that genetic differentiation is likely to occur between populations due to the effects of genetic drift (Allendorf 1983). The gene fl ow (0.1045-0.7813) among the strains of each of the three silkworm species was smaller than one, suggesting that there is no general mixing of the strains and high genetic differentiation of them. Genetic drift caused by artifi cial selection must have played an important role in yielding the current populations of the three silkworms.
The AMOVA analysis showed that a higher genetic variation within rather than between populations of A. pernyi and the Chinese populations of S. cynthia ricini, as found in Antheraea mylitta Hübner (Kar et al 2005). This is a pattern frequently observed in wild plants (Zhang et al 2007, Zhao et al 2008, Tahan et al 2009) and wild insects (Moya et al 2001, Gallusser et al 2004). However, only 16% of genetic variation occurred within strains and 84% among strains of B. mori in China, as observed in Indian populations of S. cynthia ricini (Vijayan et al 2006). This pattern is also found in many domesticated animals (Huang et al 1996, Hao et al 2000) and cultivated plants (Wang et al 2008). Antheraea pernyi and A. mylitta, which are reared in the fi eld, had higher levels of genetic diversity at the strain level than B. mori, which is reared under controlled conditions. The higher genetic variability present in strains of the former two species could be regarded as an adaptive strategy for increasing the population fi tness in a spatiotemporally heterogeneous and uncertain environment, and that the broad-niche species are characterized by high heterozygosity as compared with narrow-niche species (Hedrick 1986).
A value of gene differentiation (Gst) >0.25 is generally regarded as the threshold quantities beyond which signifi cant population differentiation occurs (Slatkin 1987). All the three silkworms revealed signifi cant population differentiation. However, UPGMA dendrogram showed that the individuals
from strains of A. pernyi and B. mori formed strain-specifi c genetic clades, whereas those from Chinese populations of S. cynthia ricini did not. These results showed that B. mori strains exhibit a high inbreeding status, and that the present A. pernyi populations are at the threshold of differentiation. The tested S. cynthia ricini populations are in the verge of genetic differentiation, as they have accumulated about >25% genetic variability among them. Further genetic drift in A. pernyi populations have already resulted in divergent strains, while the Chinese populations of S. cynthia ricini may result in the formation of a single strain. Domestication over long period of time and the selection pressure under man-made rearing conditions might have resulted in this genetic diversifi cation of the populations of the wild silkworms (Kar et al 2005).
Implications for conservation of germplasms and breeding programs. Knowledge of genetic variation within and between strains provides essential information in the formulation of appropriate management strategies directed towards their conservation and the establishment of effective and effi cient breeding programs (Milligan et al 1994). Cross-breeding strategies have been extensively used as a means of harnessing heterosis in the silkworm. Selection of genetically pure and divergent parental strains is critical to the success of a hybridization program in silkworm. It has been shown that the parental homozygosity, also known as genetic purity of a strain, has a distinct infl uence on the degree of manifestation of heterosis (Nagaraju & Goldsmith 2002). Low homozygosity often results in low degree of manifestation of F1 heterosis. The degree of manifestation of F1 heterosis in A. pernyi and S. cynthia ricini is about 10-20%, which is less than that observed in B. mori (20-40%).
The genetic diversity and genetic structure unraveled in this study supports that the lower degree of manifestation of F1 heterosis in A. pernyi and S. cynthia ricini is mainly caused by lower homozygosity and close relationship of strains, respectively. Artifi cial selection has been widely used in the breeding programs for silk moths. Continuous selection and inbreeding can increase the frequency of homozygotes and make homozygous effect stronger (Whitlock 2002). Thus, continuous selection and inbreeding can be used to improve the parental homozygosity for A. pernyi, while introduction of novel germplasm of S. cynthia ricini from India into China must be a good way to enhance the genetic diversity of Chinese populations.
into separate genetic pools. Unlike for what was suggested for B. mori, we must raise more individuals in a population and fewer core populations to conserve the most genetic diversity for A. pernyi and S. cynthia ricini. To address the selection of core populations and effective population size, different kinds of marker systems, including morphological, physiological, biochemical, and molecular can be used.
Acknowledgments
We are grateful to Dr. S. Ge (Laboratory of Systematic and Evolutionary Botany, Institute of Botany, Chinese Academy of Sciences, Beijing, China) for providing the program DCFA. This work was supported by grants from the National Natural Science Foundation of China (30800803; 30671591), Hi-Tech Research and Development (863) Program of China (No. 2006AA 10A 117), the National Modern Agriculture Industry Technology System Construction Project (Silkworm and Mulberry), the Scientifi c Research Project for Commonwealth Industry of the Agricultural Ministry (nyhyzx07-020-17).
References
Allendorf F W (1983) Gene fl ow and genetic differentiation among populations. Conserv Genet 18: 51-65.
Andres J A, Sanchez-Guillen R A, Rivera A C (2000) A molecular evidence for selection on female color polymorphism in the damselfl y Ischnura graellsii. Int J Org Evol54: 2156-2161.
Apostol B L, Black W C, Reiter P, Miller B R (1996) Population genetics with RAPD-PCR markers: the breeding structure of
Aedes aegypti in Puerto Rico. Heredity 76: 325-334.
Behura S K (2006) Molecular marker systems in insects: current trends and future avenues. Mol Ecol 15: 3087-3113.
Excoffi er L, Smouse P E, Quattro J M (1992) Analysis of molecular variance inferred from metric distances among DNA haplotypes: application to human mitochondrial DNA restriction data. Genetics 131: 479-491.
Gallusser S, Guadagnuolo R, Rahier M (2004) Genetic (RAPD) diversity between Oleria onega agarista and Oleria onega ssp. (Ithomiinae, Nymphalidae, Lepidoptera) in north-eastern Peru. Genetica 121: 65-74.
Georgiadis N, Kat P W, Oketch H, Patton J (1990) Allozyme divergence within the Bovidae. Evolution 44: 2135-2149.
Goldsmith M R, Shimada T, Abe H (2005) The genetics and genomics of the silkworm, Bombyx mori. Annu Rev Entomol
50: 71-100.
Gui M Y, Zuo Z H, Wang X M, Chen Y L (2001) Application of RAPD technique in genetic relationship of silk insect II. genetic variance in Antheraea pernyi. Hereditas 23: 452-454. (in Chinese).
Hiragi C, Simões K, Martins E, Queiroz P, Lima L, Monnerat R (2009) Genetic variability in Aedes aegypti (L.) (Diptera:
Culicidae) populations using RAPD markers.Neotrop Entomol 38: 542-547.
Hedrick P W (1986) Genetic polymorphism in heterogenous environments: a decade later. Annu Rev Ecol Syst 17: 535-566.
Hou C X, Li M W, Miao X X, Xu A Y, Sun P J, Zhang Y H, Huang Y P (2005) Genetic diversity among Philosamia cynthia ricini
strains revealed by ISSRs. Acta Sericol Sin 31: 358-361. (in Chinese).
Huang Y F, Zhang Y P, Qiu X P, Zeng X T, Xiao Y Z (1998) The relationship between mitochondrial DNA polymorphism and origin and differentiation of native pig breeds in China. Acta Genet Sin 25: 322-329. (in Chinese).
Huff D R, Peakall R, Smouse P E (1993) RAPD variation within and among natural populations of outcrossing buffalograss, (Buchloe dactyloides (Nutt.) Engelm). Theor Appl Genet86: 927-934.
Kar P K, Vijayan K, Mohandas T P, Nair C V, Saratchandra B, Thangavelu K (2005) Genetic variability and genetic structure of wild and semi-domestic populations of tasar silkworm (Antheraea mylitta) ecorace Daba as revealed through ISSR markers. Genetica 125: 173-183.
Kim K S, Sappington T W (2004) Genetic structuring of boll weevil populations in the US based on RAPD markers. Insect Mol Biol 13: 293-303.
Li M W, Hou C X, Miao X X, Xu A Y, Huang Y P (2007) Analyzing genetic relationships in Bombyx mori using intersimple sequence repeat amplifi cation. J Econ Entomol 100: 202-208.
Li M W, Shen L, Xu A Y, Miao X X, Hou C X, Sun P J, Zhang Y H, Huang Y P (2005) Genetic diversity among silkworm (Bombyx mori L., Lep., Bombycidae) germplasms revealed by microsatellites. Genome 48: 02-810.
Liu Y Q, Li Y P, Li X S, Qin L (2010) The origin and dispersal of domesticated Chinese oak silkworm Antheraea pernyi in China: a reconstruction based on ancien texts. J Insect Sci 10: 180.
Lynch M, Milligan B G (1994) Analysis of population genetic structure with RAPD markers. Mol Ecol 3: 91-99.
Milligan B G, Leebens-Mack J, Strand A E (1994) Conservation genetics: beyond the maintenance of marker diversity. Mol Ecol 12: 844-855.
Mirhoseini S Z, Dalirsefat S B, Pourkheirandish M (2007) Genetic characterization of Iranian native Bombyx mori strains using amplified fragment length polymorphism markers. J Econ Entomol 100: 939-945.
Moya A, Guirao P, Cifuentes D, Beitia F, Cenis J L (2001) Genetic diversity of Iberian populations of Bemisia tabaci (Hemiptera: Aleyrodidae) based on random amplifi ed polymorphic DNA-polymerase chain reaction. Mol Ecol 10: 891-897.
Nagaraju J, Goldsmith M R (2002) Silkworm genomics - progress and prospects. Curr Sci 83: 415-425.
976 Liu et al - Comparative Genetic Diversity and Genetic Structure of Three Chinese Silkworm Species...
Nei M, Li W H (1979) Mathematical model for studying genetic variation in terms of restriction endonucleases.Proc Natl Acad Sci USA 76: 5269-5273.
Nguyen T T, Genini S, Bui L C, Voegeli P, Stranzinger G., Renard J P, Maillard J C, Nguyen B X (2007) Genomic conservation of cattle microsatellite loci in wild gaur (Bos gaurus) and current genetic status of this species in Vietnam. BMC Genetics 8: 77 doi:10.1186/1471-2156-8-77.
Perrson C V M, Rogers A D, Sheader M (2002) The genetic structure of the rare lagoonal sea anemone, nematostella vectensis
Stephenson (Cnidaria: Anthozoa) in the United Kingdom based on RAPD analysis. Mol Ecol 11: 2285-2293.
Pradeep A R, Chatterjee S N, Nair C V (2005) Genetic differentiation induced by selection in an inbred population of the silkworm
Bombyx mori, revealed by RAPD and ISSR marker systems. J Appl Genet 46: 291-298.
Skotnicki M L, Ninham J A, Selkirk P M (1999) Genetic diversity and dispersal of the moss Sarconeurum glaciale on Ross Island east Antartica. Mol Ecol 8: 753-762.
Slatkin M (1987) Gene fl ow and geographic structure of natural populations.Science 236: 787-792.
Sneath P H A, Sokal R R (1973) Numerical taxonomy: principles and practice of numerical classifi cation. WH Freeman, San Francisco, 573 p.
Souza A L B, Tavares M G, Serrao J E, Delabie J H C (2009) Genetic variability of native populations of Wasmannia
Forel (Hymenoptera: Formicidae) and their biogeographical implications. Neotrop Entomol 38: 376-383.
Tahan O, Geng Y P, Zeng L Y, Dong S S, Chen F, Chen J, Song Z P, Zhong Y (2009) Assessment of genetic diversity and population structure of Chinese wild almond, Amygdalus nana, using EST- and genomic SSRs. Biochem Syst Ecol 37: 146-153.
Van de Peer Y, De Wachter R (1997) Construction of evolutionary distance trees with TREECON for Windows: accounting for variation in nucleotide substitution rate among sites. Comput Applic Biosci 13: 227-230.
Vijayan K, Anuradha H J, Nair C V, Pradeep A R, Awasthi A K, Saratchandra B, Rahman S A S, Singh K C, Chakraborti R, Urs S
R (2006) Genetic diversity and differentiation among populations of the Indian eri silkworm, Samia cynthia ricini, revealed by ISSR markers. J Insect Sci 6: 30 .
Wang C, Zhang H, Qian Z Q, Zhao G F (2008) Genetic differentiation in endangered Gynostemma pentaphyllum (Thunb.) Makino based on ISSR polymorphism and its implications for conservation. Biochem Syst Ecol 36: 699-705.
Whitlock M C (2002) Selection, load, and inbreeding depression in a large metapopulation. Genetics 160: 1191-1202.
Xiang Z H, Huang J T, Xia J G, Lu C (2005) Biology of sericulture. Beijing, China Forestry Publishing House, 3p. (in Chinese).
Yeh F C, Yang R C, Boyle T B J, Ye Z H, Mao J X (1997) POPGENE, the user-friendly freeware for population genetic analysis. Molecular Biology and Biotechnology Center, University of Alberta, Canada. (http://www.ualberta.ca/~fyeh/).
Yu H S, Lu C, Zhou Z Y, Xiang Z H (2000) A preliminary study on DNA polymorphism of Bombyx mandarina M. in China. Acta Sericol Sin 26: 95-98. (in Chinese).
Zhang F M, Ge S (2002) Data analysis in population genetics. I. analysis of RAPD data with AMOVA. Biodiv Sci 10:438-444. (in Chinese).
Zhang Z Y, Zheng X M, Ge S (2007) Population genetic structure of Vitex negundo (Verbenaceae) in Three-Gorge Area of the Yangtze River: The riverine barrier to seed dispersal in plants. Biochem Syst Ecol 35: 506-516.
Zhao N X, Gao Y B, Wang J L, Ren A Z (2008) Population structure and genetic diversity of Stipa grandis P. Smirn, a dominant species in the typical steppe of northern China. Biochem Syst Ecol 36: 1-10.
Zhao Q F, Wang G, Li Q X, Ma S R, Cui Y, Grillo M (2006) Genetic diversity of fi ve Kobresia species along the eastern Qinghai-Tibet plateau in China. Hereditas 143: 33-40.
Zuo Z H, Gui M Y, Wang X M, Chen Y L (2001) Application of RAPD technique in genetic relationship study of silk insect I. genetic variance in eri silkworm. Hereditas 23: 128-130. (in Chinese).