Growth, photosynthesis, nodule nitrogen and carbon fixation
in the chickpea cultivars under salt stress
Neera Garg andRanju Singla*
1Department of Botany, Panjab University, Chandigarh-160014, India. *Corresponding author: gargneera@yahoo.com.in
Received: 17/09/2004, Accepted: 25/11/2004
Four cultivars of chickpea, two of them of Mediterranean origin (kabuli), CSG 9651, BG 267 and two Indian (desi) types, CSG 8962, DCP 92-3, differing in their salt sensitivities were identified after screening ten genotypes in saline soils. The cultivars CSG 9651 and CSG 8962 were salt tolerant while BG 267 and DCP 92-3 were salt sensitive, respectively. The seeds of different cultivars were inoculated with Mesorhizobium ciceri, strain F: 75 and the plants were grown in the greenhouse. After the establishment of symbiosis, 15-day-old seedlings were administered doses of saline at varying concentrations (0, 4, 6, 8 dSm-1 NaCl, Na
2SO4, CaCl2). Plants were harvested at 40, 70 and 100 days after sowing, for analyses. The main aim was to
compare the relative salt tolerance of both desi and kabuli cultivars in terms of nitrogen fixation and carbon metabolism, as well as to ascertain whether the negative effects of saline stress on nitrogen fixation were due to a limitation of photosynthate supply to the nodule or to a limitation on the nodular metabolism that sustains nitrogenase activity. Plant growth, nodulation and nitrogenase activity was more severely affected in BG 267 and DCP 92-3 under salinity treatments (6 and 8 dSm-1)
compared with CSG 9651 and CSG 8962. Nodule number as well as nodule mass increased under salt stress in CSG 9651 and CSG 8962 which might be responsible for their higher nitrogen fixation. Salinity reduced leaf chlorophyll and Rubisco activities in all cultivars. However, tolerant cultivars CSG 9651 and CSG 8962 showed smaller declines than the sensitive ones. Phosphoenolpyruvate carboxylase (PEPCase) activity increased significantly in the nodules of tolerant cultivars under salt stress at all harvests, and this was clearly related to salt concentrations. Our results suggest that in salt-affected soils tolerant cultivars have more efficient nodulation and support higher rates of symbiotic nitrogen fixation than the sensitive cultivars.
Key words: chlorophyll pigments, nitrogenase activity, nodule, PEPCase, Rubisco.
Crescimento, fotossíntese e fixação de nitrogênio e carbono em nódulos de cultivares de grão-de-bico sob estresse salino: Quatro cultivares de grão-de-bico, dois deles de origem mediterrânea (kabuli), CSG 9651, BG 267 e dois indianos (desi), CSG 8962, DCP 92-3, diferindo na sensibilidade à salinidade, foram identificados após seleção de dez genótipos em solo salino. Os cultivares CSG 9651 e CSG 8962 mostraram-se tolerantes enquanto BG 267 e DCP 92-3, não. Suas sementes foram inoculadas com Mesorhizobium ciceri, linhagem F:75 e germinadas e mantidas em casa de vegetação. Depois do estabelecimento da simbiose, plântulas com 15 dias de idade receberam dose de sais em variadas concentrações (0, 4, 6, 8 dSm-1 NaCl, Na
2SO4 e
CaCl2). As plantas foram colhidas 40, 70 e 100 dias após a semeadura para as análises. O principal objetivo era comparar a tolerância à salinidade de ambas as cultivares desi e kabuli em termos de fixação de nitrogênio e carbono, assim como verificar se o efeito negativo do estresse salino sobre a fixação de nitrogênio era devido à limitação do suprimento de fotoassimilados para os nódulos ou à limitação do metabolismo do nódulo que mantém a atividade da nitrogenase. O crescimento das plantas, a nodulação e a atividade de nitrogenase foram mais severamente afetados em BG 267 e DCP 92-3 nos tratamentos de salinidade (6 e 8 dSm-1), comparadas com CSG 9651 e CSG 8962. O número e a massa de nódulos aumentaram em CSG 9651 e CSG
INTRODUCTION
Legumes are appropriate crops for the enhancement of bioproductivity and the recovery of marginal lands. Legumes not only yield nutritious fodder and protein-rich seeds but also enrich soil nitrogen through symbiotic association with
Rhizobium. However, symbiotic nitrogen fixation by legumes is sensitive to environmental stresses particularly salinity (Serraj, 2002). In legumes, salinity can limit plant growth, cause both hyper-ionic and hyper-osmotic stress effects, depress symbiotic performance, etc (Rout and Shaw, 2001; Rao et al., 2002). Salt stress limits plant productivity in legumes through diminished photosynthetic efficiency, nitrogen fixation and carbon metabolism (Delgado et al., 1994; Soussi et al., 1998, 1999; Ferri et al., 2000). Symbiotic nitrogen fixation in legume root nodules is fueled by carbon supplied by the host plant. The energy requirement for nitrogen fixation is supplied primarily in the form of dicarboxylic acids (particularly malate and succinate) which are taken up by bacteroids (Udvardi and Day, 1997). These C4 dicarboxylic acids are derived from nodule cytosolic PEPCase activity and provide the source of carbon and energy to the bacteroid nitrogenase for the conversion of nitrogen into ammonia. Salinity can limit nitrogen fixation capacity of bacteroids by reducing the carbohydrate supply.
Chickpea is one of the most important legume crops for human nutrition grown in arid and semi-arid regions and is considered to be a salt-sensitive species (Ashraf and Waheed, 1993). Cultivars grown in India are either native (desi) types characterized by smaller, angular, pigmented seeds or Mediterranean (kabuli) types with larger, rounded seeds which lack pigmentation (van der Maesen, 1987). Since the genus is indigenous to arid areas, some genotypes may have a degree of salt adaptation (Soussi et al., 1999; Rao et al., 2002). Differences in salt tolerance occur not only in different species but also in different genotypes of the same species (Serraj, 2002).Genotypic variability amongst the desi and kabuli cultivars (with kabuli showing higher tolerance), have been reported recently (Rao et al.2002). However, studies on kabuli and desi genotypes are limited to plant growth and details of several physiological and biochemical markers responsible for their salt tolerance are lacking. Therefore, it is essential to identify and introduce salt-tolerant varieties to improve agricultural production in soils subject to salinity.
The objective of this study was to determine effects of salinity on growth, photosynthesis, nodule nitrogen and carbon fixation in desi and kabuli cultivars of chickpea and to investigate whether the negative effects of saline stress on
nitrogen fixation were due to limitation of photosynthetic supply to the nodule or to a limitation on the nodular metabolism that sustains nitrogenase activity.
MATERIAL AND METHODS
The seeds of chickpea cultivars were obtained from the Central Soil Salinity Research Institute (CSSRI) at Karnal, India and were inoculated with salt-tolerant
Mesorhizobium ciceri strain F:75 obtained from IARI, New Delhi, India. Preliminary experiments were conducted on the effects of salt stress on growth and salt tolerance index was calculated for ten different cultivars of chickpea. On the basis of the above screening, four cultivars, two each of desi (DCP 92-3 and CSG 8962) and two kabuli (BG 267 and CSG 9651) with differing salt sensitivities (the former of each pair being most salt sensitive and latter of each pair the most salt tolerant) were selected for a detailed study. Circular clay pots (33 x 25 x 25 cm) were lined with polythene bags and filled with a mixture of thoroughly sifted soil (mineral N-free), sand and farm-yard manure in the proportion of 2:2:1 by volume. Seeds were surface sterilized in 30 % (w/v) mercuric chloride for 2 min, then washed with sterile water and germinated in the pots. The pots were treated with saline solutions (prepared from a mixture of NaCl, CaCl and Na2SO4 in the ratio 7:2:1 [w/v of varying electrical conductivity that is 0, 4, 6, 8 dSm-1
(equivalent to 0, 25, 50, and 75 mM NaCl). The soils were supplemented with these salt solutions on three consecutive days before sowing in order to attain the required salinity level and these levels were maintained throughout the growing by fortification with saline solutions at weekly intervals. The electrical conductivity of different salinity levels was adjusted by direct measurements with a conductivity meter. The controls were irrigated with tap-water only. Three plants of uniform size were maintained in each pot. Plants were sampled and analyzed for the parameters outlined below at three different growth stages namely, 40, 70, 100 days after sowing (DAS). Two pots with three plants each were sampled per treatment. For all collected stages plant samples were dried in an oven for 72 h for 70°C.
Table 1.
The mean total (shoot and root ) dry weight (TDW) and salt tolerance index (STI) in ten
chickpea cultivars grown under different saline concentrations.
Electrical conductivity dSm-1
TDW (g) STI (%)
0 4 6 8 0 4 6 8
Kabuli
CSG 96512,48 2,31 2,17 2,05 100,00 93,10 87,50 82,60
BG 267 2,06 1,58 1,52 1,30 100,00 76,60 73,70 63,10
CSG 8927 2,12 1,73 1,60 1,38 100,00 81,60 75,40 65,00
CSG 8929 2,25 1,86 1,74 1,61 100,00 82,60 77,30 71,50
CSG88102 2,32 1,95 1,81 1,75 100,00 84,00 78,00 75,40
Desi
CSG 8962 1,90 1,60 1,51 1,41 100,00 84,20 79,40 74,20
DCP92-3 1,69 1,21 1,10 0,96 100,00 71,50 65,00 56,80
CSG 8907 1,80 1,45 1,40 1,20 100,00 80,50 77,70 66,60
CSG 8947 1,75 1,31 1,29 1,10 100,00 74,80 73,70 62,80
CSG 8890 1,70 1,25 1,21 1,05 100,00 73,50 71,10 61,70
Cultivars
STI = (TDW at Sx / TDW at Si ) x 100
Where: TDW = total dry weight; Si = control treatment; Sx = x treatment
Nitrogenase activity: Nitrogenase (EC 1.7.99.2) activity (ARA) was determined by acetylene reduction with nodulated root portions of plants following the method of Herdina and Silsbury (1990). Gas samples were analyzed for ethylene produced in the reaction using a Perkin Elmer 8600 gas chromatograph equipped with a Porapak R column (Ligero et al., 1986).
Nitrogen Content: it was estimated by the colorimetric method of Linder (1944) using Nessler´s reagent following digestion in a mixture of concentrated sulphuric acid and perchloric acid.
Chlorophyll: Extraction of chlorophyll was carried out in dimethyl sulphoxide (DMSO) using leaf discs, following the method of Hiscox and Israelstam (1979). The absorbance of chlorophyll in DMSO was measured at two wavelengths, 645 and 663 nm, in a spectrophotometer against DMSO.
Rubisco activity:Ribulose 1,5-bisphosphate carboxylase (EC 4.11.39) activity in the leaves was determined according to the procedure of Keys and Parry (1990). The samples were ground in 3 mL of 100 mM Bicine, pH 7.8 containing 10mM MgCl2, 1mM EDTA, 5 mM DTT, and 2 % (w/v) PVP. The homogenate was filtered and centrifuged at 35,000 gn for 10 min at 0°C. Rubisco activity was assayed by determining the
incorporation of 14CO
2 into the acid stable product by liquid
scintillation counting.
In vitro phosphoenol pyruvate carboxylase activity:PEPCase (EC 4.1.1.31) activity was assayed by the method of Christellar et al. (1977). The nodule extract was prepared in ice-cold extraction medium containing 50mM tris HCl, 10mM MgCl2 and 5mM DTT with the pH adjusted to 8.0.The homogenate was centrifuged at 35,000 gn for 20 min and the supernatant assayed according to the procedure of Maruyama et al. (1966).
In vivo PEPCase activity:was estimated by exposing nodules to 14CO
2 in a plexiglass chamber using the method of Kar et
al. (1990).
Statistical analysis: The data were subjected to an analysis of variance, and the means compared by the LSD test (p<0.05). All values are means of six replicates.
RESULTS AND DISCUSSION
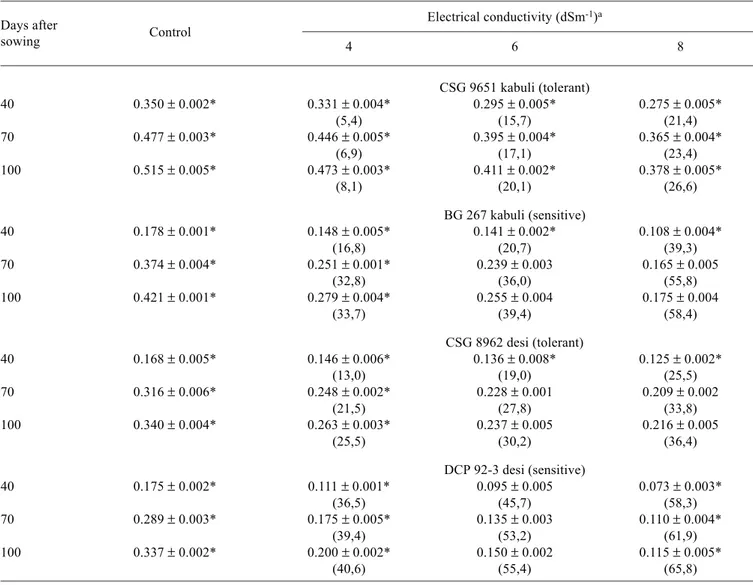
Salinity significantly reduced the overall growth of plants irrespective of the type of cultivar. This was evident from the decline in the dry mass of roots and shoots with increasing stress (tables 2 and 3). The root weights showed a greater decline than the shoot mass in all the cultivars and at all stages of growth. However, the smallest reduction was seen in CSG 9651 (kabuli) and the largest in DCP 92-3 (desi). Decreases in root and shoot mass have been reported earlier for desi chickpea (Elsheikh and Wood, 1990; Singh et al., 2001). A decline in root dry mass may be a disadvantage in terms of the plant’s ability to seek nutrients in the soil and transport them to growing shoots. Therefore, a decrease in shoot dry matter accompanied by a decline in root dry matter is a normal growth phenomenon (Hawkins and Lewis, 1993). Shoot growth is a complex process and several factors other than
Table 2. Effect of different levels of salinity on the dry mass of roots (g per plant) in the desi and kabuli cultivars of chickpea.
Values in parenthesis represent percent decrease (-) over control.
Electrical conductivity (dSm-1)a
4 6 8
CSG 9651 kabuli (tolerant)
40 0.350 ± 0.002* 0.331 ± 0.004* 0.295 ± 0.005* 0.275 ± 0.005*
(5,4) (15,7) (21,4)
70 0.477 ± 0.003* 0.446 ± 0.005* 0.395 ± 0.004* 0.365 ± 0.004*
(6,9) (17,1) (23,4)
100 0.515 ± 0.005* 0.473 ± 0.003* 0.411 ± 0.002* 0.378 ± 0.005*
(8,1) (20,1) (26,6)
BG 267 kabuli (sensitive)
40 0.178 ± 0.001* 0.148 ± 0.005* 0.141 ± 0.002* 0.108 ± 0.004*
(16,8) (20,7) (39,3)
70 0.374 ± 0.004* 0.251 ± 0.001* 0.239 ± 0.003 0.165 ± 0.005
(32,8) (36,0) (55,8)
100 0.421 ± 0.001* 0.279 ± 0.004* 0.255 ± 0.004 0.175 ± 0.004
(33,7) (39,4) (58,4)
CSG 8962 desi (tolerant)
40 0.168 ± 0.005* 0.146 ± 0.006* 0.136 ± 0.008* 0.125 ± 0.002*
(13,0) (19,0) (25,5)
70 0.316 ± 0.006* 0.248 ± 0.002* 0.228 ± 0.0010.209 ± 0.002
(21,5) (27,8) (33,8)
100 0.340 ± 0.004* 0.263 ± 0.003* 0.237 ± 0.005 0.216 ± 0.005
(25,5) (30,2) (36,4)
DCP 92-3 desi (sensitive)
40 0.175 ± 0.002* 0.111 ± 0.001* 0.095 ± 0.005 0.073 ± 0.003*
(36,5) (45,7) (58,3)
70 0.289 ± 0.003* 0.175 ± 0.005* 0.135 ± 0.003 0.110 ± 0.004*
(39,4) (53,2) (61,9)
100 0.337 ± 0.002* 0.200 ± 0.002* 0.150 ± 0.002 0.115 ± 0.005*
(40,6) (55,4) (65,8)
aValues are means ± SE of six replicates *Significant at p < 0.005
Days after
sowing Control
reduced root growth are involved. According to Cheeseman (1988), salinity stress imposes additional energy requirements on plant cells and diverts metabolic carbon to storage pools so that less carbon is available for growth.
Table 3. Effect of different levels of salinity on the dry mass of shoots (g per plant) in the desi and kabuli cultivars of chickpea. Values in parenthesis represent percent decrease (-) over control.
Electrical conductivity (dSm-1)a
4 6 8
CSG 9651 kabuli (tolerant)
40 1.000 ± 0.003* 0.965 ± 0.005 0.932 ± 0.002* 0.898 ± 0.004*
(3,5) (6,8) (10,2)
70 1.944 ± 0.004* 1.866 ± 0.006 1.773 ± 0.003* 1.688 ± 0.005*
(4,0) (8,7) (13,1)
100 2.561 ± 0.001* 2.361 ± 0.001* 2.221 ± 0.001* 2.112 ± 0.002
(6,7) (13,2) (17,5)
BG 267 kabuli (sensitive)
40 0.885 ± 0.005* 0.763 ± 0.003* 0.732 ± 0.002* 0.672 ± 0.002*
(13,7) (16,2) (24,3)
70 1.685 ± 0.004* 1.334 ± 0.004 1.272 ± 0.002 1.145 ± 0.004
(20,8) (24,5) (33,0)
100 2.300 ± 0.002* 1.784 ± 0.002 1.685 ± 0.005 1.476 ± 0.005
(22,2) (26,5) (35,8)
CSG 8962 desi (tolerant)
40 0.571 ± 0.001* 0.538 ± 0.005 0.521 ± 0.001* 0.475 ± 0.005*
(5,7) (8,7) (16,8)
70 1.572 ± 0.004* 1.348 ± 0.006 1.274 ± 0.004 1.215 ± 0.006
(14,6) (19,3) (23,0)
100 2.182 ± 0.002* 1.852 ± 0.002 1.678 ± 0.005 1.587 ± 0.005
(15,1) (23,0) (27,2)
DCP 92-3 desi (sensitive)
40 0.517 ± 0.003* 0.411 ± 0.001* 0.382 ± 0.002* 0.348 ± 0.004
(20,5) (26,1) (32,6)
70 1.402 ± 0.002* 1.041 ± 0.0010.962 ± 0.003 0.854 ± 0.004
(25,7) (31,3) (39,0)
100 1.922 ± 0.002* 1.389 ± 0.004 1.232 ± 0.002 1.047 ± 0.006
(27,7) (35,9) (45,5)
aValues are means ± SE of six replicates *Significant at p < 0.005
Days after
sowing Control
in nodulation under salt stress. However, recent reports of Soussi et al. (1999) and Cordovilla et al. (1999) indicate a surge in nodule growth which subsequently led to an increase in nodule dry mass.
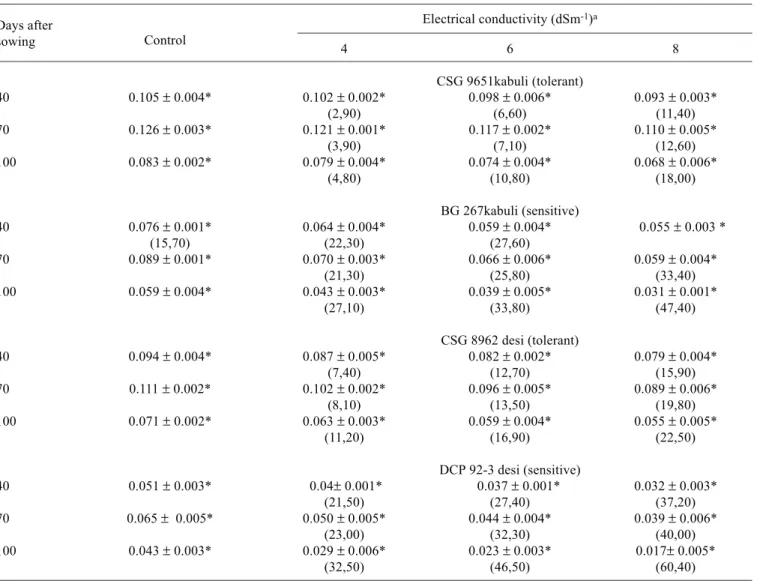
Nodule ARA decreased consistently in all cultivars under salinity and the adverse effects became accentuated as the duration of stress increased (table 4). Cultivars CSG 9651 and CSG 8962 showed significantly higher nitrogenase activity as compared to BG 267 and DCP 92-3. The tolerant cultivars showed a surge in nodule growth and subsequently in ARA, due to an increase in nodule number as well as dry mass. Sensitive cultivars showed lower ARA values than the tolerant ones with salt treatment. These results suggest that the increase in nodular biomass in tolerant cultivars under
salinity could partly offset the inhibition of nitrogenase activity. Decreased ability of nodules to reduce C2H2 under salinity has been well documented for other legumes (Serraj et al., 1998; Ferri et al., 2000). The inhibition of ARA by salt stress may be due to a limitation of oxygen diffusion in nodules or due to toxic effects of Na or Cl accumulation (Serraj, 1998).The reduction in ARA from 70 to 100 DAS was partly due to salt reducing the activity of pre-formed nodules and partly due to the reduced differentiation of new pink nodules.
Table 4. Effect of different levels of salinity on the rate of nitrogenase activity (ARA ηmoles ethylene.mg nodule dry weight-1.h-1)
in the desi and kabuli cultivars of chickpea. Values in parenthesis represent percent decrease (-) over control.
Electrical conductivity (dSm-1)a
4 6 8
CSG 9651kabuli (tolerant)
40 0.105 ± 0.004* 0.102 ± 0.002* 0.098 ± 0.006* 0.093 ± 0.003*
(2,90) (6,60) (11,40)
70 0.126 ± 0.003* 0.121 ± 0.001* 0.117 ± 0.002* 0.110 ± 0.005*
(3,90) (7,10) (12,60)
100 0.083 ± 0.002* 0.079 ± 0.004* 0.074 ± 0.004* 0.068 ± 0.006*
(4,80) (10,80) (18,00)
BG 267kabuli (sensitive)
40 0.076 ± 0.001* 0.064 ± 0.004* 0.059 ± 0.004* 0.055 ± 0.003 *
(15,70) (22,30) (27,60)
70 0.089 ± 0.001* 0.070 ± 0.003* 0.066 ± 0.006* 0.059 ± 0.004*
(21,30) (25,80) (33,40)
100 0.059 ± 0.004* 0.043 ± 0.003* 0.039 ± 0.005* 0.031 ± 0.001*
(27,10) (33,80) (47,40)
CSG 8962 desi (tolerant)
40 0.094 ± 0.004* 0.087 ± 0.005* 0.082 ± 0.002* 0.079 ± 0.004*
(7,40) (12,70) (15,90)
70 0.111 ± 0.002* 0.102 ± 0.002* 0.096 ± 0.005* 0.089 ± 0.006*
(8,10) (13,50) (19,80)
100 0.071 ± 0.002* 0.063 ± 0.003* 0.059 ± 0.004* 0.055 ± 0.005*
(11,20) (16,90) (22,50)
DCP 92-3 desi (sensitive)
40 0.051 ± 0.003* 0.04± 0.001* 0.037 ± 0.001* 0.032 ± 0.003*
(21,50) (27,40) (37,20)
70 0.065 ± 0.005* 0.050 ± 0.005* 0.044 ± 0.004* 0.039 ± 0.006*
(23,00) (32,30) (40,00)
100 0.043 ± 0.003* 0.029 ± 0.006* 0.023 ± 0.003* 0.017± 0.005*
(32,50) (46,50) (60,40)
aValues are means ± SE of six replicates * Significant at p < 0.05
Days after
sowing Control
Figure1. Effect of different levels of salinity on nodule
number per plant in the desi and kabuli cultivars of chickpea. The columns represent the means ± standard error. DAS = days after sowing.
Figure 2. Effect of different levels of salinity on the dry
mass (g.plant-1) of nodules in the desi and kabuli
cultivars of chickpea. The columns represent the means
± standard error.
Nodule number per plant
El
e
ct
ri
ca
l
co
n
d
u
ct
ivi
ty
(d
Sm
-1)
Electrical conductivity (dSm-1)
N
o
d
u
le
d
ry
ma
ss
(g
.p
la
n
t
-1) CONTROL
CONTROL
CONTROL
CONTROL
100 DAS 70 DAS 40 DAS
CON
TRO
L
CO
NTRO
L
CO
NTRO
L
CON
TRO
L
CSG 9651 CSG 8962
BG 267 DCP 92-3 8
6 4
8 6 4
8 6 4
8 6 4
0 20 40 60 80 100 120 140
CSG 9651
BG 267
CSG 8962
DCP 92-3 0.25
0.2
0.15
0.1
0.05
0
4 6 8 4 6 8 4 6 8 4 6 8
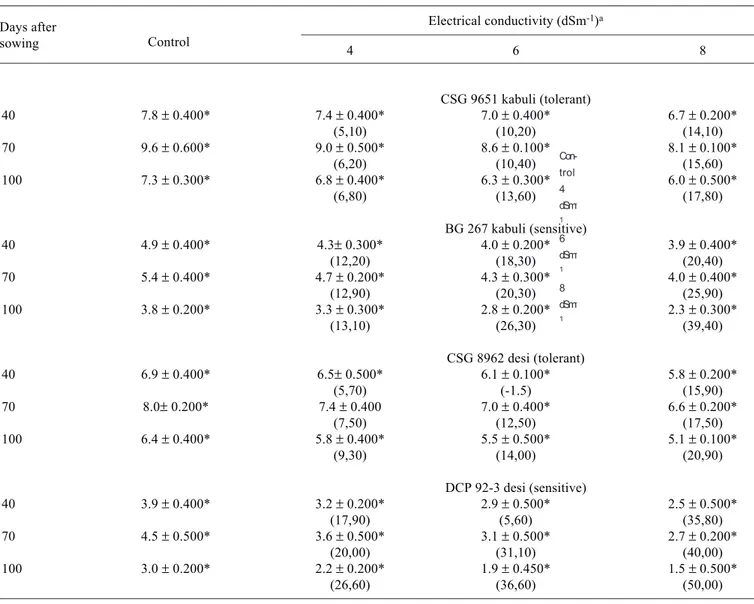
Table 5. Effect of different levels of salinity on the total nitrogen content (µg.mg dry weight-1) in desi and kabuli cultivars of
chickpea. Values in parenthesis represent percent decrease (-) over control.
Electrical conductivity (dSm-1)a
4 6 8
CSG 9651 kabuli (tolerant)
40 7.8 ± 0.400* 7.4 ± 0.400* 7.0 ± 0.400* 6.7 ± 0.200*
(5,10) (10,20) (14,10)
70 9.6 ± 0.600* 9.0 ± 0.500* 8.6 ± 0.100* 8.1 ± 0.100*
(6,20) (10,40) (15,60)
100 7.3 ± 0.300* 6.8 ± 0.400* 6.3 ± 0.300* 6.0 ± 0.500*
(6,80) (13,60) (17,80)
BG 267 kabuli (sensitive)
40 4.9 ± 0.400* 4.3± 0.300* 4.0 ± 0.200* 3.9 ± 0.400*
(12,20) (18,30) (20,40)
70 5.4 ± 0.400* 4.7 ± 0.200* 4.3 ± 0.300* 4.0 ± 0.400*
(12,90) (20,30) (25,90)
100 3.8 ± 0.200* 3.3 ± 0.300* 2.8 ± 0.200* 2.3 ± 0.300*
(13,10) (26,30) (39,40)
CSG 8962 desi (tolerant)
40 6.9 ± 0.400* 6.5± 0.500* 6.1 ± 0.100* 5.8 ± 0.200*
(5,70) (-1.5) (15,90)
70 8.0± 0.200* 7.4 ± 0.400 7.0 ± 0.400* 6.6 ± 0.200*
(7,50) (12,50) (17,50)
100 6.4 ± 0.400* 5.8 ± 0.400* 5.5 ± 0.500* 5.1 ± 0.100*
(9,30) (14,00) (20,90)
DCP 92-3 desi (sensitive)
40 3.9 ± 0.400* 3.2 ± 0.200* 2.9 ± 0.500* 2.5 ± 0.500*
(17,90) (5,60) (35,80)
70 4.5 ± 0.500* 3.6 ± 0.500* 3.1 ± 0.500* 2.7 ± 0.200*
(20,00) (31,10) (40,00)
100 3.0 ± 0.200* 2.2 ± 0.200* 1.9 ± 0.450* 1.5 ± 0.500*
(26,60) (36,60) (50,00)
aValues are means ± SE of six replicates * Significant at p < 0.05
Days after
sowing Control
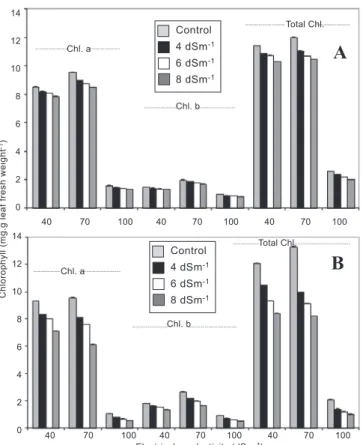
Figure 3. Effect of different levels of salinity on the chlorophyll a and b, and total chlorophyll content (mg.g leaf fresh
weight-1) of the tolerant CSG 8962 (A) and sensitive DCP 92-3 (B) desi cultivars of chickpea. The columns represent
the means ± standard error.
Days after sowing (Das)
C
h
lo
ro
p
h
yl
(mg
.g
l
e
a
f
fre
sh
w
e
ig
h
t
-1)
C
h
lo
ro
p
h
yl
l
(mg
.g
l
e
a
f
fre
sh
w
e
ig
h
t
-1)
Days after sowing (Das)
A
Control 4 dSm-1
6 dSm-1
8 dSm-1
Con-trol 4 dSm -1
6 dSm -1
8 dSm -1
B
Chl. a
Chl. b
Total Chl.
Chl. a
Chl. b
Total Chl. 16
14
12
10
8
6
4
2
0
40 70 100 40 70 100 40 70 100
18
16
14
12
10
8
6
2
0
Table 6. Effect of different levels of salinity on Rubisco activity (µmol CO2.g fresh weight-1.h-1 ) in thedesi and kabuli cultivars
of chickpea. Values in parenthesis represent percent decrease (-) over control.
Electrical conductivity (dSm-1)a
4 6 8
CSG 9651 kabuli (tolerant)
40 4.27 ± 0.060 4.19 ± 0.055* 4.00 ± 0.020* 3.87 ± 0.070*
(1,80) (6,30) (9,30)
70 4.54 ± 0.060* 4.40 ± 0.040 4.21 ± 0.050* 4.07 ± 0.070*
(3,00) (7,20) (10,30)
100 4.00 ± 0.010* 3.84 ± 0.020 3.64 ± 0.010* 3.48 ± 0.060*
(4,00) (9,00) (13,00)
BG 267 kabuli (sensitive)
40 2.74 ± 0.030* 2.17 ± 0.070* 1.84 ± 0.060* 1.48 ± 0.070*
(20,80) (32,80) (45,90)
70 3.17 ± 0.050* 2.32 ± 0.020* 1.78 ± 0.020* 1.57 ± 0.030*
(26,80) (43,80) (50,40)
100 2.11 ± 0.020* 1.35 ± 0.050* 1.00 ± 0.050* 0.81 ± 0.010*
(36,00) (52,60) (61,60)
CSG 8962 desi (tolerant)
40 3.97 ± 0.010* 3.74 ± 0.040* 3.62 ± 0.030* 3.33 ± 0.030*
(5,70) (8,80) (16,10)
70 4.07 ± 0.060* 3.80 ± 0.010* 3.66 ± 0.080* 3.36 ± 0.080*
(6,60) (10,00) (17,40)
100 3.53 ± 0.030* 3.20 ± 0.030* 3.00 ± 0.0200* 2.73 ± 0.010*
(9,30) (15,00) (22,60)
DCP 92-3 desi (sensitive)
40 2.64 ± 0.040* 2.00 ± 0.040* 1.73 ± 0.070* 1.34 ± 0.070*
(24,20) (34,40) (49,20)
70 2.81 ± 0.010* 1.94 ± 0.050* 1.44 ± 0.040* 1.00 ± 0.040*
(30,90) (48,70) (64,40)
100 1.90 ± 0.050* 1.11 ± 0.045* 0.78 ± 0.010* 0.53 ± 0.060*
(41,50) (58,90) (72,40)
aValues are means ± SE of six replicates * Significant at p < 0.05
Days after
sowing Control
Leaf chlorophyll content (chlorophyll a and b and total chlorophyll) were reduced significantly in all the chickpea cultivars as a result of increasing salinity, the decrease being greater in BG 267 and DCP 92-3 (susceptible genotypes) (figures 3A and 3B; figures 4A and 4B). Saline stress led to the yellowing of leaves, which ultimately resulted in significant damage to the chlorophyll pigments. Similar results have been reported for other legumes (Soussi et al., 1998; Al-Khanjari et al., 2002). The inhibitory effects of salt on chlorophylls could be due to suppression of specific enzymes responsible for the synthesis of green pigments (Strogonove et al., 1970), an effect that depended on the biological processes and development stages of the plant and also on the type and concentration of the salts. The decrease in chlorophyll may be attributed to increased chlorophyllase
activity (Sudhakar et al., 1997). The lower reduction of chlorophyll pigments in the tolerant genotypes might have been responsible for the higher dry matter accumulation in them.
The Rubisco activity in the leaves was also inhibited by salinity similar to the degradation of leaf chlorophylls (table 6). The magnitude of Rubisco inhibition was also salt concentration and cultivar dependent. The decrease in Rubisco activity by salt may be attributed to the sensitivity of this enzyme to chloride ions as suggested by Seeman and Critchley (1985). However, Sudhakar et al. (1997) attributed the decrease in Rubisco activity, in the presence of salts, to a decrease in the efficiency of this enzyme, rather than its concentration.
capacity. The present study showed that PEPCase activity was stimulated in response to salt stress, the degree of stimulation being concentration dependent. However, in the sensitive cultivar DCP 92-3 the activity increased under lower saline concentrations but declined with higher salt dosages (figure 5A and 5B). In legumes, an increase in PEPCase activity caused by flooding or oxygen stress has also been reported (Irigoyen et al., 1992). Guerrier (1988) proposed that higher PEPCase activity could be used as a biochemical indicator of salt tolerance. Drevon et al. (1998) suggested that PEPCase may be involved in the regulation of turgescence or active osmocontraction of cells of the inner cortex, which is a proposed mechanism of the oxygen diffusion barrier. Further the lack of photosynthate did not inhibit the PEPCase-MDH pathway which supports the hypothesis concerning the limitation in supply of energy substrates (mainly malate) to the bacteroids. The inhibition of nitrogenase activity by salt stress may be a consequence of the decrease in malate content in the nodules and it could be offset in the tolerant cultivar by an increase in the mean nodule weight (Soussi et al .,
1999). In the present study, the response of nitrogen fixation to salt was more pronounced than the response of photosynthesis which together with carbohydrate accumulation found in shoots, suggests that lack of photosynthates did not cause the inhibition in nitrogenase activity under this type of stress.
In the light of present results, discussed in detail above, it may be concluded that saline soils inhibit growth, metabolic activity and symbiotic performance of different cultivars of chickpea. However, important variabilities in terms of growth, photosynthesis, nitrogen assimilation and carbon metabolism were observed amongst different cultivars of chickpea. The data suggests that lack of photosynthates did not cause inhibition of ARA under salinity and moreover, changes in the nodular metabolism seemed to be directly responsible for nitrogen fixation by the tolerant cultivars. The greater performance of symbiosis under saline conditions seems to be determined mainly by the tolerance of the legume host plant. In general, both kabuli genotypes seemed to have a better potential for salt tolerance compared to the desi cultivars. Even the sensitive kabuli exhibited significantly higher salt resistance than the sensitive desi. Tolerance to salinity seems to be directly related to a number of physiological and biochemical traits such as increased nodule number, nodule dry mass, stimulation of nodule PEPCase activity, higher Rubisco and nitrogenase activities, as found for the tolerant kabuli and desi cultivars of chickpea. These parameters proved to be excellent indices of tolerance to saline stress in this species.
Figure 4. Effect of different levels of salinity on the chlorophyll a
and b, and total chlorophyll content (mg.g leaf fresh weight-1) of
the tolerant CSG 9651 (A) and sensitive BG 267 kabuli cultivars of chickpea. The columns represent the means ± standard error.
Electrical conductivity (dSm-1)
in vi tro PEPC a se ( µ mo l N AD H .g F W -1.h -1)
B
Control 4 dSm-16 dSm-1
8 dSm-1
40 70 100 40 70 100 40 70 100
Chl. a
Chl. b
Total Chl.
A
40 70 100 40 70 100 40 70 100
14 12 10 8 6 4 2 0 Chl. a Chl. b Total Chl. in vi vo PEPC a se ( µ mo l N AD H .g F W -1.h -1)
Figure 5. Effect of different levels of salinity on in vivo (A) and in
vitro (B)PEPCase activity in the kabuli and desi cultivars of chickpea. The columns represent the means ± standard error.
Days after sowing (Das)
C h lo ro p h yl l (mg .g l e a f fre sh w e ig h t -1)
A
B
40 DAS 70 DAS 100 DAS 40 DAS 70 DAS 100 DAS 1.4 1.2 1 0.8 0.6 0.4 0.2 00 4 6 8 0 4 6 8 0 4 6 8 0 4 6 8
0 4 6 8 0 4 6 8 0 4 6 8 0 4 6 8
7 6 5 4 3 2 1 0 DCP 92-3 CSG 8962 BG 267 CSG 9651 CSG 9651 BG 267 CSG 8962 DCP 92-3 Control 4 dSm-1
6 dSm-1
8 dSm-1
Acknowledgements: Wethank Dr.S.K.Sharma (CSSRI) for the seeds and Dr. Bhupinder Singh (IARI) for the Rhizobium
culture used in this work. This research formed part of a Ph.D thesis of the second author.
REFERENCES
Al-Khanjari S, Al-Kathiri A, Esechie H A (2002) Variation in chlorophyll meter readings, nodulation and dry matter yields of alfalfa (Medicago sativa L.) cultivars differing in salt tolerance. Crop Res. 24:350-356.
Ashraf M, Waheed A (1993) Responses of some genetically diverse lines of chickpea (Cicer arietinum L.) to salt. Plant Soil 154:257-266.
Cheesman JM (1988) Mechanisms of salinity tolerance in plants. J. Plant Physiol. 87:547-550.
Christellar JT, Laing WA, Sutton WD (1977) Carbon dioxide fixation by lupin nodules. I. Characterisation associated with Phosphoenol Pyruvate carboxylase and correlation with nitrogen fixation during nodule development. Plant Physiol. 60:47-50. Cordovilla MDP, Ligero F, Lluch C (1999) Effect of salinity on
growth, nodulation and nitrogen assimilation in nodules of faba bean (Vicia faba L.). Applied Soil Eco. 11:1-7.
Delgado MJ, Ligero F, Lluch C (1994) Effects of salt stress on growth and nitrogen fixation by pea, faba-bean, common bean, and soybean plants. Soil Biol. Biochem. 26:371-376. Drevon JJ, Frangne N, Fleurat- Lessard, Payre H, Ribet J, Vadez V,
Serraj R (1998) Is nitrogenase - linked respiration regulated by osmocontractile cells in legume nodules? In: Elmerich C., Kondorosi A, Newton WE (eds), Biological Nitrogen Fixation for the 21st Century, pp. 465-466. Kluwer Academic Publishers,
Dordrecht.
Elsheikh EAE, Wood M (1990) Effect of salinity on growth, nodulation and nitrogen yield of chickpea (Cicer arietinum L.). J. Exp. Bot. 41:1263-1269.
Ferri A, Lluch C, Ocana A (2000) Effect of salt stress on carbon metabolism and bacteroid respiration in root nodules of common bean (Phaseolus vulgaris L.). Plant Biol. 2:396-402.
Guerrier G (1988) Capacites PEPCase et MDH extraites des plantules germees en milieu sale: des parameters biochimiques de l’ ecophysiologic de la plante? Seed Sci. Tech. 16:571-578. Hawkins HJ, Lewis OAM (1993) Combination effect of NaCl salinity,
nitrogen form and calcium concentration on the growth, ionic content and gaseous exchange properties of Triticum aestivum
L.cv. Gamtoos. New Phytol. 124:161-170.
Helal M, Koch K, Mengel K (1975) Effect of salinity and potassium on the uptake of nitrogen and on nitrogen metabolism in young barley plants. Physiol. Plant. 35:310-313
Herdina JA, Silsbury JH (1990) Estimating nitrogenase activity of faba bean (Vicia faba L.) by acetylene reduction (AR) assay. Aust. J. Plant Physiol. 17:489-502.
Hiscox TD, Israelstam GF (1979) A method for extraction of chlorophyll from leaf tissue without maceration. Can. J. Bot. 57:1332-34.
Irigoyen JJ, Emerich DW, Sanchez-Diaz M (1992) Water stress induced changes in concentrations of proline and total soluble sugars in nodulated alfalfa (Medicago sativa) plants. Physiol. Plant. 84:55-60.
Kar M, Mythili J B, Nair TVR (1990) Carbon dioxide fixation in the nodules of amide transporting versus ureide transporting legumes. J. Nuclear Agric. Biol. 19:257-260.
Keys JA, Parry MAJ (1990) Ribulose biphosphate carboxylase / oxygenase and carbonic anhydrase. In: Lea PJ (ed), Methods in Plant Biochemistry vol. 3, pp.1-14. Academic Press, London. Ligero F, Lluch C, Olivares J (1986) Evolution of ethylene from
roots of Medicago sativa plants inoculated with Rhizobium meliloti. J. Plant Physiol. 125:361-365.
Linder RC (1944) Rapid analytical methods for some of the more common inorganic constituents of plant tissue. Plant Physiol. 19:76-89.
Rao DLN, Giller KE, Yeo AR, Flowers TJ (2002) The effects of salinity and sodicity upon nodulation and nitrogen fixation in chickpea (Cicer arietinum) Ann. Bot. 89:563-570.
Rout NP, Shaw BP (2001) Salt tolerance in aquatic macrophytes: Ionic relation and interaction. Biol. Plant. 44:91-95.
Seeman JR, Chritchley C (1985) Effect of salt stress on the growth, ion content, stomatal behaviour and photosynthetic capacity of salt sensitive species Phaseolus vulgaris L. Planta 164:151-162.
Sekeroglu N, Kara MS, Dede O, Askin T (1999) Effect of salinity on germination, early seedling growth, Na and K constituents of chickpea. Turk. J. Field Crops 4:79-84
Serraj R (2002) Response of symbiotic nitrogen fixation to drought and salinity stresses. Physiol. Mol. Biol. 8:77-86.
Serraj R, Vasquez- Diaz H, Drevon JJ (1998) Effects of salt stress on nitrogen fixation, oxygen diffusion, and ion distribution in soybean, common bean, and alfalfa. J. Plant Nutr. 21:475-488. Sheokand S, Dhandi S, Swaraj K (1995) Studies on nodule functioning and hydrogen peroxide scavenging enzymes under salt stress in chickpea nodules. Plant Physiol. 33:561-566. Singh AK, Singh RA, Sharma SG (2001) Salt stress induced changes
in certain organic metabolites during seedling growth of chickpea. Legume Res. 24:11-15.
Sleime N, Lachaal M, Abdelly C (1999) Responses of some Tunisian chickpea (Cicer arietinum) varieties to salinity in nutrient solution. Luter. Chin. Pigeonpea News 6: 23-26.
Soussi M, Lluch C, Ocana A (1999) Comparative study of nitrogen fixation and carbon metabolism in two chickpea (Cicer arietinum L.) cultivars under salt stress. J. Exp. Bot. 50:1701-1708.
Soussi M, Ocana A, Lluch C (1998) Effect of salt stress on growth, photosynthesis and nitrogen fixation in chickpea (Cicer arietinum L.). J. Exp. Bot. 49:1329-37.
Strogonove BP, Kabanov VV, Shevajakova NI, Lapine LP, Kamizerko EI, Popov BA, Dostonova RK, Prykhodko LS (1970) Structure and function of plant cells in saline habitats. John Wiley and Sons, New York.
Sudhakar C, Ramanjulu S, Reddy PS, Veeranjaneyulu K (1997) Response of some calvin cycle enzymes subjected to salinity shock in vitro. Indian J. Exp. Bot. 35:665-67.
Udvardi M K, Day D A (1997) Metabolite transport across symbiotic membranes of legume nodules.Annu. Rev. Plant Physiol. Plant Mol. Biol. 48:493-523.