BAR, v. 2, n. 2, art. 2, p. 17-34, july/dec. 2005
Relationship Marketing Strategies: When Buyer and
Supplier Follow Different Strategies to Achieve
Performance
Danny Pimentel Claro*
E-mail address: [email protected] Ibmec São Paulo
São Paulo, SP, Brazil
Priscila Borin de Oliveira Claro
E-mail address: [email protected]
Departamento de Administração e Economia - Universidade Federal de Lavras Lavras, MG, Brazil
Decio Zylbersztajn
E-mail address: [email protected]
Faculdade de Economia, Administração e Contabilidade - Universidade de São Paulo São Paulo, SP, Brazil
A
BSTRACTRelationship marketing is essential for success in business. The need to understand better the differences in the strategies buyers and suppliers follow is what has motivated this study. We drew on emerging perspectives on inter-firm governance and networks to develop a theoretical framework to understand the success of long-term relationships. We tested the framework using data from 67 merchant distributors (buyers) and 174 suppliers of theirs in the Dutch potted plant and flower industry. While the most successful distributors tend to take the “hard”, tangible strategy using transaction specific investments and fostering joint action, the successful suppliers take the “soft”, social approach by emphasizing trust and the norm of flexibility in the relationship.
Key words: relationship marketing strategy; trust; information; transaction specific investments; joint action; business networks.
Received 29 October 2004; received in revised form 11 May 2005.
Copyright © 2005 Brazilian Administration Review. All rights reserved, including rights for
translation. Parts of this work may be quoted without prior knowledge on the condition that
the source is identified.
* Corresponding author: Danny Pimentel Claro
I
NTRODUCTIONRelationship marketing is essential for business success. Managers continually look for challenges and opportunities, using their relationships with other suppliers and customers to obtain valuable information for their decision-making. Issues on relationship marketing have received considerable attention in network literature. A growing body of research addresses different aspects of the firms’ relationships with exchange partners from a variety of theoretical perspectives (Omta, Trienekens, & Beers, 2001). The predominant focus in much of the existing research has been on individual dyadic relationships between firms. However, there is a clear need to move beyond the dyadic relationship and explore the competitive advantages of being embedded in a business network. In this respect, it becomes essential to understand whether the strategy differs in the sales relationship and purchasing relationship of companies.
This study aims to understand the differences in the impact of the business network on a purchasing and sales relationship. To that end, we analyze the business network – in terms of the information that firms can obtain from the total set of connected relationships (e.g., with first-tier suppliers and buyers’ customers) – as well as the trust, joint action, flexibility and transaction specific investments associated with the relationship. Our study focuses on both sides (buyer and supplier) of the relationship. By collecting data from both buyers and suppliers, we explore the differences between their purchasing and sales strategies, i.e. whether or not a company in the buying position invests in specific assets in order to achieve high performance. This allows for the fine-tuning of research in the field of relationship marketing, since most previous studies collected data from only one side of the relationship.
A survey was conducted including 174 suppliers of potted plants and flowers and 67 merchant distributors in the Netherlands. The potted plant and flower industry was chosen because it is one of the most important sectors in Dutch agribusiness with sales volume of over €4 billion in 2004, accounting for over 70% of the total world trade in flowers and plants (Ministry of Agriculture, Nature and Food Quality, 2004).
T
HEORETICALF
RAMEWORK ANDR
ESEARCHH
YPOTHESESIn relationship marketing literature, the differences in strategy adopted in a purchasing relationship and a sales relationship are not so evident. Suppliers are sometimes overlooked in the assessment of a company and its relationship, probably because the selection of suppliers is frequently considered at an operations level rather than at a strategic level and is very often based on who can deliver the product a buyer wants at the lowest price. Nevertheless, without strong relationships with suppliers, a company may be placing itself in a very precarious and undesirable situation. Therefore, the elements of a relationship must be better understood in the different orientations, purchasing or sales.
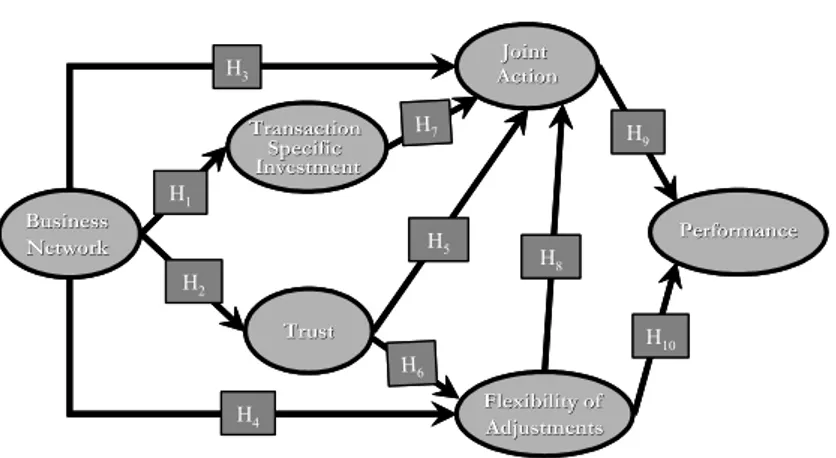
(Granovetter, 1985). Since no relationship exists in isolation, what happens or is achieved in one relationship will always relate to what is happening in at least some others (Anderson, Hakansson, & Johanson, 1994). For example, if a supplier invests in developing a new product with a specific buyer, they could successfully apply information about the production and logistic processes used in other connected relationships. The supplier might also be able to use the same approach with other buyers in other regions. The network can then be said to possess informational advantages that go beyond information exchange in Figure 1.
Hypotheses - The Impact of Network Information on the Buyer-supplier Relationship
Trust
The network in which a firm is embedded is likely to offer information that promotes trust in a buyer-supplier relationship. Networks may influence trust in three ways. First, the information obtained through the network safeguards firms against opportunism and market uncertainties (Uzzi, 1996). Network members diligently transmit information about unacceptable behavior, thus providing a mechanism for monitoring potential opportunistic behaviors. Network connections also foster common beliefs and values among member firms, leading to goal congruence and reducing the risk of opportunism. Second, the social structure of the network stimulates trust, because firms acting in a positive atmosphere are more inclined to trust. When a transaction is made with a firm of known reputation and capabilities, there is an associated implication that social bonds will guard against trouble (Thorelli, 1986). Third, network members may act as a referral for a given counterpart, since they might be dealing with the same counterpart (Burt, 1997). For instance, through connections with colleagues, a supplier could obtain valuable information by which the actions of a buyer could be monitored, since the connected firms are likely to be dealing with the same buyer.
Figure 1: Theoretical Framework
TSI
Transaction-specific investments (TSI) refer to the degree to which an asset cannot be redeployed to alternative uses and by alternative users without sacrifice of productive value (Williamson, 1996). Such investments go beyond the boundaries of the firm and are aimed at exploiting efficiencies of coordination of activities between partners. The company’s network will not blindly support counterpart’s destructive actions, especially when the counterpart’s actions may compromise economic investments or outcomes for everyone in the network. Moreover, even in cases where there is general agreement within the network about the criticality of such a destructive action, the focal firm is likely to be cautious about how its response will be perceived among members of a close-knit group (Granovetter, 1985). Without the network, firms would hardly be able to maintain an up-to-date assessment of the integrity of a counterpart’s actions and performance.
Collaboration
I
nformation transmitted through the network encourages firms to engage in joint action. Information about sales conditions and process coordination, gathered outside a relationship may aid in the solving of problems. Future plans and strategic decisions can be based partially on information on trends and product demands obtained from the network. Information obtained through the network cultivates flexibility. Firms with access to information tend to develop positive bilateral expectations of their fellow network members, which makes them inclined to adapt as circumstances change (in response to, for instance, market fluctuations or shifting counterpart demands). The information represents a guarantee that a relationship is subject to good-faith modification if a particular practice proves detrimental in the light of altered circumstances. Flexibility is an expected behavioral norm, which establishes a positive attitude to adopt requests for adjustment (Macneil, 1978). We expect that:H1-H4: The more information a firm obtains from the network, the more the network will encourage either tangible (e.g. transaction-specific investments, H1), or intangible investments, e.g. in terms of trust (H2), and collaborative behavior (joint action, H3 and flexibility, H4) in a buyer-supplier relationship.
The Impact of Trust on the Buyer-supplier Relationship
Considering the benefits of trust, we posit a positive causal path from trust to collaborative behavior. As discussed previously, trust not only offers the benefits of calculative economics but also the soft side of affection and belief in partners and the security of an ongoing relationship. Joint actions offer advantages in problem solving and planning because partners in a trusting buyer-supplier relationship collectively have a greater store of knowledge, experience and creativity to identify and solve problems with as well as to establish effective planning. Once trust is established, firms learn that coordinated, joint efforts lead to outcomes that exceed what the firm could achieve if it acted solely in its own interest (Anderson & Narus, 1990). This suggests that firms that trust one another will exchange relevant, comprehensive, accurate and timely information, thereby jointly contributing to problem-solving and planning efforts (Zand, 1972). If the focal company trusts its partner, it will be more willing to react flexibly to changing conditions or demands of the partner (Morgan & Hunt, 1994). Trusting relationships are especially important in the ambiguous situations that often characterize buyer-supplier relationships. If a company feels that its partner’s behavior is in the interest of the relationship as a whole, and not only in the interest of the partner, the flexibility norm of exchange will be high. According to Powell (1990), trust leads to a more rapid flow of information and a high level of open communication. Trust creates a perceived supportive climate that encourages a firm to adapt as circumstances unfold (Anderson & Narus, 1990). We then expect that:
H5-H6: The more the partners trust each other, the higher the degree of collaborative behavior will be in a buyer-supplier relationship.
The Impact of TSI and Flexibility on Joint Action
There might be two effects of TSI over joint actions. Firstly, joint actions may serve to safeguard high TSI. This is because joint actions create grounds for bilateral governance in the relationship (Williamson, 1996), which helps to reduce the opportunistic tendencies that erode the value of specific assets. Secondly, joint action may facilitate coordination of activities and resources in buyer-supplier relationships. To some extent, almost any firm’s investment entails some specialized knowledge that needs sophisticated coordination effort. Heide and John’s (1990) study of equipment manufacturers and suppliers provided empirical evidence for this notion. They found that higher TSI of manufacturers was associated with increased joint problem solving and planning as a way to coordinate activities and resources in the relationship effectively.
handling processes (e.g., perishable products). Firms may set formal and rigid guidelines as to how a problem should be solved, yet such rigidity reduces creativity in the teamwork (Calantone, Graham, & Mintu-Wimsatt, 1998). As problems emerge, it is the partners’ flexibility that fosters teamwork. This is because the parties in a relationship that adopt the norm of flexibility favor joint action rather than individual responses (Macneil, 1978). Since adjustments can be executed to internal plans, planning is continually attuned to trade conditions (e.g., varying quantities from order to order) (Macneil, 1978). Although incomplete, plans remain important because they formulate common goals and lay the foundation for the flexibility necessary for reformulating plans in the future. Thus, we expect that:
H7 and H8: The higher the degree of TSI (H7) and flexibility (H8), the higher the degree of joint action there will be in a buyer-supplier relationship.
The Impact of Collaborative Behavior on Performance
Firms engaged in collaboration are likely to perform well. Firms have various ways of measuring high performance. In order to capture the effects of performance better, previous studies adopted measures of financial performance (e.g. profitability and the sales growth rate) and one subjective measure of performance (e.g. perceived satisfaction). Previous research using these measures of performance has found that firms perform well once they engage in joint action with mutual interest in finding ways to add value or save costs (Mohr & Speckman, 1994). When parties engage in joint problem solving, mutually satisfactory solutions to problems are likely to be found, thereby enhancing the success of the firm and the satisfaction in the buyer-supplier relationship. In joint problem solving, a firm often tries to persuade another to adopt a particular solution to a situation of conflict. These persuasive attempts are generally more constructive than the use of coercion or domination (Deutsch, 1969). Joint planning reduces the risk of unexpected problems, in turn reducing the need for a sophisticated monitoring apparatus. Since future contingencies, and consequential duties and responsibilities in a relationship, are made explicit in plans ex ante, the time and resources so often spent on solving a conflict are reduced to a great extent. Planning together with the counterpart actually operates as an aid or frame of reference and can replace contracts, which are costly to write and enforce. In addition, the flexibility of firms may enhance their performance (Cannon, Achrol, & Gundlach, 2000). Flexibility enables parties to adjust to each other’s needs and requests. The establishment of a bilateral mode of governance, in the form of the flexibility of both parties to make adjustments, is likely to increase the effectiveness and efficiency with which tasks are performed (Lusch & Brown, 1996). In a bilateral system, individual goals are reached through joint accomplishment, and concern for the long-term benefits of the system serves to restrain individual tendencies toward self-interest (Heide, 1994), i.e., because the parties have a collective incentive to maintain the buyer-supplier relationship, the buyer and supplier engage in flexible behaviors, and the resulting decision-making tends to enhance performance. Thus, we expect that:
H9 and H10: The higher the collaborative behavior of the partners in a buyer-supplier relationship, the better the performance of the firm.
R
ESEARCHD
ESIGN ANDM
EASURESStudy Domain
The Dutch Flower industry is the study domain. It is an industry that is continually growing and per capita cut flower consumption in Europe averages €34.50 compared to €21.40 in the United States. In recent years, exports have increased dramatically. Not only have cut flower exports to European countries increased, but a sharp increase is also evident to the large Russian market. Rail transport is increasingly used over longer distances within Europe. The estimated 9,000 suppliers achieve fast growth in productivity due to improved greenhouses, better cultivation methods, controlled lighting and automation of vital processes to regulate climate and humidity. The buyers, generally called merchant distributors, are firms such as wholesalers, cash-and-carries and garden centers. Among the estimated 1,200 merchant distributors concentration is very much the watchword: the largest 4% (those with sales totalling more than €12 million) control nearly half of the purchases. Florists are the dominant retailers in the industry, representing 44% of the outlets, street sellers account for 25% of outlets, followed by supermarkets. But in some countries supermarkets account for the majority of sales, for instance, 40% in the UK and up to 60% in Switzerland (ProFound, 2005).
The Netherlands is renowned for its auctions. Over 89% of the trade between suppliers and buyers in this sector is affected through the services of the auctions (ProFound, 2005). The two largest, namely Aalsmeer and Flora Holland, account for more than 81% of the total trade between suppliers and buyers. The auctions offer infrastructure for the trade in two distinct channels, namely fixed lines and the auction clock. The Dutch auction clock system works via the price-reduction principle, in which the price is adjusted downward until the product is sold to the first buyer to respond. About 45% of the potted plants and flowers are traded via the auction clock. The present paper focuses on the other channel, called ‘fixed lines’, which is growing very quickly in the sector.
The fixed lines channel is expected to continue to grow in the future, because the fixed lines present advantages for both buyers and suppliers. Buyers are assured of the necessary quantity of potted plants, delivered at the requested date, time and place and at a fixed price. Suppliers know the price they will get, since it is negotiated in advance. In this way, they are no longer dependent on the auction clock with its unpredictable prices and fluctuation of volumes.
Data Collection and Research Instrument
Research Measures and Data Analysis
The business network construct refers to sets of connected relationships that are contingent (informational benefits) upon each other and that influence a focal buyer-supplier relationship. The business network then reflects the average strength of the information obtained from the business network. The measure for network connections was developed based on Anderson et al. (1994), and Blankenburg et al. (1999). To capture all the potential sets of connected relationships, five network subgroups were identified as located upstream (input suppliers such as young plants and seeds and firms that supply fertilizers, chemical products, pots, vases, etc.) and downstream the supply chain (other buyers e.g. wholesalers, flower exporters, cash-and-carries and garden centers, and buyers’ customers, such as supermarkets, flower shops and wholesalers abroad) and third parties (agents of the auction who have closed ties with both suppliers and buyers). The informational benefits of each network subgroup refer to support in three areas: setting prices, quantities and qualities; coordinating production processes and logistic operations; and foreseeing possible future actions of the counterpart.
Transaction-specific investments (TSI) are defined as one party’s perception of the extent to which an investment was made specifically for a transaction with one or a limited number of companies. Items about the Human and Physical TSI were included in the questionnaire. Human TSI refers to investments made in human resources, such as staff training, and other business practices specifically intended for operating with the selected counterpart. This dimension was measured with a scale containing three items adapted from Heide and John (1984), and Bensaou and Venkatraman (1995). The dimension of physical TSIrefers to investments in equipment, machinery and special docks and wagons. A two-item scale measured this dimension.
Trust refers to the belief that the other partner is honest and sincere and will not deliberately damage the relationship. Trust reflects the expectation that negotiations will be fair and commitments will be sustained (Anderson & Narus, 1990). Trust is captured in two dimensions, interpersonal and inter-organizational trust. Interpersonal trust refers to the trust placed by the respondent in the contact person of the selected partner. It was measured using a five-item scale. Inter-organizational trust
refers to that trust placed in the organization of the selected partner. This dimension was assessed with six items adapted from Zaheer and Venkatraman (1998).
Collaboration refers to situations in which partners work together to achieve mutual goals (Anderson & Narus, 1990; Morgan & Hunt, 1994). The collaboration construct has two dimensions: the norm of flexibility and joint action. The norm of flexibility is defined as the extent to which a partner shows an accommodating response to changing circumstances (Heide, 1994). Flexibility to make adjustments is measured by three items describing the partners’ expectations of one another. Joint action was calculated by measuring the degree of joint planning and joint problem solving. Joint planning is defined as the extent to which future contingencies, and consequential duties and responsibilities in a relationship have been made explicit ex ante. The four-item scale refers to joint goal setting and making demand forecasts together. This is in line with Heide and John (1990). Joint problem solving is defined as the extent to which joint activities are organized to resolve disagreements, technical failures and other unexpected situations (Lusch & Brown, 1996). The four-item scale was adopted from Heide and Miner (1992).
A multidimensional measure of performance was used. Two measures of financial performance, profitability and the sales growth rate, were combined with one affective dimension, perceived satisfaction. This dimension is defined as the assessment of the respondent’s satisfaction: how well the business relationship with the selected partner achieves the expectations. Perceived satisfaction was measured by a six-item scale adapted from Bensaou and Venkatraman (1995), also used by Doney and Cannon (1997), and Zaheer, Mcevily and Perrone (1998). Appendix A provides an overview of the items used in the questionnaire.
warrant confidence in the internal consistency of the scales. The correlations between the constructs did not suggest problems of pairwise co-linearity or covariance that would preclude the use of all constructs in one equation. Researchers commonly use a cut-off of 0.80 for correlations among variables for dismissing multi-colinearity problems (Malhotra, 1999). All correlation coefficients are below .60, except for three correlations that fall below .78. The other validity and reliability checks were also positive.
Different statistical methods were used to analyze the data. The bivariate procedures included one-way ANOVA, the Kruskal-Wallis test, and the Spearman rank correlation. The multivariate procedures included factor analysis and structural equation modeling in Lisrel 8.50. Structural equation modeling is a powerful method for testing causal models because it enables the simultaneous evaluation of the individual paths constituting the model, total effects and how well the complete model fits (Hair et al., 1998). Two models were estimated, one of the supplier sample, and another of the buyer sample (Figures 2 and 3). The estimation followed the one-step procedure taking all the observed variables (the items in the questionnaire) to calculate the latent variable (see Claro, 2004, for more details on the estimation procedure).
R
ESULTSThe characteristics of the companies that participated in our survey show the representativeness of our samples. Only 10% of the supplier and the buyer companies count more than 60 employees, and 50% have fewer than 15 employees. The sales difference between suppliers and buyers is apparent. While 51% of the buyers record an annual sales volume in excess of €5 million, 42% of suppliers make less than €800,000 annually. However, a cross-tab of supplier size with the size of its selected buyer turns up an interesting result. There is a large concentration of suppliers dealing with relatively smaller buyers. Interestingly, a cross-tab of the buyer sample shows that the buyers also deal with relatively smaller suppliers. Apparently, companies feel comfortable and therefore tend to engage in long-term relationships with partners which resemble the company in size or are a little bit smaller.
The particular importance of these long-term relationships to the respondents is stressed by the fact that the indicated length of the long-term relationship with the selected partner in the supplier sample averages more than 8 years (sd: 5.6) and in the buyer sample over 7 years (sd: 4.67). It ranges from 1 to 30 years in the supplier sample and from 2 to 21 years in the buyer sample. 79% of the buyers have maintained this relationship for up to 10 years, while slightly fewer suppliers (70%) report having maintained a 10-year relationship.
Figure 2: The Supplier Perspective
Figure 2 shows the results of a constrained model of our theoretical framework, where the non-significant paths of the estimated model (i.e., from business network to joint action and from trust to joint action) are set at zero. Anderson and Gerbing (1988) recommend this procedure and suggest a chi-square difference test (CDT) for nested models to test the null hypothesis (i.e., alternative constrained model – theoretical model = 0). The model presented in Figure 2 turned out to provide the best fit of the observed correlations between the concepts. It shows that several paths are significant and that the overall model fit is good. Furthermore, the analysis of the total effects (i.e. the sum of the indirect and the direct effects of one construct on another), shows that although there are no direct paths estimated in Figure 2, indirect effects can be calculated between the business network and trust, and between trust and joint action (for more details about the indirect effects, see Claro 2004).
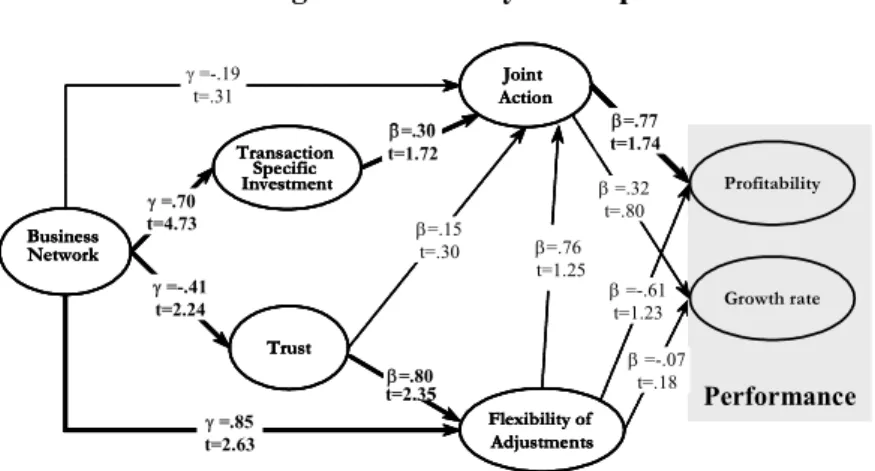
Figure 3 shows the results of the structural equation model for the buyer sample. The overall goodness of fit indices could not be calculated in the theoretical model because the model did not converge after the iterations. We then tested a similar alternative model in which the composite performance variable was replaced by the two measures of performance (growth rate and profitability). As can be seen from the results of the alternative model in figure 3, several paths are significant and the overall model fit is good. In order to provide greater confidence of the explanatory strength of the model in Figure 3, we tested our model against an alternative constrained model (not significant paths set to zero). After a CDT, the model presented in Figure 3 revealed to be more parsimonious model than the alternative constrained model.
Figure 3: The Buyer Perspective
Transaction Specific Investment Business Network Joint Action Trust Flexibility of Adjustments γ=.59 t=4.62 γ=.22 t=2.18 γ=.23 t=2.61 β=.73 t=6.01 β=.23 t=3.15 β=.82 t=6.80 β=-.95 t=2.93 Performance β=.69 t=3.29
χ2 = 85.702 (P > 0.01) df=47; GFI=0.92; AGFI=0.87; RMSR= 0.08; NFI=0.87; NNFI=0.91
Transaction Specific Investment Business Network Joint Action Trust Flexibility of Adjustments γ=.59 t=4.62 γ=.22 t=2.18 γ=.23 t=2.61 β=.73 t=6.01 β=.23 t=3.15 β=.82 t=6.80 β=-.95 t=2.93 Performance β=.69 t=3.29 Transaction Specific Investment Business Network Joint Action Trust Flexibility of Adjustments γ=.59 t=4.62 γ=.22 t=2.18 γ=.23 t=2.61 β=.73 t=6.01 β=.73 t=6.01 β=.23 t=3.15 β=.23 t=3.15 β=.82 t=6.80 β=-.95 t=2.93 Performance β=.69 t=3.29
χ2 = 85.702 (P > 0.01) df=47; GFI=0.92; AGFI=0.87; RMSR= 0.08; NFI=0.87; NNFI=0.91
Performance β=-.07 t=.18 Transaction Specific Investment Business Network Joint Action Trust Flexibility of Adjustments Growth rate γ=.70 t=4.73 γ=-.19 t=.31 γ=-.41 t=2.24 γ=.85 t=2.63 β=.15 t=.30 β=.80 t=2.35 β=.30 t=1.72 β=.76 t=1.25 β=.77 t=1.74 Profitability β=.32 t=.80 β=-.61 t=1.23
χ2 = 64.47 (P>0.01) df=28; GFI=0.90; AGFI=0.78; RMSR= 0.07; NFI=0.76; NNFI=0.75
Performance β=-.07 t=.18 Transaction Specific Investment Business Network Joint Action Trust Flexibility of Adjustments Growth rate γ=.70 t=4.73 γ=-.19 t=.31 γ=-.41 t=2.24 γ=.85 t=2.63 β=.15 t=.30 β=.80 t=2.35 β=.30 t=1.72 β=.76 t=1.25 β=.77 t=1.74 Profitability β=.32 t=.80 β=-.61 t=1.23 Performance β=-.07 t=.18 Transaction Specific Investment Business Network Joint Action Trust Flexibility of Adjustments Growth rate γ=.70 t=4.73 γ=-.19 t=.31 γ=-.41 t=2.24 γ=.85 t=2.63 β=.15 t=.30 β=.80 t=2.35 β=.80 t=2.35 β=.30 t=1.72 β=.30 t=1.72 β=.76 t=1.25 β=.77 t=1.74 Profitability β=.32 t=.80 β=-.61 t=1.23
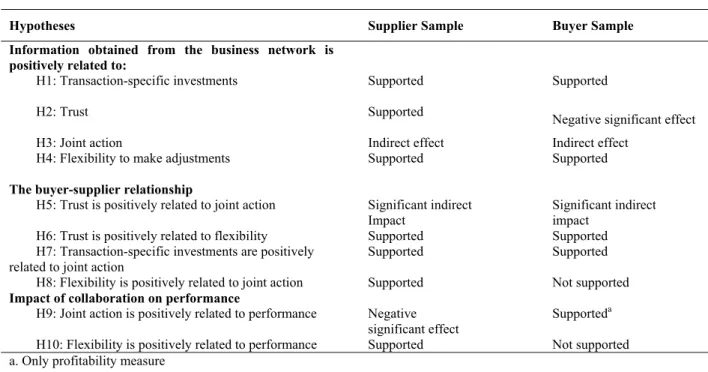
Table 1 provides an overview of the tests of the hypotheses. It clearly shows, that the information that firms obtain from the network affects the long-term buyer-supplier relationship. The network encourages firms to invest in assets specifically meant for transactions with a counterpart (H1). In the supplier sample, we found that the network fosters trust, whereas in the buyers’ sample the effect of network information on trust is negative, contrary to our hypothesis (H2), and what has been posited in previous research. Furthermore, as hypothesized, the network exerts an indirect positive effect on joint action and has a direct positive impact on flexibility (H3 and H4). Trust indirectly influences joint action and directly impacts flexibility in a positive way, as hypothesized (H5 and H6). As expected, transaction-specific investment offers coordination and further integration of activities and resources, which promotes joint problem solving and joint planning (i.e., joint action, H6). According to the argumentation of our hypothesis (H7) and previous research (Dyer & Singh, 1998), the joint action response also functions as a mechanism to safeguard a firm against opportunistic behavior, considering the vulnerable position of the investor firm. The effect of flexibility was supported in the supplier sample. In contrast, there was no significant effect of flexibility on joint action in the buyer sample (H8). In the supplier sample, there was a surprising negative effect of joint action on performance, while in the buyer sample, we found that joint action positively influences the profitability of the respondent firms (H9). Finally, for flexibility we found that it was negatively related in the supplier sample and positively related to performance in the buyer sample (H10).
Table 1: Summary of the Tests of the Hypotheses
Hypotheses Supplier Sample Buyer Sample
Information obtained from the business network is positively related to:
H1: Transaction-specific investments Supported Supported
H2: Trust Supported
Negative significant effect
H3: Joint action Indirect effect Indirect effect
H4: Flexibility to make adjustments Supported Supported
The buyer-supplier relationship
H5: Trust is positively related to joint action Significant indirect Impact
Significant indirect impact
H6: Trust is positively related to flexibility Supported Supported H7: Transaction-specific investments are positively
related to joint action
Supported Supported
H8: Flexibility is positively related to joint action Supported Not supported Impact of collaboration on performance
H9: Joint action is positively related to performance Negative significant effect
Supporteda
H10: Flexibility is positively related to performance Supported Not supported a. Only profitability measure
D
ISCUSSIONand enforcement of an agreement allows firms to move from market-based exchanges to collaborative relationships without additional transaction costs or loss of performance. A supplier or distributor accesses information that reduces the information asymmetry and allows for efficient collaboration. The lack of information precludes the ability of a firm to foresee the future actions of a counterpart. Therefore, this study provides empirical evidence to conclude that business network information enables trust, transaction specific investments and collaboration, and, ultimately, performance.
Although there are several similarities in our findings, buyers and suppliers clearly show different patterns in their approach to achieving performance. If we look at the positive signs in our equation models we can conclude that, whereas the most successful buyers tend to focus on the “hard”, tangible approach (business network information, via transaction specific investments and joint action to financial performance, see Figure 4), the most successful suppliers tend to focus on the “soft” elements – business network information to foster trust and via norms of flexibility to tangible (financial) and intangible (perceived satisfaction) performance (see Figure 5).
Figure 4: The Buyer’s Approach to Performance
High performing buyers use network information to foster transaction-specific investments. Buyers then engage in joint planning and joint problem solving to safeguard these investments. These large companies are clearly not interested in the day-to-day operation of the supplier. If buyers are active in assessing information from the network, it is primarily because they want to monitor the counterpart’s willingness to develop or adapt its offerings to their requirements. Literature on purchasing management emphasizes that few suppliers provide the items critical to the success of the buyer’s offerings. Failure in even one of these relationships can be critical to a firm’s operation. Considering the situation that buyers have not many alternatives to get the specific potted plants, buyers who follow the ‘hard’ approach are more likely to achieve success.
Conversely, Figure 5 shows the successful suppliers’ ‘soft’ approach. The network plays a central role here, because the suppliers use the information obtained in the network to build-up trust in the relationship with the much larger buyer company. In line with the framework of customer relationship management (Rigby, Reichheld, & Schefter, 2002), the successful suppliers are flexible to accommodate to the wishes of the buying counterpart. Suppliers that take these ‘soft’ elements into account are likely to be successful in a buyer-supplier relationship.
Figure 5:The Supplier’s Approach to Performance
Limitations and Suggestions for Further Research
The analysis presented in this paper should be evaluated in the light of some limitations, which lead to suggestions for further research. Firstly, for hypotheses-testing purposes, we decided to test our framework in a particular (and homogeneous) context: the Dutch potted plant and flower industry. Restricting the context served the dual purpose of controlling for extraneous sources of variation and developing grounded measures. Therefore, caution should be used in extrapolating our results to other contexts. Secondly, the network effects focused on the information that firms obtain from the business
Business network
Business
network Trust Trust FlexibilityFlexibility Performance Performance
Business network
Business
network Trust Trust FlexibilityFlexibility Performance Performance
Business network Business
network Performance Performance
Joint action Joint action Transaction specific
investment Transaction specific
investment Business
network Business
network Performance Performance
Joint action Joint action Transaction specific
investment Transaction specific
network. We encourage future research to further explore network effect in terms of gaining control and resources or finding opportunities. Thirdly, the issue of contracts or other formal documentation was not considered in the theoretical framework because the companies in our sample opt for private orders(1), we suggest that the role of contracts be considered in another business context (in terms of contract law, letter of intent or other form of document). Fourthly, our results regarding the different performance strategies of buyers and suppliers show that there is a perceived power balance when dealing in fixed line transactions. Future studies should carefully consider the concept of power balance and dependency when using our framework in other industries. Finally, our study used a cross-sectional design, thus preventing the investigation of the dynamic effects. However, proof of causal relationships requires a longitudinal research design, further work along this line is therefore encouraged.
M
ANAGERIALI
MPLICATIONSThe implications of our study are best viewed within the context of the trend toward close, long-term relationships. Quite often the social capital that is inherent to such close relationships is considered a desirable goal. We therefore started our article by asking ourselves: Is there any difference between the relationship strategy employed by suppliers and buyers? In other words: should purchasing managers concentrate on the social elements associated with the relationship or is it better for sales managers to concentrate on those elements?
Based on our results, we advise managers to be very cautious is finding the optimal balance between human, social and structural resources. The basic postulate in our work is that a firm may coordinate relationships with a counterpart by means of collaboration and, especially suppliers, by trust and the norm of flexibility; and especially buyers, by transaction-specific investments. However, this is not always desirable. In our focal industry, buyers and suppliers have looked for channels to reduce price and the unpredictability of volume and moreover to reduce bottlenecks in delivery. Successful buyer and supplier companies have clearly opted for different strategies in this situation. Whereas the ‘hard’ tangible approach provided the best results for buyers, it was the ‘soft’ intangible approach that turned out to be the best approach for the suppliers, depending on the differences in their business contexts. So, although we can point at a number of advantages for firms to set up close relationships with counterparts, building relationships and networks involves investment of time and resources that might outweigh the benefits. For instance, given the costs associated with the shift away from spot-market exchange (e.g., the auction clock), the investment costs to obtain the social capital included in a long-term buyer-supplier relationship, might be detrimental to performance. Managers may use these findings to check the adequacy of their business networks and their approach to relationship marketing. At the very least, our study should serve as a cautionary example about the conditions that evoke the need to craft and manage collaborative, long-term relationships and networks.
N
OTE1
After face-to-face interviews conducted before the quantitative phase, we found that rarely did suppliers and buyers of this Dutch Flower Sector enforce contracts. In order to control, we added in the questionnaire a question concerning the use of contracts. Only two suppliers of the 174 have legally enforced a contract over the past 5 years in a court of law. This confirmed that the studied relationship has a relational basis and opt for private order as suggested in Williamson (1996).
A
CKNOWLEDGEMENTSR
EFERENCEAnderson, J. C., & Gerbing, D. W. (1988, May). Structural equation modeling in practice: a review and recommended two-step approach. Psychological Bulletin,103(3), 411-423.
Anderson, J. C., & Narus, J. A. (1990, January). A model of distributor firm and manufacturer firm working partnerships. Journal of Marketing, 54(1), 42-58.
Anderson, J. C., Hakansson, H., & Johanson, J. (1994, October). Dyadic business relationship within a business network context. Journal of Marketing,58(4), 22-38.
Bensaou, M., & Venkatraman, N. (1995, September). Configurations of inter-organizational
relationships: a comparison between U.S. and Japanese automakers. Management Science,41(9), 1471-1492.
Blankenburg, D., Eriksson, K., & Johanson, J. (1999, May). Creating value through mutual
commitment to business network relationships. Strategic Management Journal, 20(5), 467-486.
Burt, R. S. (1997, June). The contingent value of the social capital. Administrative Science Quarterly, 42(2), 339-365.
Calantone, R. J., Graham, J. L., & Mintu-Wimsatt, A. (1998, February). Problem-solving approach in an international context: antecedents and outcome. International Journal of Research in Marketing, 15(1), 19-35.
Cannon, J. P., Achrol, R. S., & Gundlach, G. T. (2000, April). Contracts, norms, and plural form governance. Journal of the Academy of Marketing Science, 28(2), 180-194.
Claro, D. P. (2004). Manging business network and buyer-supplier relationship, Doctoral dissertation, Wageningen University, Wageningen, UR, Holland.
Deutsch, M. (1969, January). Conflicts: productive and destructive. Journal of Social Issues, 25(1), 7-41.
Doney, P. M., & Cannon, J. P. (1997, April). An examination of the nature of trust in buyer-seller relationships. Journal of Marketing, 61(2), 35-51.
Dyer, J. H., & Singh, H. (1998, April). The relational view: cooperative strategy and sources of interorganizational competitive advantage. Academy of Management Review, 23(4), 660-679.
Granovetter, M. (1985, May). Economic action and social structure: the problem of embeddedness. American Journal of Sociology, 91(3), 481-510.
Gulati, R. (1998, April). Alliances and networks. Strategic Management Journal, 19(4), p. 293-317.
Hair, J. F., Anderson, R., Tatham, R. L., & Black, W. C. (1998). Multivariate data analysis (5th ed.). Upper Saddle River: Prentice Hall.
Hakansson, H., & Snehota, I. (1995). Developing relationships in business network. New York: Routledge.
Heide, J. B., & Miner, A. S. (1992, February). The shadow of the future: effects of anticipated and frequency of contract on buyer-seller cooperation. Academy of Management Journal, 35(2), 265-291.
Heide, J. B. (1994, January). Interorganizational governance in marketing channels. Journal of Marketing, 58(1), 71-85.
Lusch, R. F., & Brown, J. R. (1996, October). Interdependency, contracting, and relational behavior in market channels. Journal of Marketing, 60(4), 19-38.
Macneil, I. R. (1978, November). Contracts: adjustment of long-term economic relations under classical, neoclassical, and relational contract law. Northwestern University Law Review, 76(6), 854-905.
Malhotra, N. K. (1999). Marketing research: an applied orientation (3rd ed.).Upper Saddle River: Prentice Hall.
Malhotra, N. K., Peterson, M., & Kleiser, S. B. (1999, April). Marketing research: a state-of-the-art review and directions for the twenty-first century. Journal of the Academy of Marketing Science, 27(2), 160-183.
Ministry of Agriculture, Nature and Food Quality. (2004). Facts and figures of the dutch agri-sector (Annual Report). The Hague, EK, The Netherlands: Department of Trade and Industry.
Mohr, J. J., & Speckman, R. (1994, February). Characteristics of partnership success: partnership attributes, communication behavior, and conflict resolution techniques. Strategic Management Journal, 15(2), 135-152.
Morgan, R. M., & Hunt, S. D. (1994, July). The commitment-trust theory of relationship marketing, Journal of Marketing, 58, 20-38.
Noordewier, T. G., John, G., & Nevin, J. R. (1990, October). Performance outcomes of purchasing arrangements in industrial buyer-vendor relationship. Journal of Marketing, 54(4), 80-94.
Omta, S. W. F., Trienekens, J. H., & Beers, G. (2001, January). Chain and network science: a research framework. Journal on Chain and Network Science, 1(1), 1-6.
Powell, W. W. (1990, January). Neither market nor hierarchy: network forms of organization. Research in Organizational Behavior, 12(1), 295-336.
Profound Advisers in Development. (2005). EU market survey 2004: cut flowers and foliage. (Report). União Europeia, Rotterdam, DA, The Netherlands: CBI.
Rigby, D. K., Reichheld, F. F., & Schefter, P. (2002, April). Fuja dos quatro riscos do CRM. Harvard Business Review (Edição Especial Revista Exame). 80(2), 101-110.
Thorelli, H. B. (1986, January). Networks: between markets and hierarchies. Strategic Management Journal, 7(1), 37-51.
Uzzi, B. (1996, August). The source and consequences of embeddedness for the economic performance of organizations: the network effect. American Sociological Review, 61(4), 674-698.
Zaheer, A., & Venkatraman, N. (1995, May). Relational governance as an interorganizational strategy: an empirical test of the role of trust in economic exchange. Strategic Management Journal, 16(5), 373-392.
Zaheer, A., Mcevily, B., & Perrone, V. (1998, February). Does trust matter? Exploring the effects of interorganizational and interpersonal trust on performance. Organization Science, 9(2), 141-159.
APPENDIX
A
-
T
HEF
LORELQ
UESTIONNAIREThis appendix reports the items used in the questionnaires for respondents from the buyer companies and the supplier companies (between brackets). Respondents were asked to select a regular counterpart via fixed-line channel, we report the type of scales used and the Cronbach’s alpha for the buyer and supplier companies.
Business Network (5 different subgroups with 5 information benefits; 7-point Likert scale, “not at all”–“very much”)
- First-tier suppliers network subgroup, supplier sample α = .89; buyer sample α = .97 We get information from first-tier suppliers, which supports us:
1. in defining prices of products for the selected buyer (supplier).
2. in defining quantities of products to sell to the selected buyer (supplier).
3. with the logistic operations of products that we sell to the selected buyer (supplier). 4. with the production process of the products that we sell to the selected buyer (supplier). 5. to foresee future actions of the selected buyer (supplier).
- Other suppliers network subgroup, supplier sample α = .81; buyer sample α = .93 We get information from other suppliers, which supports us:
6. in defining prices of products for the selected buyer (supplier).
7. in defining quantities of products to sell to the selected buyer (supplier).
8. with the logistic operations of products that we sell to the selected buyer (supplier). 9. with the production process of the products that we sell to the selected buyer (supplier). 10. to foresee future actions of the selected buyer (supplier).
- Other buyers network subgroup, supplier sample α = .84; buyer sample α = .93 We get information from other buyers, which supports us:
11. in defining prices of products for the selected buyer (supplier).
12. in defining quantities of products to sell to the selected buyer (supplier).
13. with the logistic operations of products that we sell to the selected buyer (supplier). 14. with the production process of the products that we sell to the selected buyer (supplier). 15. to foresee future actions of the selected buyer (supplier).
- Buyer’s customers network subgroup, supplier sample α = .95; buyer sample α = .92 We get information from buyer’s customers, which supports us:
16. in defining prices of products for the selected buyer (supplier).
17. in defining quantities of products to sell to the selected buyer (supplier).
18. with the logistic operations of products that we sell to the selected buyer (supplier). 19. with the production process of the products that we sell to the selected buyer (supplier). 20. to foresee future actions of the selected buyer (supplier).
- Auction agents network subgroup, supplier sample α = .91; buyer sample α = .92 We get information from agents of the cooperative, which supports us:
21. in defining prices of products for the selected buyer (supplier).
22. in defining quantities of products to sell to the selected buyer (supplier).
23. with the logistic operations of products that we sell to the selected buyer (supplier). 24. with the production process of the products that we sell to the selected buyer (supplier). 25. to foresee future actions of the selected buyer (supplier).
Physical transaction specificity (7-point Likert scale, “not true at all”–“totally true”) supplier sample α = .79; buyer sample α = .80
1.In our company, we have made significant investments to deliver products to the selected buyer (supplier).
2.We have made significant investments to handle internally the products that are ordered by the selected buyer (supplier)
supplier sample α = .68; buyer sample α = .83
1.We have invested time and efforts to learn about the business practices of the selected buyer (supplier).
2.If we switch to another buyer (supplier) we would lose a lot of investments that we have made to sell to the selected buyer (supplier).
3.If we decided to stop working with this buyer (supplier), we would be wasting a lot of knowledge regarding the buyer (supplier)’s method of operation.
Interpersonal trust (7-point Likert scale, “not true at all”–“totally true”) supplier sample α = .75; buyer sample α = .79
1. Our company’s contact person (purchasing agent) has always been evenhanded in negotiations with us. 2. In our company, we have faith in the contact person to look out for our interests even when it is costly to
do so.
3. Our company’s contact person is trustworthy.
4. In our company, we have faith in the contact person to look out for our interests even when it is costly to do so.
5. In our company, we would feel a sense of betrayal if the contact person’s performance would be below my expectations. (dropped after validation procedure)
Inter-organizational trust (7-point Likert scale, “not true at all”–“totally true”) supplier sample α = .83; buyer sample α = .78
1.We expect this buyer (supplier) to be working with us for a long time.
2.The selected buyer (supplier) has always been evenhanded in his negotiations with us.
3.The selected buyer (supplier) may use opportunities that arise to profit at our expense. (Reversed scale) (item dropped)
4.Based on experience, we can with complete confidence rely on the selected buyer (supplier) to keep promises made to us.
5.We are hesitant to transact with the selected buyer (supplier) when the order specifications are vague. (Reversed scale) (item dropped)
6.The selected buyer (supplier) is trustworthy.
Joint action (7-point Likert scale, “not at all”–“very much”)
- Joint planning, supplier sample α = .70; buyer sample α = .85
1.Our company plans volume demands for the next seasons together with this buyer (supplier).
2.Our company plans the new products and varieties demands for the next seasons together with this buyer (supplier).
3.This buyer (supplier) provides us with sale forecasts for the products our company sells to them. 4.Our company shares long-term plans of our products with this buyer (supplier).
- Joint problem solving, supplier sample α = .87; buyer sample α = .89
1.This buyer (supplier) and our company deal with problems that arise in the course of the relationship together.
2.This buyer (supplier) and our company do not mind owing each other favors.
3.In most aspects of the relationship with this buyer (supplier), the responsibility for getting things done is shared.
4.This buyer (supplier) and our company are committed to improvements that may benefit the relationship as a whole.
Flexibility to make adjustments (7-point Likert scale, “not at all”–“very much”) supplier sample α = .60; buyer sample α = .70
1.Our company is flexible in response to changes in the relationship with this buyer (supplier). 2.This buyer (supplier) makes adjustments to maintain the relationship with our company.
3.When some unexpected situation arises, this buyer (supplier) and our company work out a new deal.
Performance
- Perceived satisfaction (7-point Likert scale, “very unsatisfied”–“very satisfied”) supplier sample α = .86; buyer sample α = .91
Indicate how satisfied you are with the following aspects of the relationship with the selected buyer(supplier) over the last 12 months:
1. The order frequency over the year. (Continuous supply over the year). 2. Quantities of products per order. (Offered assortment of products). 3. Communication quality with people of the selected buyer (supplier).
5. Quality of their purchasing department. (Quality of this supplier’s products.) 6. The way in which problems are solved
- Growth rate (single item)
1. What was the development of your total sales volume over the last three years? - Profitability (single item; 7-point Likert scale, “not at all achieved”–“totally achieved”) 1. To what extent did you achieve the expected profitability with your pot plant business?