Availability of added sugars in
Brazil: distribution, food sources
and time trends
Disponibilidade de “açúcares de
adição” no Brasil: distribuição, fontes
alimentares e tendência temporal
Renata Bertazzi Levy
I,IIRafael Moreira Claro
IIDaniel Henrique Bandoni
II,IIILenise Mondini
IVCarlos Augusto Monteiro
II,VI Departamento de Medicina Preventiva da Faculdade de Medicina da Universidade de São Paulo (USP).
II Núcleo de Pesquisas Epidemiológicas em Nutrição e Saúde da Universidade de São Paulo (NUPENS/USP).
III Departamento de Saúde, Clínica e Instituições, Instituto de Saúde e Sociedade da UNIFESP.
IV Instituto de Economia Agrícola da Secretaria da Agricultura e Abastecimento do Estado de São Paulo.
V Departamento de Nutrição da Faculdade de Saúde Pública da Universidade de São Paulo (USP).
Correspondência: Renata Bertazzi Levy. Departamento de Medicina Preventiva. Faculdade de Medicina da Universidade de São Paulo – USP. Av. Dr. Arnaldo, 455 1º andar, São Paulo, SP CEP 01246-903. E-mail: [email protected]
Abstract
Objective: To describe the regional and socio-economic distribution of consump-tion of added sugar in Brazil in 2002/03, particularly products, sources of sugar and
trends in the past 15 years. Methods: The
study used data from Household Budget Surveys since the 1980s about the type and quantity of food and beverages bought by Brazilian families. Different indicators were analyzed: % of sugar calories over the total diet energy and caloric % of table sugar frac-tions and sugar added to processed food/
sugar calories of diet. Results: In 2002/03, of
the total energy available for consumption, 16.7% came from added sugar in all regional and socio-economic strata. The table sugar/ sugar added to processed food ratio was in-versely proportional to increase in income. Although this proportion fell in the past 15 years, sugar added to processed food dou-bled, especially in terms of consumption
of soft drinks and cookies. Conclusions:
Brazilians consume more sugar than the recommended levels determined by the WHO and the sources of consumption of sugar have changed significantly.
Resumo
Objetivos: Estimar o consumo de “açúcar de adição” pela população brasileira, nos estratos regionais e socioeconômicos, des-tacando suas principais fontes alimentares e verificar a tendência do seu consumo nas
últimas décadas. Métodos: Contou-se com
informações das Pesquisas de Orçamentos Familiares a partir da década de 80 sobre o tipo e a quantidade de alimentos e bebidas adquiridos pelas famílias brasileiras. Os indicadores analisados foram: % das calo-rias de açúcar no total calórico da dieta e % calórico das frações de açúcar de mesa e de açúcar adicionado aos alimentos pela
indústria/kcal açúcar da dieta. Resultados:
Em 2002/03, 16,7% das calorias totais eram provenientes de “açúcar de adição” e sua participação mostrou-se elevada em todos os estratos regionais e de renda. A razão açúcar de mesa/açúcar adicionado pela indústria se inverte com o aumento da renda. A participação do açúcar de mesa nos últimos 15 anos foi reduzida, enquanto a contribuição do açúcar adicionado aos alimentos dobrou, especialmente por meio do consumo de refrigerantes e biscoitos.
Conclusões: O consumo de açúcar no Brasil excede largamente a recomendação da OMS e verificou-se importante alteração nas fon-tes de consumo.
Palavras-chave: Açúcar. Açúcar adiciona-do. Indústria do açúcar. Brasil. Pesquisa de Orçamentos Familiares.
Introduction
The chemical definition of “sugars” refers to a group of compounds comprised of carbon, hydrogen and oxygen atoms, subdivided into monosaccharaides – such as glucose, fructose and galactose – and di-saccharides – such as sucrose (glucose and fructose) and lactose (glucose and
galacto-se)1. From the point of view of their effect on
health, two types of sugar should be empha-sized: those naturally found in foods, such as fructose and sucrose present in fruits and lactose present in milk; and those extracted from foods (sugarcane, beetroots and corn) for subsequent consumption in culinary preparations or in the manufacturing of processed foods. The latter group of sugars
is known as added sugars2. The present
stu-dy will use the term “added sugars”. While there are no evidences of health damages caused by the consumption of sugars naturally found in foods, there is growing evidence that the presence of added sugars in the diet is associated with the increase in the risk of several diseases, such as dental caries, obesity and other non-communicable chronic diseases. For this reason, the World Health Organization has established that the consumption of added sugars should not be higher than 10% of the total number of calories of the diet. There are several mechanisms that link the consumption of added sugars to health problems, including the erosion of dental enamel by acids resulting from bacterial
me-tabolism of sugars1,3; the impairment of the
self-regulatory system of energetic balance (hunger/satiation), determined by either the increase in energy density of the diet or the energy consumption through
sugar--sweetened beverages1,4-8; and the increase
in triglyceride concentration and decrease in high-density lipoprotein
concentra-tion9,10. In addition, the high consumption
of added sugars could be associated with a reduction in the protein and micro-nutrient
contents in the diet11-13.
the population, particularly in developing countries. The present study aimed to esti-mate the consumption of added sugars in Brazil, to describe their main sources in the diet and their regional and socioeconomic distribution, and to establish their evolution in recent decades.
Methods
The data used in this study derived from the Household Budget Surveys (HBS) conducted by the Instituto Brasileiro de Geografia e Estatística (IBGE – Brazilian Institute of Geography and Statistics) in the following periods: between March 1987 and February 1988, between October 1995 and September 1996, and between June 2002 and July 2003. The last survey included a probabilistic sample of the en-tire country, when 48,470 households were studied (of which 13,848 were situated in
metropolitan areas). In previous surveys,
the probabilistic samples referred to the group of households from the metropolitan areas of Brazil (Belém, Fortaleza, Recife, Salvador, Belo Horizonte, Rio de Janeiro, São Paulo, Curitiba, Porto Alegre, Goiânia and Brasília), with 13,611 households studied in 1987/88 and 16,014 in 1995/96. The com-plex sample procedures used in the surveys have been thoroughly described in specific
publications14-16.
The information about foods purchased by each household was obtained with the research collective spending booklet. In this booklet, all foods purchased during a period of seven consecutive days were recorded, in-cluding the amount, cooking measures with their equivalent metric measures in weight or volume, amount spent, place of purchase, and the way foods were obtained (through monetary or non-monetary means).
Researchers chose to adopt groups of households as unit of study, considering that the adequate characterization of the food purchase pattern in each household
studied could be compromised by the re-duced number of days (a period of seven days) used to collect information about foods purchased by each household. Homogeneous households, according to their socioeconomic level and geographic location, were grouped into 443 strata (defined in the original sampling plan of the study) and used to describe the sugar consumption pattern in 2002/03. The mean number of households studied in each of the 443 strata of the 2002/03 HBS was 109.6 (varying between 9 and 804).
Information from the “Sistema IBGE de Recuperação Automática (SIDRA – IBGE Automatic Retrieval System)* had to be used to perform the analyses of sugar consumption trend in metropolitan areas, because the quantity (in grams) of each product purchased in each household were not available in the 1987/88 and 1995/96 surveys. The SIDRA provides detailed information about the purchase of foods and beverages, according to groups of households corresponding to ten intervals of income in each of the 11 areas surveyed, adding to 110 groups of households (units of study) in each one of the three periods studied (1987/88, 1995/96, 2002/03). The mean number of households surveyed in each of the 110 units originated from the samples of metropolitan areas was 123 in 1987/88 (varying between 45 and 351), 146 in 1995/96 (varying between 47 and 474) and 65.7 in 2002/03 (varying between 15 and 228). The weighting factor of each unit of study always resulted from the sum of sample weighting factors of households included in each unit in each survey.
Data analysis
The following indicators were construc-ted in the present study: percentage contri-bution of added sugars to the total amount of calories purchased; and the fraction of total sugar from “refined sugars and other
caloric sweeteners” and “sugars added to processed foods by industries”.
First, the inedible fraction of the total amount in grams of each food obtained by households was excluded, when ne-cessary, by applying correction factors recommended by the IBGE.** The quantity ofeach food was subsequently converted into calories using the Tabela Brasileira de Composição de Alimentos (TACO – Brazilian Food Composition Table), version 1***, or the official US Food Composition Table,
version 15****, when a certain food was not
available in the Brazilian table. Daily per capita energy availability was obtained by converting weekly records of purchase of foods of each unit of study into calories, adding up the total number of records and dividing the result by the sum of individuals in each unit of study. In the specific case of conversion of calories from added sugars, the calculation involved the following two steps: conversion of amounts (in grams) into calories from carbohydrates (using the TACO table whenever possible); and conver-sion of calories from carbohydrates into the corresponding calories from added sugars (using the American table, as the Brazilian table does not include details about the types of carbohydrates of each food).
Both “refined sugar and other caloric sweeteners” and “sugar added to proces-sed foods by industry” were considered to calculate the calories from added sugars. Other caloric sweeteners included rapadu-ra (a type of candy made from sugarcane juice), molasses, honey, corn syrup and fructose. The remaining sugars naturally found in foods, such as fructose in fruits and lactose in milk, were considered as part of the remaining calories not coming from added sugars.
Based on the 2002/03 HBS, the mean daily per capita availability of “added
sugars” (and respective confidence inter-vals) was estimated for the entire country and for the five Brazilian regions, divided into urban and rural areas, in addition to quintiles of per capita income distribution. The percentage distribution of foods selected in the total household availability of “added sugars” was described for the coun-try and according to quintiles of per capita income distribution. For this purpose, the foods purchased by families were divided into two source groups: 1) “refined sugar (sucrose) and other caloric sweeteners” and 2) “sugar added to foods processed by industry”.
The time trend analysis of “added su-gars” consumption indicators was only performed for the households surveyed by the HBSs in metropolitan areas of Brazil, in 1986/87, 1995/96 and 2002/03.
All analytical procedures of this study were conducted with STATA, version 9.2, considering the sample design of the HBSs.
Ethical aspects
Authors declared there were no conflicts of interest, whether real, potential or appa-rent. In addition, the present study used secondary data collected from the IBGE, available for public online consultation. Thus, it was not necessary to submit it to any research ethics committees, according to a resolution of the Comissão Nacional de Ética em Pesquisa (CONEP – National Research Ethics Committee).
Results
The contribution of added sugars to household food availability in Brazil rea-ched 16.7% of total calories, higher than the maximum limit of 10% recommended by the WHO. Except for the Northern region,
*[IBGE]. Instituto Brasileiro de Geograia e Estatística (Brazilian Institute of Geography and Statistics). Estudo Nacional da Despesa Fami-liar 1974/75 (ENDEF – National Study on Household Spending). Rio de Janeiro: IBGE; 1978.
***[NEPA/UNICAMP]. Núcleo de Estudos e Pesquisas em Alimentação/ Universidade Estadual de Campinas (UNICAMP – Center for
Stu-dies and Research on Diet). Tabela Brasileira de Composição de Alimentos (TACO – Brazilian Food Composition Table): Version 1. Campi-nas, São Paulo: NEPA/UNICAMP; 2004.
where added sugars corresponded to 13% of the total number of calories, the percentage of calories from added sugars was between 16.3% and 18.1% in all regions. There were no substantial differences between urban and rural households (Table 1).
The percentage of calories from added sugars was high (always above 15%) in all income groups and no linear relationship between the contribution of added sugars and household income level was found (Table 2).
In the set of Brazilian households, three quarters of calories from added sugars come from “refined sugars and other caloric swe-eteners” (with a very small proportion of other caloric sweeteners – less than 0.6% of the total number of calories). The remaining quarter of calories from added sugars come from processed foods, especially sodas, can-dies, toffees, chocolate and cookies (Table 3). The proportion of added sugars coming from processed foods increased with the household income, becoming similar to
Table 1 - Availability of total energy and energy from added sugars in Brazilian households by region and urban or rural
status (2002/03).
Tabela 1 - Disponibilidade calórica total e proveniente de “açúcares de adição” nos domicílios brasileiros segundo região e situação urbana ou rural (2002/03).
Region/ household status
Availability total (Kcal/p*/day)
Availability of added sugars (kcal/p/day)
% contribution of added sugars to the total energy value (% kcal sugar/ total kcal)
Mean 95%CI Mean 95%CI Mean 95%CI
North
Urban 1,693.0 1,572.6 1,813.4 208.5 191.1 225.9 13.3 12.4 11.1
Rural 2,488.1 2,327.3 2,649.0 283.7 236.2 331.3 13.6 11.5 9.5
Total 1,882.8 1,735.3 2,030.3 226.4 205.6 247.2 13.0 12.2 11.3
Northeast
Urban 1,658.1 1,604.5 1,711.7 260.4 246.4 274.5 16.4 15.7 15.1
Rural 2,034.0 1,931.0 2,136.9 320.2 297.4 343.1 17.0 15.9 14.8
Total 1,757.0 1,696.2 1,817.8 276.2 263.1 289.2 16.3 15.8 15.2
Southeast
Urban 1,708.0 1,585.9 1,830.1 297.0 263.2 330.9 18.1 17.1 16.1
Rural 2,550.3 1,934.3 3,166.2 437.2 349.5 525.0 19.4 17.6 15.9
Total 1,775.6 1,651.0 1,900.2 308.3 276.9 339.7 18.1 17.1 16.2
South
Urban 1,795.7 1,666.1 1,925.3 281.3 261.1 301.5 16.5 15.7 14.9
Rural 2,888.1 2,417.9 3,358.3 434.9 361.6 508.2 16.9 15.4 13.8
Total 1,973.6 1,796.9 2,150.2 306.3 278.7 333.9 16.3 15.6 14.9
Center-West
Urban 1,607.9 1,514.6 1,707.3 257.0 244.2 269.8 16.9 16.1 15.3
Rural 2,521.3 2,251.8 2,790.8 394.6 323.5 465.8 17.3 15.4 13.5
Total 1,714.9 1,596.7 1,833.1 273.1 253.9 292.4 16.7 16.0 15.3
Brazil
Urban 1,702.6 1,637.2 1,767.9 278.4 259.6 297.2 16.8 16.2 15.6
Rural 2,375.5 2,171.7 2,579.2 368.0 335.2 400.8 16.5 15.8 15.0
Total 1,805.2 1,739.1 1,871.2 292.0 275.9 308.2 16.7 16.2 15.6
the proportion coming from “refined sugars and other caloric sweeteners” in the highest quintile of income (42.1% and 57.9%, res-pectively) (Table 3).
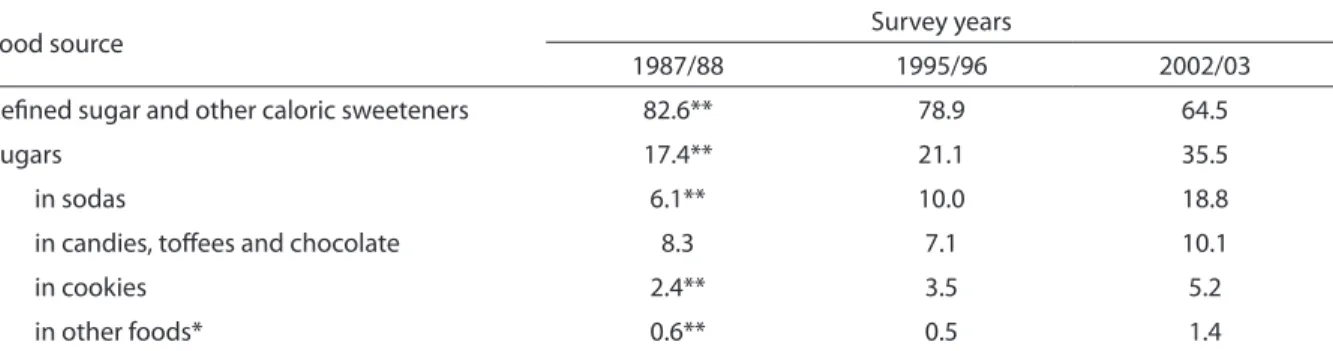
The evolution of contribution of added sugars to household food availability in Brazil can only be studied in metropolitan areas. The HBSs conducted in these areas in 1987/88, 1995/96 and 2002/03 show the stability of contribution of added sugars to total calories: 15.9%, 16.1% and 16.3%, respectively (p-value for trend of 0.407). However, the proportion of added sugars from processed foods significantly increases throughout the three surveys, doubling be-tween 1987/88 and 2002/03 (from 17.4% to 35.5%). During this period, the contribution of sodas to total added sugars increased
200% (from 6.1% to 18.8%) and the con-tribution of cookies increased 100% (from 2.3% to 5.2%). The contribution of candies, toffees and chocolate also increased during this period, although without statistical significance.
Discussion
The results of the present study revealed an excessive consumption of added sugars in Brazilian households, higher than 60% of the maximum limit of consumption recommended by the WHO. This situation was observed in all Brazilian regions, in both urban and rural e areas and in all income groups. In metropolitan areas, the contri-bution of added sugars to the total number
Table 2 -Availability of total energy and energy from added sugars in Brazilian households by ifths of per capita income
(2002/03).
Tabela 2 - Disponibilidade calórica total e proveniente de “açúcares de adição” nos domicílios brasileiros segundo quintos de renda per capita (2002/03).
Quintiles of income
“Added sugar” (kcal/p*/day)
“Added sugar” (% kcal sugar/ total kcal)
Calories (Kcal/p/day)
Mean 95%CI Mean 95%CI Mean 95%CI
1st 282.3 264.7 299.9 15.4 14.6 16.2 1,856.0 1,754.9 1,957.0
2nd 305.7 270.0 341.8 16.1 15.1 17.1 1,.899.9 1,731.8 2,068.0
3rd 330.5 282.6 378.5 17.6 15.8 19.3 1,865.8 1,687.2 2,044.4
4th 266.3 233.7 298.8 15.8 15.1 16.5 1,676.8 1,499.4 1,854.2
5th 276.6 256.9 296.3 15.9 15.2 16.6 1,725.9 1,637.3 1,814.6
Table 3 - Distribution (%) of the availability of energy from added sugars in households, by ifths of per capita income,
according to food source (2002/03).
Tabela 3 - Distribuição (%) da disponibilidade de calorias oriundas de “açúcares de adição” nos domicílios brasileiros, por quintos de renda per capita, segundo alimentos fonte (2002/03).
Food sources of sugar Brazil Quintiles of income
1st 2nd 3rd 4th 5th
Reined sugar and other caloric sweeteners 75.0 88.4** 82.6 78.4 67.5 57.9
Sugars 25.0 11.6** 17.4 21.6 32.5 42.1
in sodas 11.0 4.4** 7.8 9.6 15.3 18.0
in candies, tofees and chocolate 8.4 3.1** 5.4 7.0 11.1 15.4
in cookies 4.2 3.5** 3.4 4.0 4.4 5.5
in other foods* 1.5 0.6** 0.8 1.0 1.8 3.3
* sweetened breakfast cereals, milk beverages, teas and natural fruit juices. / * cereais matinais, bebidas lácteas, chás e sucos de frutas naturais adoçados
of calories of household food availability in Brazil remained practically stable between 1987/88 and 2002/03, although there was a substantial increase in the proportion of sugar calories from processed foods.
Evidence points to an increase in con-sumption of added sugars in recent decades, both in developed and certain developing countries, partly due to the changes in stan-dard of living resulting from urbanization and increase in income. Between 1962 and 2000, the daily per capita consumption of added sugars increased by approximately 74 g17.
Considering exclusively the period analyzed in this study, between 1987 and 2003, data from Food Balance Sheets compiled by the United Nations Food and Agriculture Organization – FBS/FAO, which express the mean quantity of food available for human consumption in each country – indicate that the participation of added sugar on total calories available in developed countries varied slightly, from 16.5% to 17.1% in the United States and from 10.9% to 11 3% in the European Union countries. However, larger changer were seen in developing countries, such as Central America and the Caribbean coun-tries and Brazil, where the intake, during the same period, changed from 15.1% to 18.1% and from 13.2% to 17.6% of total calories, respectively18.
The small variation in sugar consump-tion observed in developed countries could be associated with the saturation of the mar-ket, dissemination of information linking diseases to an excessive consumption of sugars and reduced variation in the price
of demand in these countries19. In 2005/06,
FAO data indicated that the availability of sugar in developed countries was approxi-mately half of that observed in developing
countries18.
The present study identified important changes in the contribution of the several dietary sources of added sugars to its total intake throughout time, The ratio between the contribution of table sugar and in-dustrially added sugar suffered a massive reduction (4.7 against 1.8 times). Thus, the proportion of sugar from sodas, candies, toffees, chocolate and cookies, which re-presented approximately 17% of the total dietary sugar in the end of the 1980s, dou-bled (35%) in 2002/03.
Although the literature includes no information that permits researchers to compare changes in the contribution of sugar added to processed foods, product by product, throughout the decades, the situa-tion found in Brazil appears to be similar to that of countries such as the United States, despite table sugar being the main source of sugar consumption. In the United States, the contribution of other types of sugar
Table 4 -Distribution (%) of the availability of energy from added sugars according to food source. Metropolitan areas of
Brazil (1987-2003).
Tabela 4 - Distribuição (%) da disponibilidade de calorias oriundas de “açúcares de adição”, segundo alimentos fontes. Áreas metropolitanas do Brasil (1987-2003).
Food source Survey years
1987/88 1995/96 2002/03
Reined sugar and other caloric sweeteners 82.6** 78.9 64.5
Sugars 17.4** 21.1 35.5
in sodas 6.1** 10.0 18.8
in candies, tofees and chocolate 8.3 7.1 10.1
in cookies 2.4** 3.5 5.2
in other foods* 0.6** 0.5 1.4
* sweetened breakfast cereals, milk beverages, teas and natural fruit juices / * cereais matinais, bebidas lácteas, chás e sucos de frutas naturais adoçados
specifically used in the manufacturing of processed foods has substantially grown in 35 years, to the detriment of refined sugar20,21.
In Brazil, the greater contribution of processed foods to the increase in income level (varying between 11.6% and 42.2% between the lowest and highest quintiles of income distribution) could be an indication of changes in sources of sugar consumption, as there was a mean increase of 28.2% in the mean income of Brazilians between 2003 and 200822,23.
In fact, the substantial increase in con-sumption of sodas should be emphasized, as this high consumption is associated with a lower quality of diet and higher risks of de-velopment of non-communicable chronic
diseases, such as type 2 diabetes24-27.
In addition, evidence suggests that calo-ries consumed through liquids have a lower level of satiation when compared to those
consumed through solid foods28,29, resulting
in an imbalance in organic self-regulatory mechanisms of food consumption and, consequently, excessive weight gain.
Although the increase in the contri-bution of manufactured foods to sugar consumption has not led to an increase in total dietary sugar, there is evidence asso-ciating the consumption of sugar from such source with greater contribution of fats and saturated fatty acids and lower contribution of carbohydrates other than sugar to the diet, whereas no association was found for table sugar30.
The results of the present study only refer to the purchase of foods and beverages for domestic consumption. In Brazil, foods and beverages purchased for domestic consumption represented approximately 78% of total spending on food by families
in 2002/0331. Assuming that the price per
calorie of foods purchased for consumption out of the home is equal to or higher than the price of foods purchased for domestic consumption, the results of the present stu-dy could be applied to at least ¾ of the total number of foods purchased. In addition, the
possible effect of food consumption out of the home was reduced, showing estimates of sugar availability adjusted for the total number of calories purchased (percentage of contribution of calories from sugar to the total caloric value of the diet).
The short period of reference (one week) to collect data on the purchases of foods made for each household in the HBSs could equally be an important limitation to this study. Aiming to minimize this effect, rese-archers adopted groups of homogeneous households, according to their location and socioeconomic characteristics, as unit of analysis and studied them during a period of 12 months.
Despite these limitations, studies com-paring data from household budget sur-veys with those obtained from individual consumption questionnaires point to a substantial level of agreement between
methods32,33. In the specific case of sugar
consumption, a study conducted in four European countries estimated the correla-tion coefficient between sugar consumpcorrela-tion measured by household budget surveys and that measured by individual consumption
questionnaire to be 0.7432. Finally, data on
household availability of sugars are some-times considered to be a good approxima-tion of consumpapproxima-tion of such nutrient, as Household Budget Surveys can accurately reflect individuals’ actual consumption in the case of foods used as ingredients in preparations, probably due to their difficulty in reporting the amount of foods consumed as part of a preparation in traditional food
consumption questionnaires30.
References
1. Food and Agriculture Organization/World Health
Organization. Carbohydrates in Human Nutrition.
Geneva; 1998. (Report of a Joint FAO/WHO Expert
Consultation).
2. Institute of Medicine. Dietary reference intakes for
energy, carbohydrate, fiber, fat, fatty acids, cholesterol, protein, and amino acids. Washington: National Academy Press; 2002.
3. Touger-Decker R, Touger CL. Sugars and dental caries.
Am J Clin Nutr 2003; 78: 881S-2.
4. Stubbs J, Ferres S, Horgan G. Energy density of foods:
effects on energy intake. Crit Rev Food Sci Nutr 2000; 40:
481-515.
5. DiMeglio DP, Mattes RD. Liquid versus solid
carbohydrate: effects on food intake and body weight.
Int J Obes Relat Metab Disord 2000; 24: 794–800
6. Ludwig DS, Peterson KE, Gortmaker SL. Relation between consumption of sugar-sweetened drinks and childhood obesity: a prospective, observational analysis.
Lancet 2001; 357: 505-8.
7. Anderson GH, Woodend D. Effect of glycemic carbohydrates on short-term satiety and food intake.
Nutr Rev 2003; 61: S17-26.
8. Van Wymelbeke V, Thérond MEB, La Guéronnière V, Fantino M. Influence of repeated consumption of beverages containing sucrose or intense sweeteners on
food intake. Eur J Clin Nutr 2004; 58: 154–61.
9. Fried SK, Rao SP. Sugars, hypertriglyceridemia, and
cardiovascular disease. Am J Clin Nutr 2003; 78: 873S-80.
10. Kelly SAM, Moynihan PJ, Rugg-Gunn AJ, Summerbell CD. Review of methods used to estimate non-milk
extrinsic sugars. J Hum Nutr Diet 2003; 16: 27–38.
11. Farris RP, Nicklas TA, Myers L, Berenson GS. nutrient intake and food group consumption of 10-year-olds by
sugar intake level: the Bogalusa heart study. J Am College
Nutr 1998; 17: 579-85.
12. Kranz S, Smiciklas-Wright H, Siega-Riz AM, Mitchell D. Adverse effect of high added sugar consumption on
dietary intake in American preschoolers. J Pediatr 2005;
146: 105-11.
13. Alexy U., Sichert-Hellert W, Kersting M. Fortification masks nutrient dilution due to added sugars in the diet
of children and adolescents. J Nutr 2002; 132: 2785-91.
14. Instituto Brasileiro de Geografia e Estatística.
Pesquisa de orçamentos familiares, 1987/88: regiões metropolitanas. Rio de Janeiro: IBGE; 1991.
15. Instituto Brasileiro de Geografia e Estatística. Pesquisa
dos orçamentos familiares 1995-1996: primeiros resultados. Rio de Janeiro: IBGE; 1997.
16. Instituto Brasileiro de Geografia e Estatística. Pesquisa
de Orçamentos Familiares 2002-2003: análise da disponibilidade domiciliar de alimentos e do estado nutricional no Brasil. Rio de Janeiro: IBGE; 2004.
17. Popkin BM, Nielsen SJ. The sweetening of the world’s
diet. Obes Res 2003; 11: 1325-32.
18. Food and Agriculture Organization Statistics Database. FAO Statistics database. Rome: Food and Agriculture Organization. Disponível em http://faostat.fao.org/ faostat/collections? version=ext&hasbulk=0 [Acessado em dezembro de 2010]
19. Food and Agriculture Organization. Food outlook –
global market analysis. June, 2007. p. 22-24.
20. Beghin, JC, Jensen HH. Farm policies and added sugars
in US diets. Food Policy 2008; 33: 480-8.
21. Wellss HF, Buzby JC. Dietary assessment of major
trends in U.S. food consumption, 1970-2005. Economic
information Bulletin 2008; 33: 17-18.
22. Instituto de Pesquisa Econômica Aplicada. IPEA DATA. Rio de Janeiro: Instituto de Pesquisa Econômica Aplicada. Disponível em http://www.ipeadata.gov.br/ [Acessado em novembro de 2010]
23. Neri MC, coordenador. Miséria, desigualdade e políticas
de renda: o Real do Lula. Rio de Janeiro: FGV/IBRE/CPS; 2007.
24. Schulze MB, Manson JE, Ludwig DS. Sugar-sweetened beverages, weight gain, and incidence of type 2 diabetes
in young and middle-aged women. JAMA 2004; 292:
927-34.
25. Vartanian LR, Schwartz MB, Brownell KD. Effects of soft drink consumption on nutrition and health: a
systematic review and meta-analysis. Am J Public Health
2007; 97: 667-75.
26. Lim S, Zoellner JM, Lee JM, Burt BA, Sandretto AM, Sohn W et al. Obesity and sugar-sweetened beverages in African-American preschool children: a longitudinal
study. Obesity 2009; 17: 1262–8.
27. Mueller NT, Odegaard A, Anderson K, Yuan JM, Gross M, Koh WP, Pereira M. Soft drink and juice consumption and risk of pancreatic cancer: The Singapore Chinese
Health Study. Cancer Epidemiol Biomarkers Prev 2010;
19: 447-55.
28. Mourao DM, Bressan J, Campbell WW, Mattes RD. Effects of food form on appetite and energy intake
in lean and obese young adults. Int J Obes 2007; 31:
1688–95.
29. Tournier A, Louis-Sylvestre J. Effect of the physical state of a food on subsequent intake in human subjects.
30. Levy RB, Claro RM e Monteiro CA. Aquisição de açúcar e perfil de macronutrientes na cesta de alimentos
adquirida pelas famílias brasileiras (2002-2003). Cad
Saúde Pública 2010; 26: 472-80.
31. Claro RM, Levy RB, Bandoni DH. Influência da renda sobre as despesas com alimentação fora do domicílio,
no Brasil, 2002-2003. Cad Saúde Pública 2009; 25:
2489-96.
32. Naska A, Vasdekis VGS & Trichopoulou A (2001) A preliminary assessment of the use of household budget survey data for the prediction of individual food
consumption. Public Health Nutr 2001; 4(5B): 1159-65.
33. Becker W (2001) Comparability of household and individual food consumption data – evidence from
Sweden. Public Health Nutr 2001; 4(5B): 1177-82.