Contributions from the systematic review of
economic evaluations: the case of childhood
hepatitis A vaccination in Brazil
Contribuições da revisão sistemática de avaliações
econômicas: o exemplo da vacinação infantil
contra hepatite A no Brasil
1 Faculdade de Medicina, Universidade de São Paulo, São Paulo, Brasil. 2 Hospital das Clínicas da Faculdade de Medicina, Universidade de São Paulo, São Paulo, Brasil. 3 London School of Hygiene and Tropical Medicine, London, U.K. 4 Instituto de Patologia Tropical e Saúde Pública, Universidade Federal de Goiás, Goiânia, Brasil. 5 Programa de Pós-graduação em Medicina Tropical, Universidade Federal de Pernambuco, Recife, Brasil.
Correspondence P. C. De Soárez
Departamento de Medicina Preventiva, Faculdade de Medicina, Universidade de São Paulo.
Av. Dr. Arnaldo 455, 2o andar, São Paulo, SP 01246-903, Brasil.
Patrícia Coelho De Soárez 1 Ana Marli Christovam Sartori 2 Andreia Santos 3
Alexander Itria 1
Hillegonda Maria Dutilh Novaes 1 Celina Maria Turchi Martelli 4,5
Abstract
The aim of this study was to present the contribu-tions of the systematic review of economic evalu-ations to the development of a national study on childhood hepatitis A vaccination. A literature review was performed in EMBASE, MEDLINE, WOPEC, HealthSTAR, SciELO and LILACS from 1995 to 2010. Most of the studies (8 of 10) showed favorable cost-effectiveness results. Sensitivity analysis indicated that the most important pa-rameters for the results were cost of the vaccine, hepatitis A incidence, and medical costs of the disease. Variability was observed in methodologi-cal characteristics and estimates of key variables among the 10 studies reviewed. It is not possible to generalize results or transfer epidemiological estimates of resource utilization and costs asso-ciated with hepatitis A to the local context. Sys-tematic review of economic evaluation studies of hepatitis A vaccine demonstrated the need for a national analysis and provided input for the de-velopment of a new decision-making model for Brazil.
Cost-Effectiveness Evaluation; Cost-Benefit Anal-ysis; Hepatitis A; Immunization Programs
Introduction
In health systems with an ever-increasing de-mand and limited resources, economic evalua-tion studies have become an important tool for policy decisions on the incorporation of new health technologies.
Systematic reviews of economic studies have become an essential part of technological evalu-ation and public policymaking processes. Some national agencies for the appraisal of health tech-nologies [like the National Institute for Health and Clinical Excellence (NICE), Pharmaceutical Benefits Advisory Committee (PBAC), and Ca-nadian Agency for Drugs and Technologies in Health (CADTH)] require systematic review of the relevant economic literature for evaluation and policymaking processes in public health 1.
The methodology for summarizing the re-sults of economic evaluations is not as well-developed as that applied to clinical evidence. The most solidly established methods for sum-marizing economic evaluations are: narratives summary, the cost-effectiveness plane, and per-mutation matrices 2.
The-oretically, a meta-analysis of economic evalua-tions can be performed, but in practice it is not a simple procedure 4. The lack of details in
esti-mates, variability in the outcomes used for ef-fectiveness, and heterogeneity of the economic evaluations identified in the literature hinder a meta-analysis of the results 3. In most cases,
statistical “pooling” of the cost-effectiveness es-timates (meta-analysis) is neither feasible, nor does it make sense 1. Narrative synthesis has
been the most widely used method.
The systematic review of economic studies has been indicated to: (1) contribute to the devel-opment of a new decision model; (2) identify one or two more relevant studies to inform a particu-lar decision in a jurisdiction; or (3) identify the principal economic “trade-offs” in a given treat-ment choice or disease area 1.
In Brazil, the National Immunization Pro-gram (PNI) commissioned an economic study to estimate the cost-effectiveness of incorporat-ing the hepatitis A vaccine. The hepatitis A vac-cine has been commercially available since the early 1990s 5 and has proven safe and effective.
In Israel, universal childhood vaccination has been conducted with great success since 1999 6,7.
Argentina in 2005 8 and the United States in
2006 9 also implemented programs for universal
childhood vaccination against hepatitis A, with a major impact on the epidemiology of the dis-ease 10. The pattern of hepatitis A endemicity in
Brazil suggests that the introduction of a uni-versal childhood vaccination program would be beneficial.
In this context, a systematic review of previ-ous economic evaluations is necessary in order to verify whether a recent analysis has been per-formed in Brazil, with similar objectives. Two sys-tematic reviews on the hepatitis A vaccine were published recently, approaching methodological issues related to the use of economic evaluation models 11 and the methodological quality of
eco-nomic evaluations of various vaccines 12.
A systematic review is thus necessary that includes complete economic evaluation studies analyzing the use of the hepatitis A vaccine in a program for universal vaccination of children up to six years of age. This cutoff was set for the current study considering the most adequate age for vaccination in Brazil, based on the epidemio-logical pattern of hepatitis A in transition, with regional variation, including areas of intermedi-ate and low endemicity 13,14.
When a new economic evaluation is justified, a review of previous economic studies can pro-vide input for the development of a new decision model. This type of review is useful for compar-ing and contrastcompar-ing how different researchers
made their choices in relation to the methodol-ogy and the estimation of key variables and to clarify how the results of analyses can differ ac-cording to these choices 15.
A systematic review of the existing economic studies allows evaluating whether the results can be generalizable or transferable and establishes the need (or lack thereof ) for developing local studies to estimate the cost-effectiveness ratio of the new vaccine to be incorporated.
The aim of this study is to present the con-tributions of a systematic review of economic evaluations to the development of a Brazilian na-tional study, based on the example of childhood hepatitis A vaccination. The article discusses the importance of this review and its applicability to the design of a local economic evaluation and the definition of public policies for immunization in the country.
Methods
Literature search
On May 26, 2010, a search was conducted in six databases: EMBASE, MEDLINE, WOPEC, Health-STAR, SciELO, and LILACS. The strategy (“eco-nomic evaluation” OR “cost” OR “cost-benefit” OR “cost-effectiveness” OR “cost-utility” OR “de-cision analysis”) AND (“hepatitis A” OR “hepatitis A vaccines”) was used in all the databases and was limited to articles published from 1995 to May 2010. On December 30, 2010, a new search was conducted, and no new publications were identified.
Inclusion/exclusion criteria
The following selection criteria were used: • Study design: complete economic evaluation, defined as a comparative analysis of costs and consequences of two alternative healthcare in-terventions; including cost-minimization sis, cost-effectiveness analysis, cost-utility analy-sis, and cost-benefit analysis;
• Type of intervention: universal childhood hepatitis A immunization program;
• Population: children up to 6 years of age. The review excluded incomplete economic evaluations, like cost analyses, and economic evaluations of specific groups such as workers, travelers, prison inmates, university students, adolescents, hepatitis C patients, and others.
hepatitis B vaccination is recommended soon af-ter birth (1st dose administered in the maternity
ward) 16 and is already included as routine in the
Brazilian National Immunization Program. Each study was reviewed in detail to extract and summarize information on:
• Methodological characteristics: type of study, perspective, model, herd protection, time ho-rizon, number of cohorts, currency and year of costs, discount rate, sensitivity analysis, and pa-rameters are varied in the sensitivity analysis; • Estimates of key variables: epidemiological (incidence, symptomatic outcomes, and case-fatality rate); characteristics of the vaccine (vac-cination scheme, coverage, efficacy, adverse events, and annual rate of waning of protec-tion); costs (direct and indirect), and summary measures.
To compare the results of the studies, the summary measures or incremental cost-effec-tiveness ratios (ICERs) were converted into U.S. dollars (US$) for 2005 using purchasing power parity (PPP), which is the exchange-rate equiva-lent of an identical basket of goods and services in two countries 17. The monetary values of the
results were corrected by the consumer price in-dex for all annual urban consumers of healthcare in 2005 18. Whenever the study did not specify the
year of cost, it was assumed that the year of cost was the same as that of the study’s publication. This strategy had been adopted previously in the literature 12.
In addition, the research funding sources were identified in order to assess whether they influenced the studies’ results.
The methodology used for summarizing eco-nomic evaluation studies was narrative synthesis. The methodological characteristics and estimates of key variables are shown in summary tables.
Results
Literature review
The initial searches identified approximately 1,047 articles. After reading the titles and/or ab-stracts, 20 studies were considered potentially rel-evant and retrieved in full text. At this stage, only one Brazilian article was selected, from the State of Paraná 19. However, after reading the complete
article it was excluded, since it turned out to be a cost analysis, or incomplete economic evalu-ation. The authors compared the costs of two strategies: not vaccinating and vaccinating. The non-vaccination strategy included direct medi-cal costs with consultations, laboratory tests, se-rological diagnostic tests (IgM), fulminant
hepa-titis, transplants, and retransplantation. The vac-cination strategy included the costs of vaccine doses and medical consultations due to adverse events. In order for the study to be considered a complete economic evaluation, in addition to costs it would have had to compare the health outcomes, for example hepatitis A cases averted.
After reading the full text of the 20 studies, 10 studies met the inclusion/exclusion criteria and will be discussed in the current review.
Methodological characteristics of the studies
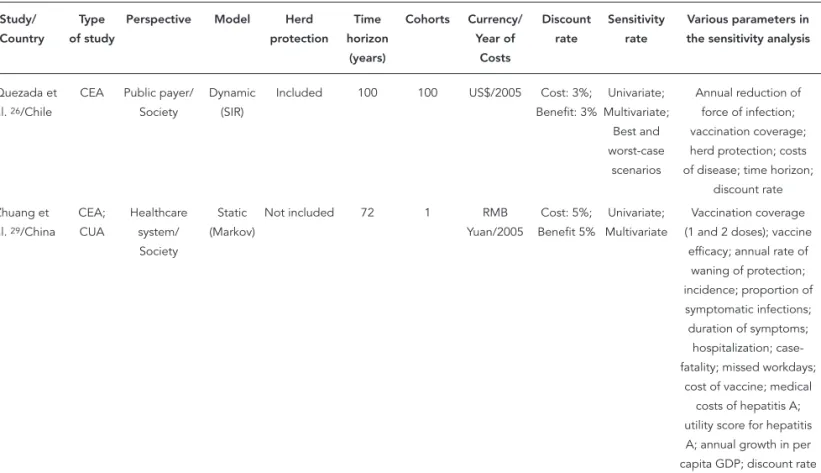
Table 1 shows the methodological characteris-tics of the 10 studies 20,21,22,23,24,25,26,27,28,29
ana-lyzed in the current review. Half of the studies were conducted in developed countries, the oldest 20 failed to specify the country but used
U.S. data in its analysis, three studies were per-formed in the United States 21,22,23, and one in
Israel 24. Four studies were conducted in South
America, including two in Chile 25,26 and two in
Argentina 27,28, and one study in China 29.
As specified by the authors, four studies per-formed cost-effectiveness analysis, three did cost-utility analysis, two did joint cost-effective-ness and cost-utility analysis, and only one did cost-benefit analysis.
As for the perspective from which the analysis was performed, the 10 studies adopted society’s perspective, which is that recommended for vac-cination programs planned to improve public health, because it considers both the direct and indirect costs of the intervention. Direct costs are those directly related to the disease and are divid-ed into mdivid-edical and non-mdivid-edical. Direct mdivid-edical costs are those immediately related to diagno-sis, treatment, and rehabilitation. They include tests, medicines, clinical or surgical procedures, etc. Meanwhile, direct non-medical costs include family costs with transportation (of the patient and accompanying person for receiving care), food (changes in the patient’s normal diet), etc. Indirect costs are related to loss of income and/or productivity and disability or death of productive persons as a result of the disease. Importantly, lost productivity is not limited to the patient; costs related to the persons (caregivers) who miss work in order to care for the patient should also be taken into account.
In addition to society’s perspective, four studies 22,25,26,29 also took the perspectives of
the healthcare system and public payer, which are relevant for assisting decision-making in the health sector.
Table 1
Methodological characteristics of economic evaluations of hepatitis A immunization programs.
Study/ Country
Type of study
Perspective Model Herd protection
Time horizon
(years)
Cohorts Currency/ Year of
Costs
Discount rate
Sensitivity rate
Parameters varied in the sensitivity analysis
Das 20/ Developed country
CUA Society Static (Markov)
Not included 74.5 1 ND Cost: 3%; Benefit: 3%
Univariate; Multivariate
Vaccination coverage; natural immunity; annual rate of waning of
protection; incidence; case-fatality; costs; acute
episodes of hepatitis a; doses of vaccine; serological tests; discount
rate Ginsberg et
al. 24/Israel
CBA Society Proxy model
Included 45 ND US$/1997 Cost: 4%; Benefit 4%
Univariate; Break-even
Incidence; vaccine efficacy; time horizon;
discount rate Jacobs et
al. 22/USA
CUA Healthcare system/ Society
Static (Markov)
ND 83 1 US$/2002 Cost: 3%; Benefit 3%
Univariate; Multivariate
Discount rate; incidence; annual rate of waning of protection; price of vaccine; administration
fee; QALY of symptomatic infections;
hospitalizations; transplants; case-fatality Valenzuela
et al. 25/
Chile
CEA Healthcare system/ Society
Static (Markov)
Partially included
50 1 US$/2004 Cost: 3%; Benefit 3%
Univariate Case-fatality; annual rate of waning of protection; costs; medical; doses of vaccine; lost workdays;
discount rate Rein et
al. 23/USA
CEA Society Static (Markov)
Not included 95 1 US$/2005 Cost: 3%; Benefit 3%
Univariate; Multivariate; Probabilistic
Incidence; vaccination coverage in adults; annual rate of waning of protection; adverse events; QALYs; public health costs; cost of dose of vaccine; administration
cost; discount rate Armstrong
et al. 21/USA
CEA Society Static (Markov)
Included 95 10 US$/2005 Cost: 3%; Benefit 3%
Univariate Incidence; vaccination coverage; annual rate of waning of protection;
QALYs; cost of vaccine Lopez et
al. 27/
Argentina
CEA Society Dynamic (SIR)
Included 100 100 US$/2004 Cost: 3%;
Benefit: ND
Univariate Annual reduction of force of infection; vaccination
coverage; herd protection; time horizon;
discount rate Ellis et al. 28/
Argentina
CUA Society Static (Markov)
ND 50 1 US$/2005 Cost: 3%; Benefit: 3%
Univariate; Multivariate
Annual rate of waning of protection; cost of dose
of vaccine
Table 1 (continued)
Study/ Country
Type of study
Perspective Model Herd protection
Time horizon
(years)
Cohorts Currency/ Year of
Costs
Discount rate
Sensitivity rate
Various parameters in the sensitivity analysis
Quezada et al. 26/Chile
CEA Public payer/ Society
Dynamic (SIR)
Included 100 100 US$/2005 Cost: 3%; Benefit: 3%
Univariate; Multivariate;
Best and worst-case
scenarios
Annual reduction of force of infection; vaccination coverage; herd protection; costs of disease; time horizon;
discount rate Zhuang et
al. 29/China
CEA; CUA
Healthcare system/ Society
Static (Markov)
Not included 72 1 RMB Yuan/2005
Cost: 5%; Benefit 5%
Univariate; Multivariate
Vaccination coverage (1 and 2 doses); vaccine
efficacy; annual rate of waning of protection; incidence; proportion of symptomatic infections; duration of symptoms;
hospitalization; case-fatality; missed workdays;
cost of vaccine; medical costs of hepatitis A; utility score for hepatitis A; annual growth in per capita GDP; discount rate
CBA: cost-benefi t analysis; CEA: cost-effectiveness analysis; CUA: cost-utility analysis; ND: not determined; QALY: quality-adjusted life year; GDP: gross domestic product; SIR: susceptible, infected, recovered.
The inclusion of herd protection in the eco-nomic analysis can make the program more cost-effective, because it increases the number of cases averted. It was included in four studies
21,24,26,27 and partially included in one 25. Two of
these studies 21,25 included herd protection in
their analysis, despite using static models. The study by Armstrong assumed a fixed proportion in the decline in infections, attributed to herd protection for persons within the vaccinated co-hort and for the unvaccinated 21. In Valenzuela
et al. 25, it was not clear how this was done. It
should be emphasized that static models usu-ally fail to consider indirect effects of vaccina-tion such as herd protecvaccina-tion and shift in the age at infection to older age groups. Some studies using static models consider herd protection, assuming that a fixed percentage of the unvac-cinated population is protected by the vaccina-tion of the vaccinated cohort 11. However,
an-other characteristic of herd protection, namely an increase in the age group of infection, can lead to an increase in the frequency of symp-tomatic cases and consequently a change (in-crease) in the use of health services, not consid-ered in static models. The inclusion of only the positive aspects of herd protection can result Finally, one study was unable to develop a
dy-namic model (which the author considered the gold standard) and thus developed a “proxy mod-el”, not described clearly by the author 24.
Table 2
Epidemiological estimates used in economic evaluations.
Study Incidence Source Symptomatic outcomes Source Case-fatality rate (%)
Source
Das 20 Annual hepatitis
A incidence in the unvaccinated population: 0.0001
ACIP Episodes of acute hepatitis
ACIP < 50 years: 0.3; > 50 years: 2.5
2 national articles
Ginsberg et al. 24
% cases of hepatitis type A; Reported cases of hepatitis A:
54/100,000
National statistics and Ministry of
Health
Mild and moderate cases: 84%; outpatient cases with relapse: 5.5%;
inpatient cases with relapse: 2.7%; severe hospital cases: 7.6%; non-fatal FHF without transplant: 0.024%; fatal
FHF without transplant: 0.028%; non-fatal FHF with transplant: 0.062%; fatal FHF with transplant:
0.008%
Personal communication and national data
0.0071 Ministry of Health
Jacobs et al. 22
Hepatitis A infection rates by age and region * and national
rate
SNVEDN Symptomatic infection rate (≤ 4 years: 7%;
5-9 years: 37%; 10-17 years: 71%; 18-29 years: 73%; 30-39 years: 74%; 40-49 years: 78%; 50-59 years: 82%; 60-69 years: 86%;
≥ 70 years: 90%); hospitalization rate (≤ 14 years: 5%; 15-29 years: 10%; 30-39 years:
11%; 40-49 years: 15%; 50-59 years: 21%; 60-69 years: 26%; 70-79 years:
33%;
≥ 80 years: 43%); transplant rate (≤ 14 years: 0%; 15-39 years: 0.02%; 40-49 years: 0.05%;
≥ 50 years: 0.08%)
2 national articles; 8 national articles; 2 national articles
Case-fatality rate (≤ 14 years: 0.14%; 15-29 years: 0.18%; 30-39 years: 0.21%; 40-49 years: 0.36%; 50-59 years: 0.81%; 60-69 years: 1.49%; 70-79 years: 2.83%;
≥ 80 years: 3.85%)
7 national articles
Valenzuela et al. 25
Reported hepatitis A infection rates per
100,000 (1-4 years: 99.1; 5-9 years: 259.7; 10-14 years: 154.0; 15-19 years: 55.8; 20-24 years: 31.0; 25-34 years: 14.7; 35-44 years: 6.9; 45-50 years: 5.6)
Ministry of Health and surveillance
data
Proportion of hepatitis A cases causing overt disease (1-4 years: 7%; 5-9 years: 37%; 10-17 years: 71%; 18-29 years:
73%; 30-39 years: 74%; 40-50 years: 78%); Hospitalization rate in overt hepatitis (0-14 years:
8%; > 14 years: 11%)
3 national articles; Ministry of Health
0-14 years: 0.14%; 15-29 years: 0.18%; 30-39 years: 0.21%; 40-50 years: 0.36%
1 international article
Table 2 (continued)
Study Incidence Source Symptomatic outcomes Source Case-fatality rate (%)
Source
Rein et al. 23 Reported annual hepatitis A incidence by age and region **
2 national articles Infection rate without jaundice with nonspecific symptoms (0.5); Infection rate with jaundice (0-4 years: 0.076; 5-14 years: 0.512; 15-95 years:0.832);
Hospitalization rate of reported cases with jaundice (0-4 years: 0.05;
5-14 years: 0.17; 15-39 years: 0.23; 40-59 years:
0.19; 60-95 years: 0.2)
Assumption; 1 national article; 1
national article
Case-fatality rate in cases with jaundice (0-4 years: 0.00030; 5-14 years: 0.00004;
15-39 years: 0.00054; 40-59 years: 0.00436;
60-95 years: 0.1276)
1 national article
Armstrong et al. 21
Reported annual hepatitis A incidence
by age and region ***
2 national articles Infection rate without jaundice with nonspecific symptoms (0.5); Infection rate with jaundice (0-4 years: 0.076; 5-14 years: 0.512; 15-95 years: 0.832);
Hospitalization rate of reported cases with jaundice (0-4 years: 0.05;
5-14 years: 0.17; 15-39 years: 0.23; 40-59 years:
0.19; 60-95 years: 0.2)
Assumption; 1 national article; 1
national article
Case-fatality rate in cases with jaundice (0-4 years: 0.00030; 5-14 years: 0.00004;
15-39 years: 0.00054; 40-59 years: 0.00436;
60-95 years: 0.1276)
1 national article
Lopez et al. 27
Age-specific force of infection based on seroprevalence data
Published data in Latin America and
Argentina
Risk of jaundice: 85.2%; Risk of FHF per symptomatic case: 0.00085; Risk of transplant
per symptomatic case: 0.00072; Risk of re-transplantation per symptomatic case: 0.00014; Risk of relapse
per symptomatic case: 0.15; Risk of hospitalization per symptomatic case: 0.05
Ministry of Health and 1 international
article; 2 national articles; 1 international article; 2 national articles; 1 international article
Age-specific per 100,000 (≤ 14 years:
140; 15-29 years: 180; 30-39 years: 210; 40-49 years: 360; 50-59 years: 810; 60-69 years: 1,490; 70-79 years:
2,630; ≥ 80 years: 3,850)
2 international articles
Ellis et al. 28 Reported annual
hepatitis A incidence per age and region #
and national rate
Ministry of Health; National statistics
Hepatitis A cases; Proportion of infection with symptoms (1-4 years:
7%; 5-9 years: 37%; 10-14 years: 71%; 15-49 years: 75.7%; ≥ 50 years:
86%); Hospitalization (0-14 years: 2.6%; 15-29 years: 3.6%; 30-39 years: 3.6%; > 39 years: 3.6%); Transplant (0-14 years:
0.027%; 15-29 years: 0.127%; 30-39 years: 0.127%; > 39 years:
0.127%)
Ministry of Health; 2 international articles; National
data and 1 international article;
1 national article; National statistics
0-14 years: 0.14%; 15-29 years: 0.18%; 30-39 years: 0.21%; > 39 years: 0.36%
2 international articles
Table 2 (continued)
Study Incidence Source Symptomatic outcomes Source Case-fatality rate (%)
Source
Quezada et al. 26
Age-specific force of infection based on seroprevalence data
Data published in Chile
Infected individuals with jaundice (85.2%);
Hospitalization (0-14 years: 0.08; ≥ 15 years: 0.11); Transplant (0-14 years: 0.0001; ≥ 15 years:
0.0003)
2 international articles
Age-specific per 100,000 (≤ 14 years: 140; 15-29 years: 180; 30-39 years: 210; 40-49 years: 360; 50-59 years: 810; 60-69 years: 1.490; 70-79 years: 2.630;
≥ 80 years: 3.850)
2 international articles; Ministry of
Health, Argentina
Zhuang et al. 29
Annual incidence based on region-specific seroprevalence
data ##
National technical document
Proportion of infections with symptoms (1-4 years: 7%; 5-9 years: 37%; 10-17 years: 71%; ≥ 18-years:
75%); Hospitalization (1-14 years: 0.08; ≥ 15
years: 0.15)
4 international articles; 2 international articles
1-4 years: 0.0030; 15-39 years: 0.00054; 40-59 years: 0.00436; ≥ 60
years: 0.1276
1 international article
ACIP: Advisory Committee on Immunization Practices (USA); FHF: fulminant hepatic failure; SNVEDN: National System for Epidemiological Surveillance of Diseases of Notifi cation.
* 4 regions: ≥ 200% of mean national incidence, 100-199% of mean national incidence, 50-99% of mean national incidence, ≤ 50% of mean national incidence; ** 3 regions: regions 1 and 2 (incidence 1-2 times the national mean), region 3 (national mean);
*** 3 regions: region with high endemicity, region with intermediate endemicity, and region with low endemicity;
# 5 regions: Northeast and Central regions (incidence below the national mean), South (national mean), Cuyo and Northwest regions (incidence above the
national mean);
## 5 regions: very low prevalence of hepatitis antibodies A (50%), low prevalence of hepatitis A antibodies (50-69%), intermediate prevalence of hepatitis A
antibodies (70-79%), high prevalence of hepatitis A antibodies (80-89%), very high prevalence of hepatitis A antibodies (90%).
in overestimation of the vaccination program’s beneficial effects.
The inclusion of herd protection can have a major impact on the vaccination program’s pre-dicted outcomes. For example, Ginsberg et al. 24,
when modeling the potential economic and health benefits of an immunization program for children 1-2 years of age in Israel, estimated that it would take 15 years for the program to reduce symptomatic cases by 90%. However, in real life, routine immunization in Israel achieved a reduc-tion of greater than 90% in just three years, due partially to the herd protection induced by vac-cination 6.
The majority of the studies (7 of 10) used long time horizons, more than 70 years, accompanying the life expectancy of the cohorts 20,21,22,23,26,27,29.
They all used standard discount rates, from 3 to 5%, and only one study 27 failed to report the
dis-count of benefits.
Estimates of key variables
Epidemiological estimates •
Table 2 summarizes the epidemiological esti-mates used in the economic evaluations.
All the studies used local data to build esti-mates of incidence and force of infection. Four studies 21,22,23,28 presented data on regional
in-cidence and conducted regional and nationwide cost-effectiveness analyses. The study in China 29
conducted only regional analyses, without pre-senting a nationwide analysis.
The most frequently used outcomes were out-patient cases, inout-patient cases, transplant cases, and deaths. To estimate the number of symptom-atic cases, eight studies 21,22,23,25,26,27,28,29 used the
study by Armstrong & Bell 30 which calculated the
probability of developing jaundice during acute hepatitis A according to age group, utilizing data from different primary studies.
their local estimate, and only four studies in Argentina 27,28, Chile 26, and China 29 used U.S.
case-fatality data.
Characteristics of the vaccine •
Table 3 presents the vaccine’s characteristics. In relation to the vaccination scheme, most stud-ies adopted vaccination of children up to 24 months of age. Only two studies evaluated the strategy with a second dose at 54 and 72 months of age 25,28. And only one Argentine study
evalu-ated single-dose vaccination 28. Argentina is the
only country to have implemented a single-dose immunization program against hepatitis A 8.
As for vaccination coverage, only three stud-ies used more conservative coverage rates, from 69 to 89% 20,22,29.
All the studies used data on vaccine efficacy (percentage risk reduction in vaccinated individ-uals as observed in clinical trials). No study psented data on effectiveness (percentage risk re-duction in vaccinated individuals as observed in routine use of the vaccine). Efficacy rates ranged from 91 to 98% for the first dose and from 95 to 100% for the second dose.
Data in the literature suggest that protection provided by the hepatitis A vaccine is long-last-ing: persistence of antibodies or anamnestic re-sponse to a booster dose of the vaccine, or both, was demonstrated up to 12 years after the 2-dose vaccination scheme 31. Even so, the analyses in
the 10 studies assumed waning of protection over time after vaccination. Five studies 20,21,22,23,24
used estimates based on models of antibody per-sistence 32,33. Three of these studies 25,28,29 used
estimates constructed by an expert panel in the United States (1.62% per year in the first 10 years and 2.67% thereafter, after one dose of the vac-cine, and 0.31% and 0.62% after two doses) 34.
Two studies 26,27, despite using the same expert
panel cited above as the reference 34 , presented
an estimate of 0.58% per year, without specifying at what year after vaccination the waning of im-munity was expected to occur.
Cost estimates •
Table 4 summarizes the elements considered in the cost estimates. All the studies included di-rect medical costs, costs with the vaccine, and indirect costs. In most cases, direct medical costs were related to treatment of hepatitis A in outpatients, inpatients, hepatic failure with or without subsequent transplant, and follow-up of transplant patients. All the studies used lo-cal data to estimate direct medilo-cal costs, except for Quezada et al. 26, in Chile, who used
inter-national studies, and Armstrong et al. 21, who
did not specify the sources used to construct the direct cost estimates. The four studies 22,23,25,28
that included costs with follow-up of transplant patients used data from studies by Berge et al. 35 and/or Hauboldt 36, conducted in the
Unit-ed States.
As for costs with the vaccine, nine studies considered the values for the dose and adminis-tration, two studies included the cost of adverse events 24,26 , and only one included the cost of
wasted vaccines and transportation to receive the vaccine 24.
As for indirect costs, eight studies calculated lost productivity due to the disease for patients, while four studies also calculated lost productiv-ity for caregivers. One study calculated the wage losses of spouses, assuming that they acted as caregivers 24. Four studies 20,22,23,25 only used
lo-cal data to estimate indirect costs, three 24,28,29
used international articles, and three 21,26,27 failed
to specify their sources. In general, the calcula-tion was performed using the country’s median wage, adjusted for the unemployment rate. Only one study 29 used per capita GDP to construct
this estimate, due to the lack of a reliable national wage estimate.
The number of lost workdays varied from 13.25 days in mild to moderate cases up to a year and a half for persons with non-fatal fulminant hepatic failure with transplant. In hospital cases this figure ranged from 33 to 71 days. Referring to the same source 35, different authors 25,28,29,34
reported different estimates of lost workdays.
Results of the analyses
Table 5 shows the summary measures presented in the results of the analyses. In general, stud-ies funded by industry reported more favorable ICERs than the independent studies. All the stud-ies showed favorable cost-effectiveness results, below US$ 20,000 per quality-adjusted life year (QALY) gained 37, except for two independent
studies 21,23 that showed ICERs of US$ 28,000
and US$ 32,000 per QALY gained, respectively. When the latter included herd protection in the analysis, the ICER dropped from US$ 32,000 to US$ 1,000 per QALY gained.
One study 20 found that the hepatitis A
vac-cine was within the accepted cost-effective range, using US$ 42,000 per year of life saved as the cutoff 38. Jacobs et al. 22 found the value
of the hepatitis A vaccination program compa-rable to that of other immunization programs. Valenzuela et al. 25 and Zhuang et al. 29 used per
Table 3
Characteristics of vaccine.
Study Vaccination scheme Coverage (%) Efficacy (%) Adverse events (%)
Annual rate of waning of protection (%) 1st dose 2nd dose 1st dose 2nd dose
Das 20 2 doses (0 and 6-12 months) 80 80 ND ND NC 12 * Ginsberg
et al. 24
2 doses (15 and 24 months) 95 92 94 95 Mild (1.25: 1st dose; 2.50: 2nd
dose)
2 (after 10 years)
Jacobs et al. 22 2 doses (2 years) 89 69 98 99 NC 2.3 **
Valenzuela et al. 25
2 doses (18 and 24 months or 18 and 54 months)
96 80 (24 months);
92.2 (54 months)
98 99 ND With 1 dose: 1.62 (1-10 years); 2.67 (after 10 years)
With 2 doses: 0.31 (1-10 years); 0.62 (after 10 years) Rein et al. 23 2 doses (12 months) 93 87 91 100 Mild: 0.5;
Severe: 0.0001
20 (1-5 years); 5 (after 5 years) Armstrong
et al. 21
2 doses (12 months) 93 87 91 100 Mild: 0.5; Severe: 0.0001
20 (1-5 years); 5 (after 5 years) Lopez et al. 27 2 doses (12 and 18 months) 95 95 95 100 0.03 0.58 * Ellis et al. 28 1 dose (12 months) or
2 doses (12 and 18 months or 12 and 72 months)
95 76 (18 months);
66.5 (72 months)
98 99 ND With 1 dose: 1.62 (1-10 years); 2.67 (after 10 years)
With 2 doses: 0.31 (1-10 years); 0.62 (after 10 years) Quezada
et al. 26
2 doses (12 and 18 months) 95 95 95 100 0.03 0.58 *
Zhuang et al. 29 2 doses (12 and 18 months) 85 80 93 95 ND With 1 dose: 1.62 (1-10
years); 2.67 (after 10 years) With 2 doses: 0.31 (1-10 years); 0.62 (after 10 years)
NC: not considered; ND: Not determined.
* Not determined at what year waning of protection begins;
** Waning of protection twice as fast in individuals that received only 1 dose of vaccine.
program cost-effective, since it was comparable to other public health interventions such as dia-betes screening in patients with hypertension (US$ 34,000) and HIV screening in the general population (US$ 42,000). The other five authors
21,24,26,27,28 did not specify the cost-effectiveness
criterion used when interpreting the results. Universal childhood hepatitis A vaccination proved to be cost-saving (costs iess and is more effective than the non-vaccination strategy) in areas with higher incidence of the disease in Argentina 28 and the United States 22,23. In Ellis
et al. 28, vaccination proved to be cost-saving in
the Cuyo region (high endemicity), while in the South region (intermediate endemicity) the ICER was US$ 673 per QALY gained and in the North-east region (low endemicity) the ICER was US$ 2,772 per QALY gained. Jacobs et al. 22 showed
similar findings: the vaccination program proved to be cost-saving in regions with incidence rates
≥ 200% and 100-199% of the national average, while in regions with incidence rates 50-99% of the national average the ICER was US$ 13,800 per QALY gained and with incidence rates < 50% of the national average the ICER was US$ 63,000 per QALY gained. In Rein et al. 23, vaccination proved
to be cost-saving in regions 1 and 2 (with twice the mean national incidence), and in region 3 (with the country’s mean incidence) the ICER was US$ 133,000 per QALY saved.
Meanwhile, in China 29, in areas with the
lowest, low, intermediate, and high prevalence of hepatitis A antibodies, the immunization pro-gram proved to be cost-saving, but in areas with extremely high prevalence of hepatitis A antibod-ies, the ICER was US$ 277.
Table 4
Elements considered in cost estimates.
Study Cost elements Sources
Das 20 Direct medical costs: acute episodes of hepatitis A 2 national articles
Costs with vaccine: dose; administration; hepatitis A antibody tests 3 national articles Indirect costs: lost productivity 1 national article Ginsberg
et al. 24
Direct medical costs: laboratory tests; prophylaxis in communicants; mild and moderate cases; outpatient cases with relapse; inpatient cases with relapse; severe hospital cases; non-fatal fulminant hepatic failure without transplan; fatal fulminant hepatic failure without transplant; non-fatal fulminant hepatic failure with transplant; fatal fulminant hepatic failure without transplant
National data
Direct non-medical costs: transportation for outpatient consultations and hospitalization National data Costs with vaccine: doses; administration; waste; adverse events; health education; transportation National statistics Indirect costs *: lost productivity, patient; lost productivity, spouse (U.S. wage adjusted for
unemployment rate)
2 international articles
Jacobs et al. 22 Direct medical costs: outpatient; inpatient; transplant; transplant follow-up 2 national articles;
Transplant Registry/U.S. Costs with vaccine: doses; administration CDC; 1 national article Indirect costs: lost productivity in outpatients – 15 days; lost productivity in hospital patients –
33 days (median wage, USA)
National statistics; 1 national article
Valenzuela et al. 25
Direct medical costs: outpatient; inpatient; transplant; transplant follow-up Ministry of Health of Chile Costs with vaccine: doses; administration CDC; Ministry of Health of
Chile
Indirect costs: lost productivity in patients 20-59 years of age – 28 days (median daily wage in Chile) Ministry of Health of Chile; Central Bank of Chile Rein et al. 23 Direct medical costs: symptomatic outpatients without jaundice; unreported outpatients with
jaundice; inpatients with jaundice; fulminant hepatic failure without transplant; transplant; transplant follow-up; public health costs per reported case
3 national articles
Costs with vaccine: doses; administration CDC Indirect costs: lost productivity for patients and caregivers (median expected weekly wage) Population survey Armstrong
et al. 21
Direct medical costs: public health costs ND Costs with vaccine: dose; administration ND Indirect costs: lost productivity following death from hepatitis A; lost productivity of patients; lost
productivity of parents of children with hepatitis A
ND
Lopez et al. 27 Direct costs: laboratory tests; administration of immunoglobulin M; outpatient consultations; hospital
fees; fulminant hepatic failure without transplant; fulminant hepatic failure with transplant; Re-transplantation
National statistics; Abstract from Argentine study
Costs with vaccine: doses Abstract from Argentine study
Indirect costs ND
Ellis et al. 28 Direct medical costs: outpatient; inpatients without fulminant hepatic failure; inpatients with
fulminant hepatic failure without transplant; inpatients with fulminant hepatic failure with transplant; transplant follow-up
Records and data on national costs
Costs with vaccine: doses; administration PAHO Revolving Fund Indirect costs: lost productivity of patients > 17 years of age -28 days (regional wage) 3 international articles;
National statistics
Table 4 (continued)
Study Cost elements Sources
Quezada et al. 26 Direct medical costs: outpatient treatment; inpatient treatment; fulminant hepatic failure with
transplant
3 international articles; 2 national articles Costs with vaccine: doses; administration; adverse events 3 international articles;
2 national articles Indirect costs: lost productivity of parents of patients ≤ 15 years of age – 3 days; lost productivity of
patients > 15 years -25 days
ND
Zhuang (2008) 29 Direct medical costs: non-hospital cases; hospital cases; fatal cases Ministry of Health Costs with vaccine: doses; administration Price paid by government;
U.S. CDC Indirect costs: lost productivity of patients 18-60 years; non-hospital cases – 16 days; hospital cases –
33 days; fatal cases – 40 days (per capita GDP/365.5)
3 international articles
CDC: Centers for Disease Control and Prevention (USA); ND: not determined; PAHO: Pan-American Health Organization; GDP: gross domestic product. * Number of lost workdays is specifi c to types of cases: mild and moderate cases in adults (13.25 days); mild and moderate cases in children (9.29 days); outpatient cases with relapse (46.3 days); hospital cases with relapse (46.3 days); severe hospital cases (71 days); non-fatal fulminant hepatic failure without transplant (6 months for survivor and 6 weeks for spouse); fatal fulminant hepatic failure without transplant (10.5 days for deceased patient and 21 days for spouse); non-fatal fulminant hepatic failure with transplant (1.5 year for survivor and 1 year for spouse); fatal fulminant hepatic failure with transplant (10.5 days for deceased patient and 21 days for spouse).
While the United States has low endemicity, Ar-gentina, Chile, and China are in transition from high to intermediate or low endemicity 14. The
severity of hepatitis A increases with age: jaun-dice is reported in only 7% of children less than four years of age with hepatitis A 30. Meanwhile,
more than 70% of older children and adults are symptomatic, with clinical jaundice in 40 to 70% of cases 30,39. In countries with high endemicity,
infection occurs in early childhood, and the vast majority of cases are asymptomatic. The tran-sition from high to low endemicity can lead to an increase in age at infection, with an increase in symptomatic cases and thus greater utiliza-tion of health services, which would explain the higher cost-effectiveness ratio in areas with ex-tremely high endemicity.
Sensitivity analyses (Table 1) showed that the parameters with the greatest impact on the results of economic evaluations were cost of the vaccine dose and administration, followed by incidence and medical costs of the disease. Four 26,27,28,29 of the 10 studies presented
ro-bust results in favor of vaccination, which did not change with variations in the parameters for sensitivity analyses.
Discussion
This systematic review of economic studies on childhood hepatitis A vaccination showed that this type of study can contribute to the develop-ment of a national decision-making model. The
review pointed to some important issues to be considered when using the methodology and es-timates of key variables in the published studies, especially in relation to the transferability of data and generalizability of results.
We observed variability among the studies under review in relation to the methodological characteristics and estimates of key variables. Methodological characteristics accounted for some differences in the studies’ results, particu-larly the perspective and type of model used.
The type of perspective adopted by the study is a methodological choice. Many experts recom-mend society’s perspective, because it is more comprehensive 15. In this review, when three
studies 22,23,25 took society’s perspective, the
re-sults were very different from those obtained us-ing the healthcare system’s perspective (Table 5). Although all the studies took society’s perspec-tive (considering direct and indirect costs), in the Brazilian case it is also recommendable to conduct the study from the healthcare system’s perspective, because it provides results that only consider the amounts reimbursed by the Unified National Health System and can assist public managers in the decision making process.
As for the type of model, although most of the studies (7 of 10) used a Markov static model
20,21,22,23,25,28,29, the review suggests the
sero-Table 5
Summary measures presented in results according to the perspective of the analysis and funding source.
Funding Source Perspective
Society Healthcare system
Independent
Das 20 US$ 14,948 per QALY gained ND
Ginsberg et al.24 Cost-benefit ratio *: 3.07:1 Cost-benefit ratio **: 2.17:1
Rein et al. 23 US$ 284 per averted infection
US$ 199,000 per year of life gained US$ 28,000 per QALY gained
ND ND
US$ 40,000 per QALY gained Armstrong et al. 21 US$ 32,000 per QALY gained (without
considering herd protection) US$ 1,000 per QALY gained (considering
herd protection)
ND
Zhuang et al. 29 < 0 ***: US$ 3,633 per year of life gained < 0 ***: US$ 277 per QALY gained
< 0 ***: US$ 2,680 per year of life gained < 0 ***: US$ 204 per QALY gained Industry
Jacobs et al. 22 US$ 2,382 per year of life gained US$ 1,516 per QALY gained
US$ 15,265 per year of life gained #
US$ 9,852 per QALY gained #
Valenzuela et al. 25 < 0 ## per year of life gained
< 0 ## per QALY gained
US$ 475-US$ 911 per year of life gained US$ 290-US$ 520 per QALY gained Lopez et al. 27 US$ 3,542 per year of life gained ND
Ellis et al. 28 < 0 ###: US$ 234 per QALY gained (1 dose of vaccine) < 0 §: US$ 2,772 per QALY gained
(2 doses of vaccine)
ND
Quezada et al. 26 US$ 4,984 per year of life gained ND
ND: not determined; QALY: quality-adjusted life year. * US$ 1 invested in vaccination produces a savings of US$ 3.07; ** US$ 1 invested in vaccination produces a savings of US$ 2.17;
*** Incremental ratio was negative in regions with low, medium, intermediate, and high endemicity and was US$ 3,633 per year of life gained in the region
with extremely high endemicity; incremental ratio was negative in regions with low, medium, intermediate, and high endemicity and was US$ 277 per QALY gained in the region with extremely high endemicity; incremental ratio was negative in regions with low, medium, intermediate, and high endemicity and was US$ 2,680 per year of life gained in the region with extremely high endemicity; incremental ratio was negative in regions with low, medium, intermediate, and high endemicity and was US$ 204 per QALY gained in the region with extremely high endemicity;
# Health service’s perspective;
## Negative incremental ratio means that the vaccination strategy is “cost-saving”, cost less and is more effective;
### Incremental ratio was negative in Argentina as a whole and US$ 234 per QALY gained in the Cuyo region;
§ Incremental ratio was negative in the Cuyo region and US$ 2,772 per QALY gained in the Northeast region.
prevalence in Brazil. Data from the recent Na-tional Hepatitis Survey allow feeding a dynamic model for hepatitis A.
The Brazilian dynamic model should con-sider both the positive aspects of herd protec-tion such as the increase in averted cases of the disease and the negative aspects like the change in age at infection and proportion of symptom-atic cases and use of health services, in order to avoid overestimating the beneficial effects of the
vaccination program with more favorable cost-effectiveness results.
Estimates of the key variables also accounted for differences in the results in the studies re-viewed here.
cost of the vaccine and the inclusion of social costs. Cost-effectiveness in high-incidence ar-eas proved more robust to changes in the cost of the vaccine or other costs 12. Data from
epide-miological estimates are considered to have low transferability in economic evaluations. Mea-sures of clinical events can be misleading if there are differences in the underlying epidemiological estimates. The “guidelines” recommend the use of specific country data 40. In the absence of local
data, it is recommended that data from countries with similar endemicity be used. Despite the ex-istence of studies in Chile 25,26 and Argentina 27,28
with similar epidemiological profiles, the results are not transferable due to the differences in the organization of healthcare and coverage in the respective health systems.
In the Brazilian case, the preference should be for regional analyses based on different pat-terns of endemicity, in addition to a nationwide analysis. To conduct a nationwide analysis, the most important issue would be the availability of reliable data on incidence of the infection, number of symptomatic cases, and deaths from hepatitis A. The data on probability of symp-tomatic infection (jaundice) may be transfer-able from other studies, because in this specific case there is no reason for the natural history of the disease to differ between countries. Stud-ies in Argentina 27,28, Chile 25,26, and China 29
used the proportion of symptomatic individuals among the infected, provided by Armstrong & Bell 30, a study conducted in the United States.
The Brazilian national study could repeat this approach. As for case-fatality, although some studies in the review used international data, the Brazilian study should use national data. Guidelines suggest that this estimate should only be transferred from similar locations in the absence of data on case-fatality in the country itself, but that the estimate should be validated by expert panels.
In addition, detailed data are necessary on access to health services, healthcare patterns, and use of resources in outpatient, inpatient, and transplant cases, as well as on post-trans-plant follow-up. The studies reviewed here do not provide details on the methodology used for the identification and measurement of resources used in treatment of the previously cited cases. Data on use of resources are considered to have intermediate transferability. The guidelines from pharmacoeconomics recommend obtaining data on the use of resources from the location where the evaluation is being performed. Dif-ferences in clinical practices, payment systems, and incentives are generally cited as the princi-pal reasons for variation in the use of resources
between one location and another. When there are no local data and it becomes necessary to transfer data from elsewhere, an expert panel is recommended for reviewing the data and evaluating whether the treatment patterns are similar, in order to produce more relevant esti-mates for the local context 40. The Brazilian case
requires obtaining the pattern of care practiced in local health services in order to determine the resources (medical consultations, hospitaliza-tions, tests, drugs, etc.) and the amounts used in outpatient, inpatient, and transplant cases and post-transplant follow-up.
Most studies (8 of 10) used local data to es-timate direct medical costs. Data from cost esti-mates are considered to have low transferability. The guidelines are very strict and do not allow transferring these data under any circumstances. Cost unit estimates must be specific to the con-text being evaluated, due to differences in ab-solute and relative prices between countries 40.
Thus, in the Brazilian case, direct medical costs for outpatient and inpatient treatment of hepati-tis A, hepatic failure with or without subsequent liver transplant, and post-transplant follow-up, as well as the costs of the vaccine, must necessar-ily use local data.
The inclusion of indirect costs related to lost productivity was important in determining the attractiveness of the immunization program (Table 5). Value assessment of lost work time de-pends on the country’s wage and employment levels. Four studies 20,22,23,25 used only local data
to estimate indirect costs, indicating greater dif-ficulty in obtaining local data for this estimate. In the Brazilian national study, additional efforts should be made to accurately document the real number of lost workdays related to the disease locally, since indirect costs of the disease can have an important impact on the results of the analysis.
Data on the effect of treatment are consid-ered highly transferable 40. The vaccine’s efficacy,
Summary of Recommendations for
a Brazilian National Model
Based on the information obtained from the ar-ticles in this review, it is possible to summarize some methodological characteristics and esti-mates of key variables to be used in the Brazilian national model:
• Adopt the society and healthcare system per-spectives;
• Develop a dynamic transmission model; • In addition to the national analysis, conduct regional analyses according to different patterns of endemicity;
• Use national data on incidence, force of in-fection, and case-fatality;
• Use national data on access to health ser-vices, patterns of care, and use of resources in outpatient, inpatient, and transplant cases; • As a comparative strategy, adopt a vaccina-tion scheme adjusted to the prevailing navaccina-tional childhood immunization calendar;
• Use local data to estimate direct medical costs;
• Use local data on coverage and cost of the vaccine;
• Consider international data on vaccine ef-ficacy if local data on effectiveness are not avail-able;
• Use local data to estimate indirect costs re-lated to lost productivity;
• Discount costs and benefits at a 5% standard rate;
• Conduct sensitivity analysis for the estimates of incidence, cost of dose, and administration of the vaccine and medical costs of the disease.
Final remarks
Economic evaluations can benefit from system-atic reviews of the clinical literature. However, prior review of the literature is not sufficient to guarantee a good economic evaluation 41. Some
authors have questioned the contributions of systematic reviews and raised concerns about generalizing the results of economic evaluation studies. Unlike systematic reviews of treatment effects in randomized controlled clinical trials, the cost-effectiveness results of new interven-tions are more context-dependent than the clinical efficacy results. The cost-effectiveness of a particular intervention is heavily influenced by the use of resources and the costs associated with the intervention, which vary between coun-tries, regions, or types of services, as well as over time 42,43,44.
Economic evaluations in health make use of epidemiological data and data on access and use of health services, treatment patterns, and costs associated with the disease, which vary greatly between countries, making it very difficult to generalize and/or transfer the results to differ-ent contexts. The systematic review of economic evaluation studies for the hepatitis A vaccine showed that it is not possible to generalize the results to the Brazilian context, and confirmed the need to develop a local study to estimate the cost-effectiveness ratio of the new vaccine to be incorporated.
Resumo
O objetivo deste estudo foi apresentar as contribuições da revisão sistemática de avaliações econômicas pa-ra o desenvolvimento de um estudo nacional, o caso da vacinação infantil contra hepatite A. Foi realiza-da revisão realiza-da literatura nas bases de realiza-dados EMBASE, MEDLINE, WOPEC, HealthSTAR, SciELO e LILACS, no período de 1995 a 2010. A maioria dos estudos (8 em 10) mostrou resultados favoráveis de custo-efetivida-de. As análises de sensibilidade indicaram como parâ-metros mais importantes para os resultados os custos da vacina, incidência de hepatite A e custos médicos da doença. Foi observada variabilidade nas caracterís-ticas metodológicas e estimativas de variáveis-chaves dos 10 estudos revisados. Não é possível generalização dos resultados e transferibilidade de estimativas epi-demiológicas, de usos de recursos e custos associados à hepatite A para o contexto local. A revisão sistemática dos estudos de avaliação econômica da vacina contra hepatite A demonstrou a necessidade de uma análise nacional e forneceu elementos para o desenvolvimen-to de um novo modelo de decisão para o Brasil.
Avaliação de Custo-Efetividade; Análise Custo-Benefí-cio; Hepatite A; Programas de Imunização
Contributors
P. C. De Soárez participated in the design and planning, data analysis and interpretation, elaboration of the draft, and approval of the final version of the article. A. M. C. Sartori participated in the design and planning, elaboration of the draft, critical review of the content, and approval of the final version of the article. A. Santos participated in the design and planning, critical review of the content, and approval of the final version of the article. A. Itria participated in the data analysis and in-terpretation, critical review of the content, and appro-val of the final version of the article. H. M. D. Novaes participated in the design and planning, critical review of the content, and approval of the final version of the article. C. M. T. Martelli participated in the design and planning, critical review of the content, and approval of the final version of the article.
Acknowledgments
The authors are research members from the National Institute of Science and Technology for Health Tech-nology Assessment (IATS). This research was sponso-red by CNPq, IATS, and the authors’ institutions. C. M. T. Martelli received resarch scholarship (CNPq # 306489/2010-4)
References
1. Anderson R. Systematic reviews of economic evaluations: utility or futility? Health Econ 2010; 19:350-64.
2. Nixon J, Khan KS, Kleijnen J. Summarising eco-nomic evaluations in systematic reviews: a new approach. BMJ 2001; 322:1596-8.
3. Centre for Reviews and Disseminations, Univer-sity of York. Systematic reviews. CRD’s guidance for undertaking reviews in health care. York: Cen-tre for Reviews and Disseminations, University of York; 2008.
4. Shemilt I, Mugford M, Byford S, Drummond M, Eisenstein E, Knapp M, et al. Chapter 15: incor-porating economic evidence. In: Higgins J, Green S, editors. Cochrane handbook for systematic re-views of interventions, Version 5.0.0. The Cochrane Collaboration, 2008. http://www.cochrane-hand book.org.
5. Nothdurft HD. Hepatitis A vaccines. Expert Rev Vaccines 2008; 7:535-45.
6. Dagan R, Leventhal A, Anis E, Slater P, Ashur Y, Shouval D. Incidence of hepatitis A in Israel fol-lowing universal immunization of toddlers. JAMA 2005; 294:202-10.
7. Chodick G, Heymann AD, Ashkenazi S, Kokia E, Shalev V. Long-term trends in hepatitis A incidence following the inclusion of hepatitis A vaccine in the routine nationwide immunization program. J Viral Hepat 2008; 15 Suppl 2:62-5.
8. Vacchino MN. Incidence of hepatitis A in Argen-tina after vaccination. J Viral Hepat 2008; 15 Suppl 2:47-50.
10. Hendrickx G, Van Herck K, Vorsters A, Wiersma S, Shapiro C, Andrus JK, et al. Has the time come to control hepatitis A globally? Matching prevention to the changing epidemiology. J Viral Hepat 2008; 15 Suppl 2:1-15.
11. Bos JM, Alphen L, Postma MJ. The use of modeling in the economic evaluation of vaccines. Expert Rev Pharmacoecon Outcomes Res 2002; 2:443-55. 12. Anonychuk AM, Tricco AC, Bauch CT, Pham B,
Gilca V, Duval B, et al. Cost-effectiveness analyses of hepatitis A vaccine: a systematic review to ex-plore the effect of methodological quality on the economic attractiveness of vaccination strategies. Pharmacoeconomics 2008; 26:17-32.
13. de Alencar Ximenes RA, Martelli CM, Merchán-Ha-mann E, Montarroyos UR, Braga MC, de Lima ML, et al. Multilevel analysis of hepatitis A infection in children and adolescents: a household survey in the Northeast and Central-west regions of Brazil. Int J Epidemiol 2008; 37:852-61.
14. Jacobsen K. The global prevalence of hepatitis A virus infection and susceptibility: a systematic re-view. Geneva: World Health Organization; 2009. 15. Pignone M, Saha S, Hoerger T, Lohr KN, Teutsch S,
Mandelblatt J. Challenges in systematic reviews of economic analyses. Ann Intern Med 2005; 142(12 Pt 2):1073-9.
16. Hepatitis B vaccines. Wkly Epidemiol Rec 2009; 84:405-19.
17. Organization for Economic Co-operation and Development. Purchasing power parities (PPP). http://www.oecd.org/std/ppp (accessed on 20/ Sep/2011).
18. US Department of Labor. US labor statistics data. Consumer Price Index. http://www.bls.gov/cpi/. 19. Zahdi MR, Maluf I, Maluf EM. Hepatitis A: the costs
and benefits of the disease prevention by vaccine, Paraná, Brazil. Braz J Infect Dis 2009; 13:257-61. 20. Das A. An economic analysis of different strategies
of immunization against hepatitis A virus in devel-oped countries. Hepatology 1999; 29:548-52. 21. Armstrong GL, Billah K, Rein DB, Hicks KA, Wirth
KE, Bell BP. The economics of routine childhood hepatitis A immunization in the United States: the impact of herd immunity. Pediatrics 2007; 119:e22-9.
22. Jacobs RJ, Greenberg DP, Koff RS, Saab S, Meyer-hoff AS. Regional variation in the cost effectiveness of childhood hepatitis A immunization. Pediatr In-fect Dis J 2003; 22:904-14.
23. Rein DB, Hicks KA, Wirth KE, Billah K, Finelli L, Fiore AE, et al. Cost-effectiveness of routine child-hood vaccination for hepatitis A in the United States. Pediatrics 2007; 119:e12-21.
24. Ginsber GM, Slater PE, Shouval D. Cost-benefit analysis of a nationwide infant immunization pro-gramme against hepatitis A in an area of interme-diate endemicity. J Hepatol 2001; 34:92-9.
25. Valenzuela MT, Jacobs RJ, Arteaga O, Navarrete MS, Meyerhoff AS, Innis BL. Cost-effectiveness of universal childhood hepatitis A vaccination in Chile. Vaccine 2005; 23:4110-9.
26. Quezada A, Baron-Papillon F, Coudeville L, Maggi L. Universal vaccination of children against hepa-titis A in Chile: a cost-effectiveness study. Rev Pan-am Salud Pública 2008; 23:303-12.
27. Lopez E, Debbag R, Coudeville L, Baron-Papillon F, Armoni J. The cost-effectiveness of universal vacci-nation of children against hepatitis A in Argentina: results of a dynamic health-economic analysis. J Gastroenterol 2007; 42:152-60.
28. Ellis A, Rüttimann RW, Jacobs RJ, Meyerhoff AS, Innis BL. Cost-effectiveness of childhood hepatitis A vaccination in Argentina: a second dose is war-ranted. Rev Panam Salud Pública 2007; 21:345-56. 29. Zhuang GH, Pan XJ, Wang XL. A cost-effectiveness
analysis of universal childhood hepatitis A vacci-nation in China. Vaccine 2008; 26:4608-16. 30. Armstrong GL, Bell BP. Hepatitis A virus infections
in the United States: model-based estimates and implications for childhood immunization. Pediat-rics 2002; 109:839-45.
31. Van Damme P, Banatvala J, Fay O, Iwarson S, Mc-Mahon B, Van Herck K, et al. Hepatitis A boost-er vaccination: is thboost-ere a need? Lancet 2003; 362:1065-71.
32. Van Damme P, Thoelen S, Cramm M, De Groote K, Safary A, Meheus A. Inactivated hepatitis A vaccine: reactogenicity, immunogenicity, and long-term antibody persistence. J Med Virol 1994; 44:446-51.
33. Wiedermann G, Ambrosch F, André FE, D’Hondt E, Delem A, Safary A. Persistence of vaccine-in-duced antibody to hepatitis A virus. Vaccine 1992; 10 Suppl 1:S129-31.
34. Jacobs RJ, Margolis HS, Coleman PJ. The cost-ef-fectiveness of adolescent hepatitis A vaccination in states with the highest disease rates. Arch Pe-diatr Adolesc Med 2000; 154:763-70.
35. Berge JJ, Drennan DP, Jacobs RJ, Jakins A, Meyer-hoff AS, Stubblefield W, et al. The cost of hepatitis A infections in American adolescents and adults in 1997. Hepatology 2000; 31:469-73.
36. Hauboldt R. Cost implications of human organ and tissue transplantation, an update. Seattle: Mil-liman & Robertson; 1999.
37. Laupacis A, Feeny D, Detsky AS, Tugwell PX. How attractive does a new technology have to be to warrant adoption and utilization? Tentative guide-lines for using clinical and economic evaluations. CMAJ 1992; 146:473-81.
38. Tengs TO, Adams ME, Pliskin JS, Safran DG, Siegel JE, Weinstein MC, et al. Five-hundred life-saving interventions and their cost-effectiveness. Risk Anal 1995; 15:369-90.
39. Koslap-Petraco MB, Shub M, Judelsohn R. Hepa-titis A: disease burden and current childhood vac-cination strategies in the United States. J Pediatr Health Care 2008; 22:3-11.
40. Barbieri M, Drummond M, Rutten F, Cook J, Glick HA, Lis J, et al. What do international pharmaco-economic guidelines say about pharmaco-economic data transferability? Value Health 2010; 13:1028-37. 41. Drummond MF, Iglesias CP, Cooper NJ.
42. Sculpher MJ, Pang FS, Manca A, Drummond MF, Golder S, Urdahl H, et al. Generalisability in eco-nomic evaluation studies in healthcare: a review and case studies. Health Technol Assess 2004; 8:iii-iv, 1-192.
43. Welte R, Feenstra T, Jager H, Leidl R. A decision chart for assessing and improving the transferabil-ity of economic evaluation results between coun-tries. Pharmacoeconomics 2004; 22:857-76.
44. Drummond M, Pang F. Transferability of economic evaluations results. In: Drummond M, McGuire A, editors. Economic evaluation in health care: merg-ing theory with practice. Oxford: Oxford University Press; 2001. p. 256-76.
Submitted on 16/May/2011