129 1. PhD. Pediatrician. Professor, Universidade Católica de Brasília (UCB),
Brasília, DF, Brazil.
2. Master’s Degree in Physical Education.
Manuscript received Oct 14 2003, accepted for publication Jan 21 2004. Abstract
Objective: To evaluate the agreement between the body mass index international standard and body fat for the diagnosis of overweight and obesity in schoolchildren.
Methods: 528 schoolchildren between 6 and 10 years of age, of both sexes, had their weight and height measured. They were then classified as normal, underweight, overweight or obese using the body fat index for age. Body fat was estimated based on the sum of triceps and subscapular, triceps and calf skinfold measurements and waist and hip circumference.
Results: Overweight and obesity were found in 21.2% of the girls and 18.8% of the boys. The average percentage of body fat in the normal children (17.7%) was statistically different from that of overweight (27%) and obese (29.4%) children (p < 0.02). The average waist and hip circumference also differed significantly between normal boys and girls (56.9 cm and 67.7 cm) and overweight children (65.9 cm and 77 cm) (p < 0.01). There was no significant difference between groups in terms of average waist to hip ratio. The percentage of body fat , waist and hip circumference were significantly correlated with body mass index (p < 0.01).
Conclusion: Body mass index for age was an adequate indicator of overweight and obesity in group studied, with a good agreement with body fat.
J Pediatr (Rio J). 2004;80(2):129-34: BMI, skinfold measurements, waist circumference, hip circumference, waist to hip ratio.
Diagnosis of overweight
and obesity in schoolchildren: utilization
of the body mass index international standard
Rodolfo Giugliano1, Ana L. P. Melo2
Copyright © 2004 by Sociedade Brasileira de Pediatria
O
RIGINALA
RTICLEIntroduction
Obesity is increasing at such an alarming rate that it can truly be considered a worldwide epidemic, affecting all age groups and especially children.1 Comparing national surveys from the USA performed in 1965 and 1980 shows that obesity among children from 6 to 11 years increased by 67% among boys and 41% in girls. Currently 25% of American children are considered obese. The majority of them come from social classes with lower purchasing power.2 In Brazil, the children most affected by obesity still come from more privileged social classes, although there has been a recent tendency for this profile to change.3,4 The National Institute of
Food and Nutrition INAN (National Institute of Food and Nutrition) indicates that childhood obesity in Brazil
affects 16% of children.5
One of the problems when diagnosing obesity and overweight, with young populations, is the disagreement about the cut-offs or limits used to identify them. According to Dietz & Bellizze9 overweight, during childhood and adolescence, is characterized by a body mass index for age (BMI/age) above the 85th percentile and obesity by a BMI/age above the 95th percentile, based on the National Health and Nutrition Examination Survey (NHANES II-III) standards. Other authors say it is possible to adopt absolute BMI limits for specific age groups, during the growth period, without considerably compromising diagnostic specificity or sensitivity.10 The adoption of regional BMI standards has also been proposed.11
In practical terms, from the perspective of health services, it is desirable that diagnostic criteria be simple, low cost, reproducible and reliable and offer elevated sensitivity and specificity, thus reducing false positive and negative diagnoses. Recently, Cole et al.,12 based on a pool of studies of BMI profiles by age in a number of different countries, including Brazil, proposed limits for overweight and obesity to be applied to the 2 to 20 age group internationally.
The present study proposes to test the degree of agreement between this classification with the adiposity of pre-adolescent schoolchildren, between 6 and 10 years old. In order to achieve this, the limits proposed by Cole et al.12 were compared with: a) adiposity estimated from triceps, subscapular and calf skin folds,13 considered good adiposity indicators for children;14,15 b) waist and hip circumference and waist/hip ratio, as indicators of visceral and central adiposity.16
Methods
The study was performed in Brasilia (DF), between 2000 and 2001, involving pre-adolescent children, aged between 6 and 10, of both sexes, studying at the Centro Educacional da Católica de Brasilia (CECB). This private educational establishment is based on campus at the Universidade Católica de Brasilia (UCB) and serves middle and upper-middle class students. The study was approved by the UCB Ethics Committee and authorized by the students parents after receiving an explanatory circular. All students whose parents consented were included.
The children were examined at the Nutritional Assessment Laboratory (NAL) at the Universidade Católica de Brasilia, as part of the PREVINE project (Nutritional Vigilance of Schoolchildren Project), developed by the university. Annual measurements were taken of weight and height and BMI was calculated for each of the CECB students and then recorded on printed cards that were kept by their families. The project aimed to provide guidance to students and their families and early diagnosis of overweight, obesity and underweight. The current number of students at the CECB is around 2,500 .
The children were assessed according to weight, height, triceps and subscapular skin folds, and waist and hips circumferences according to standards proposed by Lohman et. al.17 Weighing was performed with the children barefoot, wearing shorts and t-shirt on digital scales (Indústrias Fillizola S. A. Brazil) with a range of 0-150 kg and accuracy of 100 g. Height was measured with the children standing erect and barefoot against a flat, vertical surface, arms, arms hanging freely with palms of hands on thighs, heels together with the feet forming an angle of 60º, knees touching and with the head inclined along the Frankfurt plane, while breathing in deeply. Measurements were taken three times with a stadiometer (Sanny Kirchner & Wilhelm, Medizintechnik, Germany) fixed to the wall and the mean calculated. Capacity was 2 m and precision 0.1 cm. Skin folds were measured using an adipometer (Lange Beta Technology Incorporated, Cambridge, Maryland) precise to 0.5 mm. Both triceps and subscapular folds were measured with the children erect with arms hanging naturally. Folds were measured on the right-hand side and were also taken in triplicate and averaged. The triceps fold measurement was taken at the midpoint of the arm, between the acromion of the scapula and the olecranon of the ulna. The subscapular fold was measured at a point located immediately below the inferior angle of the right scapula. The skin fold from the calf was measured at the point of greatest circumference. The waist measurement was taken with a metallic tape measure at the level of the umbilicus while the child breathed out and hip measurements were taken at the point of greatest circumference at the gluteus area.
Children were defined as being well-nourished, overweight or obese according to BMI/age, using limits proposed by Cole et al.12 Children below the 5th percentile for BMI/age were classed as being underweight.18
Body fat percentage (% BF) was estimated from the sum of triceps, subscapular, and calf folds by applying the predictive equations proposed by Slaughter et. al.,13 which take into account sexual and ethnic variations. These measurements have been used by a number of different authors as indicators of peripheral body fat in children.14 Waist measurements are considered good indicators of obesity and visceral fat in both adults and children.14,19,20
Descriptive statistics employed were averages (x), standard deviations (SD) and frequency percentages (%). Correlation between variables was tested using Pearsons linear correlation coefficient. The averages of variables under analysis were compared using the Student t test for independent samples. Differences
were considered significant when p < 0.05. Data was analyzed using SPSS 10.0 (SPSS Inc).
Results
This corresponds to around 90% of the students at the school within the chosen age group. The remainder were not included either because they were not present the day data was collected or because their parents had not consented to their participation in the research. Table 1 details the percentages of well-nourished, underweight, overweight and obese schoolchildren. Taking overweight and obese percentages together includes 18.8% of the boys and 21.2% of the girls.
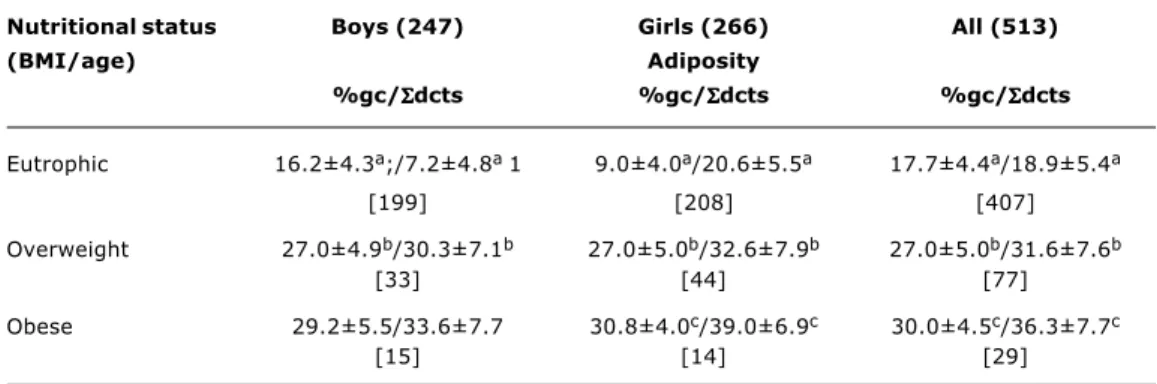
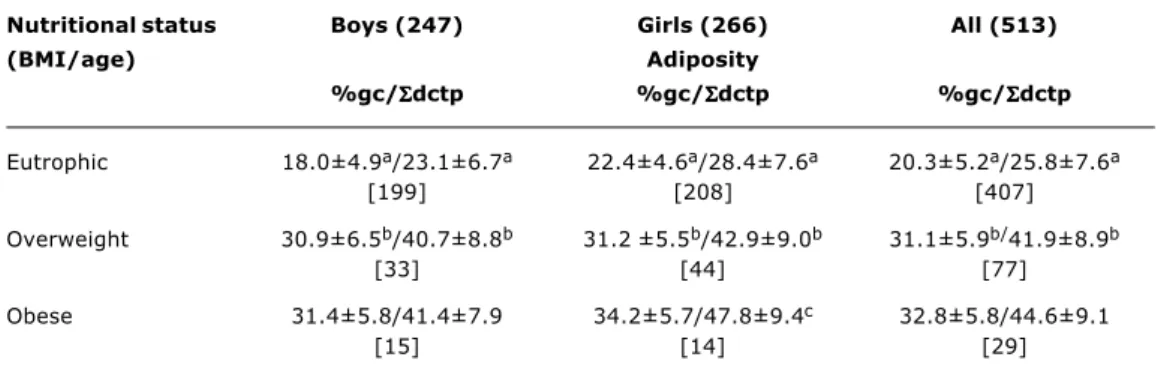
Tables 2 and 3 contain averages for body fat percentage, from the sum of triceps and subscapular skin fold measurements and from the sum of triceps and calf results for well-nourished, overweight and obese children. Underweight children were not included in the analysis due to the low number encountered in the sample. As can be observed, there are significant differences between normal children and overweight ones and again between normal children and obese ones. The exception is between obese girls and overweight girls despite a tendency towards higher values among those who were obese.
Table 4 lists the results of the waist measurements according to BMI for age. As can be observed, they are significantly larger for overweight and obese children compared with the normal children. The same tendency was observed with hip measurements. The hip/waist ratio, on the other hand, presented no differences comparing well-nourished children with overweight and obese ones.
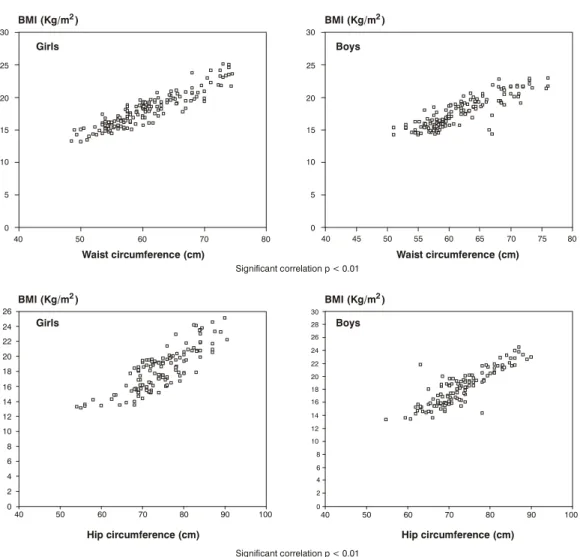
Figures 1 and 2 illustrate the significant correlations between BMI and % of body fat for boys (p < 0.02; r = +0.843) and girls (p < 0.02; r = +0.774), boys waist measurements (p < 0.02; r = +0.884) and girls waists (p < 0.02; r = +0.892) and boys hips (p < 0.02; r =+0.842; and girls hips (p < 0,02; r =+0,836).
Discussion
The frequency with which overweight and obese schoolchildren were encountered is elevated. This is similar to results observed in the Southeast of Brasil21 confirming the severity of this problem among our schoolchildren.
The use of BMI for age according to limits proposed by Cole et al.12 had a good level of agreement with the increasing adiposity among the groups. This result further corroborates observations made by other authors of the good level of correlation between adiposity and BMI in children.22
Both waist and hip measurements had significantly differences between overweight and obese children in comparison with normal children. This was in contrast with the hip/waist ratio, which was similar across the groups. This observation confirms the findings of other authors, which show that hip/waist ratio is not a good indicator of visceral obesity during the pre-pubescent period.23
Table 1 - Frequency of underweight, overweight and obese schoolchildren from 6 to 10 years old according to BMI/age12,18 - Brasília, DF
Nutritional status Boys (255) Girls (273) All (528)
(BMI/age) n % n % n %
Eutrophic 199 78.0 208 76.2 407 77.1
Underweight 8 3.1 7 2.6 15 2.8
Overweight 33 12.9 44 16.1 77 14.6
Obesity 15 5.9 14 5.1 29 5.5
Values between parentheses refer to the number of schoolchildren.
Table 2 - Percentage of body fat (%gc) and sum of triceps and subscapular skin fold measurements (Σdcts)
of schoolchildren from 6 to 10 years old, evaluated according to BMI/age - Brasília, DF
Nutritional status Boys (247) Girls (266) All (513)
(BMI/age) Adiposity
%gc/ΣΣΣΣΣdcts %gc/ΣΣΣΣΣdcts %gc/ΣΣΣΣΣdcts
Eutrophic 16.2±4.3a;/7.2±4.8a 1 9.0±4.0a/20.6±5.5a 17.7±4.4a/18.9±5.4a
[199] [208] [407]
Overweight 27.0±4.9b/30.3±7.1b 27.0±5.0b/32.6±7.9b 27.0±5.0b/31.6±7.6b
[33] [44] [77]
Obese 29.2±5.5/33.6±7.7 30.8±4.0c/39.0±6.9c 30.0±4.5c/36.3±7.7c
[15] [14] [29]
Significant correlations were found between BMI and body fat and between BMI and waist and hip measurements. These findings are in complete agreement with other observations in published literature that refer to body fat, however there has been little written on waist and hip measurements.24
The validity of BMI as an indication of adiposity in children has been demonstrated in a number of different studies22,25 however, overweight and obesity diagnosis limits and cut-offs for international application have been challenged by some because of racial variations.26,27 In our environment, taking into account the multiracial
Table 3 - Percentage of body fat (%gc) and sum of triceps and calf skin folds ( Σdctp) of schoolchildren from 6 to 10 years old, evaluated according to BMI/age - Brasília, DF, Brazil
Significant difference between a, b, c (p < 0.02). Values between brackets refer to the number of schoolchildren.
Nutritional status Boys (247) Girls (266) All (513)
(BMI/age) Adiposity
%gc/ΣΣΣΣΣdctp %gc/ΣΣΣΣΣdctp %gc/ΣΣΣΣΣdctp
Eutrophic 18.0±4.9a/23.1±6.7a 22.4±4.6a/28.4±7.6a 20.3±5.2a/25.8±7.6a
[199] [208] [407]
Overweight 30.9±6.5b/40.7±8.8b 31.2 ±5.5b/42.9±9.0b 31.1±5.9b/41.9±8.9b
[33] [44] [77]
Obese 31.4±5.8/41.4±7.9 34.2±5.7/47.8±9.4c 32.8±5.8/44.6±9.1
[15] [14] [29]
nature of the Brazilian people, the proposed limits appear to have a good level of agreement with adiposity at least in schoolchildren. The current study, despite using a doubly-indirect estimation method for body fat, the values returned exhibited a significant level of agreement with the classifications proposed that are based on BMI for age. The results of this study show that it is appropriate to choose BMI/age, based on the international standards, as a diagnostic indicator for overweight and obese schoolchildren. It exhibited agreement with excess body adiposity as calculated from skin fold measurements and with central and visceral fat indirectly estimated from
Table 4 - Average values of waist and hip circumferences (cm) and waist-hip ratio of schoolchildren from 6 to 10 years old, evaluated according to BMI/age - Brasília, DF, Brazil
Significant difference between a, b, c (p < 0.02).
Nutritional status Boys (247) Girls (266) General (513) (BMI/age)
Waist circumference
n x±sd n x±sd n x±sd
Eutrophic 199 57.4±4.1a 208 56.3±4.0a 407 56.9±4.1a
Overweight 33 67.8±4.4b 44 64.2±5.4b 77 65.9±5.3b
Obese 15 68.7±6.6 14 68.7±5.7c 29 68.3±6.3c
Hip circumference
n x±sd n x±sd n x±sd
Eutrophic 199 66.5±5.2a 208 68.8±5.6a 407 67.7±5.6a
Overweight 33 77.1±6.2b 44 76.9±7.3b 77 77.0±6.8b
Obese 15 79.7±6.6 14 79.7±7.5 29 79.3±7.1
Wait-hip ratio
n x±sd n x±sd n x±sd
Eutrophic 199 0.87±0.02 208 0.82±0.05 407 0.84±0.05
Overweight 33 0.88±0.06 44 0.84±0.04 77 0.86±0.05
Figure 1 - Dispersion graph between body mass index and percentage of body fat in schoolchildren from 6 to 10 years old
Significant correlation p < 0.01
% of body fat
BMI (kg/m2) BMI (kg/m2)
% of body fat 40
30 20
10 0
30
25
20
15
10 10
5 5
0 0
40 35 30 25 20 15 10 5 0
r = +0.774 Girls
r = +0.843
30
25
20
15
Boys
Figure 2 - Dispersion graph between body mass index and waist and hip circumferences of schoolchildren
from 6 to 10 years old
Significant correlation p < 0.01
Significant correlation p < 0.01
Waist circumference (cm)
Hip circumference (cm)
Waist circumference (cm)
Hip circumference (cm) 80
70 60
50 40
30 30
25 25
20 20
15 15
10 10
5 5
0 0
80 75 70 65 60 55 50 45 40
100 100
90 90
80 80
70 70
60 60
50 50
40 40
26 24 22 20 18 16 14 12 10 8 6 4 2 0
30 28 26 24 22 20 18 16 14 12 10 8 6 4 2 0
Girls
Girls
Boys
Boys BMI (Kg/m )
BMI (Kg/m )
BMI (Kg/m )
BMI (Kg/m )
2
2
2
waist and hip measurements. The adoption of uniform criteria that are simple to implement, as is the case with BMI/age would facilitate comparison of results from different regions and countries and also aid assessment of the impact of preventative and curative measures. Once the fact that the study was limited in terms of age group and ethnicity and also that the use of adiposity calculation methods that were not according to reference standards are taken into account it becomes necessary to conduct further studies in order that this anthropometric indicator may be adopted systematically in our country
Acknowledgements
Thanks to Vânia Pereira Nunes for her dedication and her technical work. To Prof. Eduardo da Silva Sena, coordinator of the Physical Education and Sports Section of the Centro Educacional da Católica de Brasilia, for support and encouragement.
Corresponding author: Rodolfo Giugliano
Universidade Católica de Brasília - UCB Laboratório de Avaliação Nutricional - LAN Prédio São Gaspar Bertoni [bloco M] sala 121 QS 07 Lote 1 Águas Claras
CEP 71966 700 - Taguatinga, DF, Brazil
Tel.: +55 (61) 356.9338 Fax: +55 (61) 356.3010
References
1. World Health Organization. Obesity. Preventing and managing the global epidemic: Report of WHO consultation group on obesity. Geneva: WHO; 1997.
2. Dietz WH. Prevention of childhood obesity. Pediatr Clin North Am. 1986;33:823-33.
3. Cyrino ES, Nardo N. Subsídios para prevenção e controle da obesidade. Rev Bras Ativ Física e Saúde. 1996;1:15-25. 4. Monteiro CA, Conde WL. Tendência secular da obesidade segundo
estratos sociais: Nordeste e Sudeste do Brasil. Arq Bras Endocrinol Metab. 1999;43:186-94.
5. Brasil. Ministério da Saúde, Instituto Nacional de Alimentação e Nutrição. Pesquisa Nacional sobre Saúde e Nutrição. Perfil de crescimento da população brasileira de 0-25 anos. Brasília: INAN; 1990.
6. Fisberg M. Obesidade na infância e adolescência. São Paulo (SP): Fundação BYK; 1995.
7. Davies PSW, Preece MA. Body composition in children: methods of assessment. In: Tanner JM, Preece MA, editors. The physiology of human growth. Cambridge: Cambridge University Press; 1989. p. 95-107.
8. Malina RM, Bouchard C. Growth maturation and physical activity. Champagnat (Il): Human Kinectics Books; 1991.
9. Dietz WH, Bellizzi MC. Introduction: the use of body mass index to assess obesity in children. Am J Clin Nutr. 1999;70(1):1235-55. 10. Monteiro POA, Victora CG, Barros FC, Tomasi E. Diagnóstico de sobrepeso em adolescentes: estudo de diferentes critérios para o índice de massa corporal. Rev Saude Publica. 1999;34:506-13. 11. Anjos LA, Veiga, GV, Castro IRR. Distribuição dos valores do índice de massa corporal da população brasileira até 20 anos. Rev Panamer Saude Publica. 1998;3:42-50.
12. Cole TJ, Bellizzi MC, Flegal KM, Dietz WH. Establishing a standard definition for child overweight and obesity worldwide: international survey. BMJ. 2000;320:1240-3.
13. Slaughter MH, Lohman TG, Boileau RA, Horswill CA, Stillman RJ, VanLoan M, et al. Influence of maturation on relationship of skinfold to body density: a cross-sectional study. Human Biology. 1988;56:681-9.
14. Sigulem DM, Devincenzi MV, Lessa AC. Diagnóstico do estado nutricional da criança e do adolescente. J Pediatr (Rio J). 2000;76 Supl 3:275-84.
15. Heyward VH, Stolarczyk LM. Applied body composition assessment. Champagnat (Il): Human Kinectics Books; 1996. 16. McCarthy HD, Ellis SM, Cole TJ. Central overweight and obesity in British youth aged 11-16 years: cross sectional survey of waist circumference. BMJ. 2003;326:624-6.
17. Lohman TG, Roche AFE, Martorell R. Anthropometric standardization reference manual assessment. Champagnat (Il): Human Kinectics Books; 1988.
18. Hammer LD, Kraemer LD, Wilson DM, Ritter PL, Dornbusch SM. Standardized percentile curves of body-mass index for children and adolescents. Am J Dis Child. 1991;145:259-63.
19. Maffeis C, Grezzani A, Pietrobelli A, Provera S, Tato LL. Does waist circumference predict fat gain in children? Int J Obes Relat Metab Disord. 2001;25:978-83.
20. Sarria A, Moreno LA, Garcia-Llop LA, Fleta J, Morellon MP, Bueno M. Body mass index, triceps skinfold and waist circumference in screening for adiposity in male children and adolescents. Acta Paediatr. 2001;90:387-92.
21. Neutzling MB, Taddei JA, Rodrigues, EM, Sigulem DM. Overweight and obesity in Brazilian adolescents. Int J Obes Relat Metab Disord. 2000;24:869-74.
22. Pietrobelli A, Faith MS, Allison DB, Gallagher D, Chiumello G, Heymsfield SB. Body mass index as a measure of adiposity among children and adolescents: a validation study. J Pediatr. 1998;132:204-10.
23. World Health Organization. Physical status: the use and interpretation of anthropometry. Technical Report Series 854. Geneva: WHO; 1995.
24. Higgins PB, Gower BA, Hunter GR, Goran ML. Defining health-related obesity in prepubertal children. Obes Res. 2001;9:233-40. 25. Mei Z, Grummer-Strawn LM, Pietrobelli A, Goulding A, Goran MI, Dietz WH. Validity of body mass index compared with other body-composition screening indexes for the assessment of body fatness in children and adolescent. Am J Clin Nutr. 2002;75:978-85.
26. Deurenberg P, Deurenberg-Yap M. Differences in body composition assumptions across ethnic groups: practical consequences. Curr Opin Clin Nutr Metab Care. 2001;4:377-83. 27. Choo V. WHO reassesses appropriate body-mass index for Asian