INTRODUCTION
Almost half century of research strongly sup-ports that fluoride (F) exerts its effect on caries and on dental fluorosis by distinct mechanisms. Thus, while the effect on caries is local, based on maintenance of oral F concentration [reviewed by Cury and Tenuta (1)
]
, the effect on fluorosis is systemic, based on blood F concentration (2), which is influenced by innumerous metabolic variables.For instance, it is recognized that blood F con-centration is not controlled by homeostasis (3), and thus the pattern of F use and how it affects plasma F levels may be of importance (4). Furthermore, considering that enamel formation is a continuous process and that the clinically visualized defects are dependent on the thick-ness of enamel formed under exposure to a given F dose (5), it is expected that short peaks of plasma F
concentra-Fluorosis in Rats Exposed to Oscillating
Chronic Fluoride Doses
Danilo Bonadia CATANI1 Livia Maria Andaló TENUTA1 Fernanda Alcântara ANDALÓ2
Jaime Aparecido CURY1
1Piracicaba Dental School, University of Campinas, Piracicaba, SP, Brazil 2Institute of Computing, University of Campinas, Campinas, SP, Brazil
Considering that blood fluoride concentration varies according to fluoride exposure and that dental fluorosis is related to the amount of enamel formed under a given fluoride dose, the present study investigated whether the fluorosis produced by an oscillating chronic fluoride dose would be similar to that caused by exposure to a constant dose, representing the mean of the oscillation during a given time. Rats received during 78 days water with fluoride concentrations of 0, 12.5, 25 or 37.5 µg F/mL, or oscillating concentrations of 12.5 and 37.5 µg F/mL every 72 h (mean exposure=25 µg F/mL). The concentrations of fluoride in the plasma, femur and inci-sors of the rats were determined at the end of the experimental period. Also, the enamel dental fluorosis index was determined in the incisors using a quantitative method developed by our research group named Dental Fluorosis by Image Analysis (DFIA). Fluoride concentrations in plasma, femur and teeth, and DFIA increased linearly for constant fluoride concentrations in water (p<0.0001, r values=0.87-0.98). The results of the oscillating group and the groups receiving 25 µg F/mL did not differ significantly (p>0.05). The findings of this study suggest that in animals chronically exposed to symmetrically oscillating fluoride doses, the resulting dental fluorosis reflects the metabolic effect of the mean of the oscillating doses.
Key Words: fluoride, fluorosis, blood, bone, rats.
tions due to an acute dose would have less importance than the continuous exposure to chronic lower F doses on fluorosis development (4,6). A previous survey in a city that lacks a well controlled system of community water fluoridation showed that fluctuations of water F concentration above the optimal concentration (0.7 ppm F) did not increase fluorosis prevalence (7). In fact, in the city where water F concentration oscillated above (higher than 0.8 ppm F) and below (lower than 0.6 ppm F) the optimum, the fluorosis risk was 8.3 times lower than in the another city with constant optimum water F concentration (7).
This epidemiological observation raised the ques-tion on how fluctuaques-tions in F exposure chronically would affect enamel fluorosis. Thus, it was hypothesized that the systemic effect of F on fluorosis would depend on both the mean effect of each oscillating F dose and the average time of exposure of ameloblasts to them during
enamel maturation, and a first experimental study was conducted in rats to evaluate the effect of symmetrical oscillations in water F concentration on metabolic vari-ables and fluorosis development.
MATERIAL AND METHODS
Experimental Design
This blind study was approved by the Animal Ethics Committee of the State University of Campinas (Protocol #1579-1). Twenty Wistar females rats aged 35 days were randomly divided into 5 groups of 4 animals each. Four groups received ad libitum water containing 0 (control), 12.5, 25 or 37.5 µg F/mL during 78 days, which is sufficient time to allow the full renewal of rat incisors (8). During the same 78 days, the 5th group (oscillating) received water containing 12.5 or 37.5 µg F/ mL (mean of 25 µg F/mL) alternately every 72 h. The F solutions were prepared with NaF and the concentrations were checked. The rats had free access to pellet chow (Labina; Purina, Paulínia, SP, Brazil; total F concentra-tion of 17 µg F/g). The amount of water ingested by each group was assessed daily and animals were weighed at the beginning and the end of the experiment.
On the 79th day, the rats were anesthetized and blood was collected by disruption of the brachial plexus using heparin as an anticoagulant. One femur, the mandible bone and the lower incisors of the animals were removed and coded for the analysis by a blinded examiner. At the time of sacrifice, animals of the oscil-lating group had been drinking water at 37.5 µg F/mL for the last 24 h.
Plasma Fluoride Determination
Plasma samples were obtained by centrifugation at 2,000 g for 10 min. F concentration in plasma was determined using an inverted F-specific electrode (Orion Research model 94-09; Orion Research Incorporated, Cambridge, MA, USA) and a micro-reference electrode, under microscope, after buffering with TISAB III (9).
Fluoride Determination in the Femur (Whole and Surface), Mandible (Alveolar Bone) and Incisors
The femur was used for F determination in the whole bone and bone surface (10). The femur was dried
for 24 h at 60°C, sectioned transversally to obtain 2 slices measuring approximately 5 mm from the diaphysis region. For whole F determination, one slice was pulver-ized, the powder was sieved to obtain particles of 140 µm to 1,000 µm and left at 60°C for additional 24 h. Ten milligrams (±0.01 mg) were weighed and transferred to plastic test tubes containing 1.0 mL of 0.5 M HCl. After 1 h, at room temperature and under agitation, 1.0 mL of TISAB II (1.0 M acetate buffer, 1.0 M NaCl, 0.4% CDTA, pH 5.0) containing 0.5 M NaOH was added.
To determine F concentration on the bone surface, the other femur slice was sealed with acid-resistant nail varnish leaving a circular hole (2.0 mm diameter) exposed (10). Three layers of bone were sequentially removed by immersing each slice in tubes containing 0.25 mL of 0.5 M HCl for 15, 30 and 60 s, under constant agitation. The extracts were neutralized and buffered with equal volumes of TISAB II, as described before.
For F determination on the surface alveolar bone where there was an incisor tooth, one hemi-mandible from each animal was dried for 24 h at 60ºC. The lin-gual plate of the alveolar socket was removed, thereby exposing the rest of the alveolar socket. All other regions were isolated with acid-resistant nail varnish. Using an automatic pipette, 0.1 mL of 0.5 M HCl was applied to the alveolar socket and the acid was flushed for 15 s by aspiration and injection. The extract was transferred to a test tube and buffered as described before.
F concentration in the mandible incisors was de-termined at 3 transversal slices measuring approximately 1 cm from the apical, middle and incisal regions. These fragments were separately pulverized and the powder was dried at 60°C for 24 h. Five milligrams (±0.01 mg) were weighed and transferred to plastic test tubes, to which 1.0 mL of 0.5 M HCl was added for F extraction as described for whole femur F determination.
Dental Fluorosis Assessment
Due to the limitations of hardness and transverse microradiography to quantify dental fluorosis in rats ex-posed to low F concentrations (4,11), our research group has developed a quantitative method of image analysis named Dental Fluorosis by Image Analysis (DFIA), based on the known effect of F changing the iron pigmentation of the rat incisor enamel surface, which was quantified. In order to acquire the input images, one mandible incisor from each animal was fixed with wax on a glass slide (Fig. 1) with the enamel surface of incisal third of the crown upward parallel to a macro lens (Medical Nikkor; Nikon, Tokyo, Japan) attached to a vertical stand at a fixed distance of 7 cm above the teeth. An image was acquired with the digital camera (Nikon D70; Nikon) using standardized light intensity and focus. A central area of 690 x 170 pixels was cropped from the digital image and converted to gray-scale. The gray-scale cropped image is used as the input image for the DFIA method. The input image is segmented in order to isolate the darker bands from the lighter bands (Fig. 1). In Figure 1, the black area corresponds to the original orange bands and the white area corresponds
to the original white bands. For each segmented area, the method computes the average of the pixel intensities in the input image. The DFIA index is obtained by the difference between IH (the average of the higher inten-sity pixel values, originally the white bands) and IL (the average of the lower intensity pixel values, originally the orange bands). Higher values of DFIA index should correspond to more severe fluorosis.
Statistical Analysis
Linear regression analysis was used to correlate the administered constant F concentrations in water (independent variable) with F concentration in plasma, bones and incisor, and dental fluorosis found (SPSS software version 12.0; SPSS Inc., Chicago, IL, USA). Using the linear equations, the estimated mean F con-centrations to which the oscillating group (12.5/37.5 µg F/mL) would have been subjected during the all experiment was calculated. Differences among the groups were assessed by ANOVA and Tukey's post-hoc test using SAS software version 8.01 (SAS Institute Inc., Cary, NC, USA). Data that did not fit the assumptions of normal distribution of errors and equality of variances were transformed (12). All analyses were performed at 5% significance level.
RESULTS
No statistically significant difference (p>0.05) in water intake (daily) and rat weights (either initial or final) was observed among groups.
A statistically significant dose-response effect (p<0.0001) was found between the F concentrations in the drinking water given constantly to the rats during 78 days and the dependent variables F concentrations in plasma, bone (whole, surface and alveolar) and incisor, and the fluorosis index DFIA, with correlations for the linear regression models between 0.87 and 0.98 (Table 1).
The images of rats lower incisors of the control group (0 µg F/mL) show that normal enamel displays an even orange coloration resulting from iron pigmentation, while groups exposed to higher F concentrations in the
drinking water (12.5, 25 and 37.5 μg F/mL) show a suc
-cession of white and pigmented bands, with an increase in loss of iron pigmentation according to the increase in the F concentration used (Fig. 2).
The mean F concentration to which the oscillating Figure 1. Schematic representation of the DFIA index for dental
group (12.5/37.5 µg F/mL) would have been subjected during the experiment was calculated for each dependent variable using the linear equations and varied from 24.6
to 31.8 µg F/mL (Table 1).
The group receiving oscillating doses did not differ significantly (p>0.05) from the group receiving 25 µg F/mL constantly (Table 2).
DISCUSSION
Rats have been extensively used as a model to study fluorosis because plasma F concentrations caus-ing enamel fluorosis in these animals and in humans are similar (4,6), as well as the structure and formation of the enamel (13).
In the present study, to estimate the effect on dental fluorosis of oscillating F doses to which rats were subjected chronically by alternately drinking water containing 12.5 and 37.5 µg F/mL, the dose-response effect of drinking constantly distilled water (control) or water containing 12.5, 25.0 or 37.5 µg F/mL was determined on some biological parameters related to F metabolism and fluorosis.
A significant increase in the value of all variables analyzed was observed according to the increase in F concentration in the water for the constant groups (Table 1), in agreement with other studies with rats (14). Also, the effect of increasing levels of F exposure was satisfac-tory reflected (r=0.88) in increasing fluorosis severity
Table 1. Correlation (r) between fluoride concentration in rats plasma, bone and incisor, and dental fluorosis by DFIA index (y) as a function of constant fluoride concentration in water (x), linear equation and estimated F concentration in the water given to the rats of the oscillating group (12.5/37.5 µg F/mL).
Y x r* Equation Estimated [F] in water for the oscillating group
Plasma [F] in water 0.872 log y = 0.381+0.013x 28.7 ± 4.2
Whole femur [F] in water 0.981 y = 250.960+33.771x 24.6 ± 3.2 Femur surface (10.0 µm) [F] in water 0.917 y = 764.653+30.427x 31.8 ± 3.7 Femur surface (24.7 µm) [F] in water 0.941 y = 535.008+37.751x 31.8 ± 4.2
Femur surface (46.2 µm) [F] in water 0.948 y = 458.152+31.762x 28.7 ± 5.9 Alveolar bone surface [F] in water 0.973 y = 461.328+34.286x 25.7 ± 3.9 Apical (tooth) [F] in water 0.976 y = 99.350+16.580x 26.0 ± 3.8
Middle (tooth) [F] in water 0.979 y = 96.388+15.685x 26.0 ± 3.6 Incisal (tooth) [F] in water 0.984 y = 89.387+14.401x 24.9 ± 2.7 Dental fluorosis [F] in water 0.881 log y = 0.021 + 0.017x 24.8 ± 6.4 * p<0.0001 for all variables
quantified by the DFIA index method developed for this research.
The estimated water F concentration to which the rats were subjected by the oscillating concentrations was very close to 25 µg F/mL for all metabolic variables analyzed (Table 1), which is the expected mathematical mean of drinking water containing 12.5 and 37.5 µg F/ mL given at symmetrically alternating periods. Indeed, the group subjected to the oscillating dose did not differ significantly from the group drinking constantly water containing 25 µg F/mL in any biological variable ana-lyzed and on fluorosis development (Table 2).
These findings are supported by the relationship between F concentration in blood and bone. It is known that there is no homeostatic mechanism to maintain blood F concentration (3), and that F will either be taken up from blood by bone or, when the F exposure is interrupted, the concentration in the blood could be maintained for some days due to the F coming from the exchangeable bone sub-compartment (15), but later will decrease (14). Thus, F accumulated in the bone could contribute to increase fluorosis by sustaining, for a certain period of time, blood F concentration systemically or locally in fluids adjacent to maturat-ing enamel.
It has been hypothesized that after an acute F
dose, the gradual release of F from the adjacent bone could be sufficient to cause enamel fluorosis (16) and the similar F concentration on the surface of alveolar bone for the oscillating and 25 µg F/mL groups (Table 2) show some evidence favoring this hypothesis, even for chronic dose. Accordingly, F concentration in the femur and other long bones would contribute to a steady sate plasma F concentration (14) and the findings showed that the oscillating and the 25 µg F/ mL groups did not differ concerning femur and plasma F concentrations (Table 2). Therefore, the same F concentrations in incisors of oscillating and 25 µg F/mL groups (Table 2) could be explained by a local and systemic effect.
Moreover, the similar fluorosis observed for the oscillating and the constant 25 µg F/mL groups may also be explained by the timing of enamel formation under this metabolic condition. The main effect of chronic low F dose occurs during enamel maturation (17) and this phase takes approximately 10.5 days in rats (18). Thus, enamel under maturation during a given period would partly be exposed to both the oscillating concentrations. As rat lower incisors are totally renewed in approximately 60 days, the clinical outcome on enamel would reflect the mean effect of the oscillating F concentrations given each 3 days during the 78 days
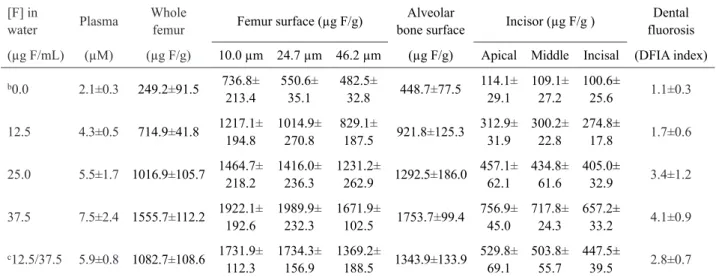
Table 2. Mean ± SD (n=4) fluoride concentrations in rats plasma, bone and incisor, and dental fluorosis index (DFIA) as a function of fluoride concentration in watera.
[F] in
water Plasma
Whole
femur Femur surface (µg F/g)
Alveolar
bone surface Incisor (µg F/g )
Dental fluorosis
(µg F/mL) (µM) (µg F/g) 10.0 µm 24.7 µm 46.2 µm (µg F/g) Apical Middle Incisal (DFIA index)
b0.0 2.1±0.3 249.2±91.5 736.8±
213.4
550.6±
35.1
482.5±
32.8 448.7±77.5
114.1± 29.1 109.1± 27.2 100.6± 25.6 1.1±0.3
12.5 4.3±0.5 714.9±41.8 1217.1± 194.8
1014.9±
270.8
829.1±
187.5 921.8±125.3
312.9± 31.9 300.2± 22.8 274.8± 17.8 1.7±0.6
25.0 5.5±1.7 1016.9±105.7 1464.7± 218.2
1416.0±
236.3
1231.2±
262.9 1292.5±186.0 457.1± 62.1 434.8± 61.6 405.0± 32.9 3.4±1.2
37.5 7.5±2.4 1555.7±112.2 1922.1± 192.6
1989.9±
232.3
1671.9±
102.5 1753.7±99.4
756.9± 45.0 717.8± 24.3 657.2± 33.2 4.1±0.9
c12.5/37.5 5.9±0.8 1082.7±108.6 1731.9±
112.3
1734.3±
156.9
1369.2±
188.5 1343.9±133.9 529.8± 69.1 503.8± 55.7 447.5± 39.5 2.8±0.7
aIn order to fit the assumptions for this test, data of plasma fluoride and dental fluorosis were log-transformed. bThis group differed
statistically from all groups for all variables (p<0.05). cThis group did not differ statistically from group received 25 µg F/mL for all
of the experiment. Indeed, the same effect on fluorosis by oscillating group compared with the 25 µg F/mL is supported by F concentration in the incisor, which was similar for both groups (Table 2).
The present study gives support to the epidemio-logical observation that short fluctuations in F concentra-tion in the water above optimal do not necessarily result in a higher fluorosis risk (7). This could be explained by the small thickness of enamel formed during each period of exposure to a given dose, suggesting that the mean exposure to F is the one that adequately reflects the resulting enamel fluorosis. The lower fluorosis risk found in a city with oscillating water F concentrations could thus be explained by longer periods in which the F content in water was kept below the optimal value, resulting in a lower average F dose when compared to a city in which water concentration was kept within the optimal range.
In summary, the findings of this study suggest that the biological effect of F on animals chronically exposed to symmetrical oscillating F doses reflect the effect of the mean of the oscillating doses. However, limitations on the extrapolation of the present results should be taken into account considering the model used and the necessity to conduct another study to evaluate the effect of oscillating F doses during asymmetrical periods of exposure, which is under investigation in our research lab.
RESUMO
Considerando que a concentração de fluoreto no sangue varia de acordo com a exposição ao fluoreto, e que a fluorose dental está relacionada com a quantidade de esmalte formado sob determinada dose de fluoreto, este estudo avaliou se a fluorose resultante da exposição a doses oscilantes de fluoreto seria semelhante àquela causada pela exposição a uma dose constante, representativa da média das oscilações durante um determinado tempo. Durante 78 dias, ratos receberam água com concentrações constantes de fluo-reto de 0; 12,5; 25 ou 37,5 µg F/mL, ou concentrações oscilantes de 12,5 e 37,5 µg F/mL alternados a cada 72 h (média de exposição = 25 µg F/mL). Concentrações de fluoreto no plasma, fêmur e dentes incisivos dos ratos foram determinadas após o período experimental. O índice de fluorose, observado nos incisivos dos ratos, foi quanti-ficado usando um método de análise de imagem desenvolvido para essa pesquisa, denominado de índice de fluorose por análise de imagem (DFIA, em Inglês). A concentração de fluoreto no plasma, fêmur e incisivo dos ratos, assim como o DFIA, aumentaram de forma linear para as concentrações constantes de fluoreto na água (p<0,0001, r=0,87-0,98). Não houve diferença significativa entre o grupo que recebeu doses oscilantes e o grupo que recebeu 25 µg F/mL (p>0,05). Os resultados sugerem a fluorose dental decorrente de exposição crônica de animais a doses de fluoreto oscilantes e simétricas reflete o efeito metabólico da média da oscilação.
ACKNOWLEDGEMENTS
We thank Mr. Waldomiro Vieira Filho for his valuable contribution in technical assistance, and CAPES for the scholarship granted to the first author. This study was based on a thesis submitted by the first author to the Piracicaba Dental School, University of Campinas, in partial fulfillment of the requirements for the PhD degree in Dentistry, Community Health Dentistry area.
REFERENCES
1. Cury JA, Tenuta LM. How to maintain a cariostatic fluoride con-centration in the oral environment. Adv Dent Res 2008;20:13-16. 2. Bronckers AL, Lyaruu DM, DenBesten PK. The impact of fluoride on ameloblasts and the mechanisms of enamel fluorosis. J Dent Res 2009;88:877-893.
3. Ekstrand J. Fluorides metabolism. In: Fluoride in dentistry. Fejer-skov O, Ekstrand J, Burt B (Editors). Copenhagen: Munksgaard; 1996. p 55-68.
4. Angmar-Månsson B, Whitford GM. Plasma fluoride levels and enamel fluorosis in the rat. Caries Res 1982;16:334-339. 5. Aoba T, Fejerskov O. Dental fluorosis: chemistry and biology. Crit
Rev Oral Biol Med 2002;13:155-170.
6. Angmar-Månsson B, Whitford GM. Enamel fluorosis related to plasma F levels in the rat. Caries Res 1984;18:25-32.
7. Catani DB, Hugo FN, Cypriano S, Sousa MLR, Cury JA. Relation-ship between fluoride levels in the public water supply and dental fluorosis. Rev Saúde Pública 2007;41:732-739.
8. Schour I, Massler M. The teeth. In: The rat in laboratory investigation. Farris EJ, Grifth JQ (Editors). New York: Hafner Publishing Co; 1971. 9. Vogel GL, Mao Y, Carey CM, Chow LC. Increased overnight fluoride concentrations in saliva, plaque, and plaque fluid after a novel two-solution rinse. J Dent Res 1997;76:761-767.
10. Bezerra de Menezes LM, Volpato MC, Rosalen PL, Cury JA. Bone as a biomarker of acute fluoride toxicity. Forensic Sci Int 2003;137:209-214.
11. Shinoda H. Effect of long-term administration of fluoride on physico-chemical properties of the rat incisor enamel. Calcif Tis-sue Res 1975;18:91-100.
12. Box GEP, Hunter WG, Hunter JS. Statistics for experimenters:
an introduction to design, data analysis and model building. New York: John Wiley & Sons Inc; 1978.
13. Warshawsky H, Josephsen K, Thylstrup A, Fejerskov O. The de-velopment of enamel structure in rat incisors as compared to the teeth of monkey and man. Anat Rec 1981;200:371-399.
14. Ekstrand J, Lange A, Ekberg O, Hammarström L. Relationship between plasma, dentin and bone fluoride concentrations in rats following long-term fluoride administration. Acta Pharmacol Toxicol 1981;48:433-437.
15. Rao HV, Beliles RP, Whitford GM, Turner CH. A physiologically based pharmacokinetic model for fluoride uptake by bone. Regul Toxicol Pharmacol 1995;22:30-42.
16. Angmar-Månsson B, Whitford GM. Single fluoride doses and fluorosis in the rat. Caries Res 1985;19:145-152.
17. Denbesten PK, Crenshaw MA, Wilson MH. Changes in the fluoride-induced modulation of maturation stage ameloblasts of rats. J Dent Res 1985;64:1365-1370.
18. Leblond CP, Warshawsky H. Dynamics of enamel formation in the rat incisor tooth. J Dent Res 1979;58:950-975.