CLINICAL UTILITY OF FRAILTY SCALES FOR THE PREDICTION OF
POSTOPERATIVE COMPLICATIONS
SYSTEMATIC REVIEW AND META-ANALYSIS
Vânia Patrícia Pinto Rocha
III
FACULTY OF MEDICINE OF PORTO UNIVERSITY CARDIOTHORACIC SURGERY DEPARTMENT
CLINICAL UTILITY OF FRAILTY SCALES FOR THE PREDICTION OF
POSTOPERATIVE COMPLICATIONS
SYSTEMATIC REVIEW AND META-ANALYSIS
Vânia Patrícia Pinto Rocha
Orientador: Professor Doutor Daniel Moreira Gonçalves
IV
ABSTRACT
Background: Frailty can be defined as a biological syndrome of reduced reserve and resistance to stressful events. Evidence suggests that this syndrome is linked to adverse outcomes in various surgical populations. Several instruments have been developed to measure frailty, however there is no consensus about which one is the most useful in the surgical population. Therefore, this study aims to evaluate the utility of different frailty scales in the prediction of postoperative complications in older surgical population.
Methods: This review and meta-analysis assembles prospective cohort studies reporting frailty and postoperative outcomes. Searches were performed in PubMed/Medline, Scielo, Cochrane Library and ScienceDirect databases. Statistical analyses was performed using Review Manager software and the pooled ORs was calculated.
Results: A total of 15 articles were included in the present review. Frailty was
significantly associated with postoperative complications (OR=2.53, 95% CI: 2.07-3.10; Z=9.00; P<0.00001), mortality until 30 days (OR= 2.90, 95% CI: 1.99-4.24, p<0.00001) and higher 1-year mortality, (OR=3.49, 95% CI: 2.40-5.09, p<0.00001), and with hospital length of stay >5days or >14days (OR=2.78, 95% CI: 1.45-5.30, p=0.002 and OR=2.40 (95% CI: 1.08-5.36, p= 0.03, respectively). In addition, our meta-analysis showed that frailty is a significant predictor of renal failure (OR=5.03, 95% CI: 1.74 – 14.54, p=0.003), neurological complications (OR= 3.41, 95% CI: 1.08-10.73, p=0.04), respiratory complications (OR=9.21 (95% CI: 2.35-36.02, p=0.001), wound infection (OR=2.85 (95% CI: 1.65-4.94, p=0.0002) and sepsis (OR=3.84 (95% CI: 1.37-10.71, p=0.01).
Conclusions: Overall, frailty significantly increases the risk for developing adverse outcomes after surgery, so early detection of frailty may be a window of opportunity for intervention and a key factor for improving clinical outcomes. Moreover, future studies are required for the standardization of the frailty scales used.
V
ACKNOWLEDGMENTS
Para a elaboração deste trabalho contei com o apoio e colaboração de várias pessoas, às quais quero deixar os meus sinceros agradecimentos.
Ao professor doutor Daniel Moreira Gonçalves, o meu especial agradecimento por ter aceite orientar este trabalho e por toda a paciência e dedicação demonstradas ao longo deste período, por todas as correções e conselhos que tornaram possível a concretização deste trabalho.
Aos meus pais e irmãs que sempre me incentivaram a fazer mais e melhor, pelo seu apoio incondicional e por sempre acreditarem nas minhas capacidades.
Aos meus amigos, pela paciência, por estarem sempre presentes, por todos os conselhos e por nunca me deixarem desistir.
Aos meus colegas de trabalho o meu obrigada pela compreensão e pela força. Por fim, aos meus colegas de mestrado, em especial ao meu colega de trabalho Filipe Marmelo, que me acompanharam ao longo desta etapa e a todos aqueles que de alguma forma contribuíram para a concretização deste trabalho, os meus sinceros agradecimentos.
VI
ABBREVIATIONS LIST
LOS - length of stay FI- Frailty index FP - Frailty Phenotype CRP - C-reactive protein IL – 6 - Interleukin-6
TNF-α- Tumor necrosis factor-α CHS – Cardiovascular Health Study TUG - Timed Up and Go
ADL - activities of daily living
CGA - Comprehensive Geriatric Assessment
CES-D: Center of Epidemiologic Studies Depression Scale ADL - Activities of Daily Living
IADL - Instrumental Activities of Daily Living CFS - Clinical Frailty Scale
BNP – Brain natriuretic peptide FEV1 – forced expiratory volume
CAF – comprehensive assessment of frailty
FORECAST - Frailty predicts death One year after Elective Cardiac Surgery Test
OR- Odds Ratio
CI – Confidence interval I2 - Heterogeneity
VII INDEX ABSTRACT ... IV ACKNOWLEDGMENTS ... V ABBREVIATIONS LIST ... VI INDEX ... VII FIGURES INDEX ... VIII TABELS INDEX ... IX INTRODUCTION ... 10 BACKGROUND ... 12 WHAT IS FRAILTY? ... 12 PATHOPHYSIOLOGY... 13 MODELS OF FRAILTY ... 15 FRAILTY PHENOTYPE ... 15
DEFICIT ACCUMULATION MODEL ... 17
FRAILTY ASSESSMENT TOOLS ... 19
WHICH TOOL USE CLINICALLY? ... 20
MULTI-ITEM SCALES ... 20
SINGLE-ITEM SCALES ... 27
FRAILTY AND SURGERY ... 28
PREVALENCE OF FRAILTY IN THE OLDER SURGICAL POPULATION ... 29
RELEVANCE OF THIS REVIEW ... 30
METHODS ... 31 SEARCH STRATEGY ... 31 PUBLICATION SELECTION ... 31 QUALITY ASSESSMENT ... 32 DATA EXTRACTION ... 32 STATISTICAL ANALYSIS ... 33 RESULTS ... 34 DISCUSSION ... 51 LIMITATIONS ... 53 CONCLUSIONS ... 53 BIBLIOGRAPHY ... 54
VIII
FIGURES INDEX
Figure 1 – Illustration of frailty pathways (adapted from Afilalo et al.) ... 14 Figure 2 - Flowchart of studies included in review ... 35 Figure 3 - Forest plot showing the effect of frailty on the occurrence of any complication, according to OR. ... 44 Figure 4- Forest plot showing the effect of frailty on the occurrence of the different postoperative complications, according to OR ... 46 Figure 5 – Forest plot showing the effect of frailty on mortality, according to OR ... 48 Figure 6 - Forest plot showing the effect of frailty on hospital length of stay, according to OR. ... 50
IX
TABELS INDEX
Table 1 – Frailty Phenotype Domains from Cardiovascular Health Study (adapted from Ad et al.’s
study) ... 16
Table 2 – Variables included in FI table adapted from Vigorito et al. ... 18
Table 3 - Clinical Frailty Scale from Canadian Study of Health and Aging (adapted from Juma et. al)... 23
Table 4 – Description of other multi-domain scales used in literature... 26
Table 5 - Frailty Assessment Tools and Scoring Systems ... 36
Table 6 – Results of the MINORS quality assessment ... 41
Table 7 – Prevalence of frailty ... 43
Table 8 – Frailty scales and prediction of postoperative complications ... 47
10
INTRODUCTION
The ageing of populations worldwide is leading to an unprecedented rise in the number of surgeries. Due to the heterogeneity within the elderly population, with its variation in physiological reserves, comorbidity and geriatric conditions, differences in (side) effects of therapy, like postoperative complications, can be predicted. Postoperative complications can impose a significant burden by increasing morbidity and mortality, in-hospital length of stay and need for a greater level of care at discharge(1-3). For instance in cancer patients, postoperative complications are associated with delays in chemotherapy that lead to worse disease-free and overall survival(4). Of note, it was shown that the occurrence of 30-day postoperative complication was more discriminative of survival after major surgery than preoperative patient risk and intraoperative factors(5, 6).
In an attempt to facilitate perioperative risk assessment for the selection of patients benefiting from surgery, different risk-scoring systems have been devised for predicting mortality and morbidity. These risk scoring systems have substantial limitations in older patients, as most are based on a single organ system, are subjective and none integrates the concept of physiologic reserve and frailty(7-9). Frailty can be defined as a biological syndrome of reduced reserve and resistance to stressful events (such as surgery), resulting from cumulative declines across several physiological systems leading eventually to a higher potential for adverse outcomes(7-17). The comprehension of mechanisms underlying frailty are still a field of ongoing research and debate, however, some mechanisms such as deregulation of the immune, hormonal and endocrine systems seem to play an important role in their development(13-18).
The value of frailty has been recognized in the gerontology literature for many years, where it has been utilized as a predictor of survival and institutionalization in the community, but just recently has been applied to surgery, as an independent and strong risk factor for adverse postoperative outcomes. Studies in various surgical populations have identified frailty as an independent risk factor for major morbidity, mortality, protracted length of stay (LOS) and institutional discharge(10, 19).
11
Several instruments have been developed to measure frailty, however there is no consensus about the most useful. Most tools focus on frailty phenotype, evaluating one or more of its domains: slowness, weakness, low physical activity, exhaustion, and shrinking. Despite the lack of agreement, accumulating evidence suggests that assessment by using any validated tool provides additional information about surgical risk and prognosis not captured by traditional risk assessment(10, 13, 18, 20).
To incorporate frailty screening in the risk assessment before surgical procedures, it is essential to evaluate the feasibility and validity of frailty instruments in this setting. If preoperative frailty status predicts mortality, functional status, and quality of life, such information would be useful in making informed decisions about the procedures(9). An understanding of frailty is therefore necessary for the better selection of patients, an understanding of the preoperative risk and an appropriate discussion of risk/benefit(21).
In this study, we aimed to evaluate the utility of different frailty scales in the prediction of postoperative complications (mortality, morbidity and hospital LOS) and thus contribute to the optimization of existing surgical risk assessment tools and support clinical decisions.
12
BACKGROUND
WHAT IS FRAILTY?
It is becoming clearer in the literature that there are obvious differences between chronological age and biological age, both of which have a different impact on the prediction of major complications and mortality. For instance, Baijal et al., highlighted that patients with similar chronological age may have different physiologic reserves and respond differently to stressful procedures(22). Joseph, et al., also found evidence that age was inadequate as a reference for clinical decision making in geriatric trauma patients, while frailty index, which is closer to biological age, was demonstrated to be an independent predictor of in-hospital complications and adverse discharge disposition(23). In another study, age as single factor was not a significant predictor of one-year mortality or complications(24).
So, what is frailty? Frailty is often described as a multidimensional syndrome in aged patients where there is increased vulnerability due to decreased biologic reserve and the inability of the body to compensate in response to increased stress. It can be understood as a loss of physiologic resilience and implies that biological and chronological age may differ considerably(13, 25). Frailty prevalence increases with aging but is not exclusive from old persons as showed by Rockwood et al., 2% of frail individuals are among those younger than 30 years old; 22.4% in those older than 65 years old; and 43.7% in those aged 85 and older(26, 27).
The healthy human body (non-frail), can sense many different changes in its basal state and respond accordingly with appropriate variations in precision and intensity. In contrast, frail patients have a limited repertoire of responses to various stressors because they consume large amounts of energy to maintain homeostasis, which may increase the possibility of a greater occurrence of postoperative complications after surgical procedures(7, 25).
Emerging research has established frailty as a strong predictor of operative morbidity and mortality. Frail patients present higher risk for decompensation, adverse
13
events, procedural complications, prolonged recovery, functional decline, disability, and mortality(13, 28). This has been successfully shown in different modalities of surgery like colorectal, cardiac, vascular, orthopedic surgery(29-32).
PATHOPHYSIOLOGY
Frailty is characterized by the rapid pathologic impairment of several physiologic and molecular systems. Evidence suggests that frailty arises when age-related decline occurs synchronously across multiple pathways, thus reaching a critical threshold of dysregulation(28).
The pathophysiology of frailty remains undetermined but, recent literature suggests that at its core, frailty is a pro-inflammatory state. Many studies have found a correlation between higher levels of inflammatory markers and increased risk of adverse health outcomes(28, 33).
In the context of frailty, several studies demonstrate a strong biological link between the inflammatory and endocrine systems(28, 34).
A recent study examined inflammatory biomarkers, thought to be important in the pathophysiology of frailty, and the association with postoperative complications in older colorectal surgical patients(35). Levels of C-reactive protein (CRP), interleukin-6 (Il-6) and Tumor necrosis factor-α (TNF-α) increased significantly with increasing frailty level. IL-6 specifically has been shown to influence multiple physiologic systems and has been linked to the development of sarcopenia, anemia, and insulin resistance(18, 19, 36).
Weakness and fatigue are two of the major components of frailty that directly contribute to declining physical function. Sarcopenia is defined as a low level of muscle mass resulting from muscle loss that is common in adults and increases with age, particularly in people greater than 65 years of age(36).
14
Hubbard et al., using the phenotype frailty criteria, studied 110 patients and discovered that greater frailty is accompanied by greater levels of TNF- α, IL-6 and CRP, together with a corresponding decrease in albumin in the frailest subjects(37).
Low testosterone levels have been associated with decreases in muscle mass, strength, and bone density, comparable with men with hypogonadism. Estrogen receptors have been localized to human skeletal muscle cells and have been found to influence metabolic and myogenic gene expression. Consequently, with the loss of estrogen or testosterone, changes in muscle strength are seen(36).
Finally, endocrine senescence (an age-related process), includes a decrease in growth hormone and insulin like growth factor 1. Overall, these changes promote a catabolic state resulting in the perpetuation of sarcopenia with muscle breakdown and reduction in strength(13, 36). In addition, accumulating evidence has also linked inflammation to cognitive decline and risk of dementia(38), and frailty is robustly a risk factor for cognitive impairment(39). As previously mentioned, the levels of inflammatory biomarkers tend to increase with frailty status, and higher levels of inflammation have been shown to negatively affect cognitive processes, including memory, speed of processing, and global cognitive function. Additionally, inflammation has been linked to incipient dementia and neurodegenerative diseases(38).
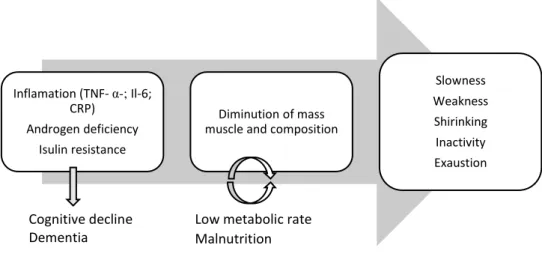
Figure 1 – Illustration of frailty pathways (adapted from Afilalo et al.)(13)
Legend: TNF- α: Tumor necrosis factor-α; Il-6: Interleukin-6; CRP: C-reactive protein Inflamation (TNF- α-; Il-6;
CRP) Androgen deficiency
Isulin resistance
Diminution of mass muscle and composition
Slowness Weakness Shirinking Inactivity Exaustion
Low metabolic rate Malnutrition Cognitive decline
15
MODELS OF FRAILTY
Despite the lack of consensus regarding its definition or assessment tools there are two main models of frailty described in literature: the frailty phenotype (FP) and the frailty index (FI) or deficit accumulation model. These models were derived from data taken from the Cardiovascular Health Study (CHS) and the Canadian Study of Health and Aging, respectively(19, 34).
FRAILTY PHENOTYPE
The frailty phenotype initially described by Fried et al.(40) has been widely used for research purposes, mostly to investigate the correlation between frailty and adverse outcomes in community-dwelling elderly persons. In this population, positive results have been found in prediction of mortality, hospitalization and development of disabilities(41-44). Similar findings were shown for patients undergoing surgical procedures(45-48), suggesting that phenotype frailty scale is a good option to measure frailty.
This model considers frailty as a complex biological syndrome, operationalized by functional measures of physical ability, endurance, weakness, slowness, and sarcopenia or weight loss (Table 1). A limitation to the FP is that it only focuses physical domains and fails to provide a complete assessment of the patient because it does not include information about cognitive, psychological state or nutritional status, which is provided by the FI(28, 40, 49, 50).
16 Table 1 – Frailty Phenotype Domains from Cardiovascular Health Study (adapted from Ad et al.’s study) (51)
Domain Toll commonly used Common cutoff for frailty
Weakness Handgrip strength test Men:
BMI ≤ 24: ≤29 Kg BMI 24.1-26: ≤ 30 kg BMI 26.1-28: ≤ 30 kg BMI > 28: ≤32 Kg Women: BMI ≤ 23: ≤ 17Kg BMI 23.1-26: ≤ 17.3 kg BMI 26.1-29: ≤18kg BMI > 29: ≤21kg
Shrinking Weight loss 10 pounds in past year
Exhaustion CES-D questionnaire Positive if often (3-4 days) is the
answer to either question:
“Everything I deed is an effort in the last week”
“I could not get going in the last week”
Low activity Physical activity questionnaire
based on short version of Minnesota Leisure Time Activity questionnaire
Men: <383 kcal/week Women: <270 kcal/week
Slow walking speed
5-m gait speed test Men:
Height ≤ 173 cm: ≥7 s Height ≥ 173 cm: ≥6 s Women:
Height ≤159 com: ≥7 s Height ≥ 159 cm: ≥6 s
17
DEFICIT ACCUMULATION MODEL
The deficit accumulation model of frailty proposed by Rockwood et al. (26) considers the accumulation of multiple deficits such as symptoms, signs, disabilities, pathological conditions and abnormal laboratory values (secondary frailty). This model allows the calculation of a frailty index (FI), which can be thought of as a count of an individual´s accumulated deficits. FI is the sum of the deficit values divided by the total number of deficits listed and is significantly correlated with important clinical outcomes(19, 34). In community-dwelling older adults, utilization of FI showed benefits to identify high-risk patients for mortality and hospitalization(26, 43, 52-54).
FI is a more extensive scale the items included in this scale can range from 40 to 70(26), for a FI to be able to capture sufficient features or risk factors for frailty, it should include at least 40 items(34). Variables included in FI are described in Table 2.
18
Table 2 – Variables included in FI table adapted from Vigorito et al. (34)
40 variables included in FI Cut point
Help bathing Yes – 1 No- 0
Help dressing Yes – 1 No- 0
Help getting in/out of a chair Yes – 1 No- 0
Help walking around house Yes – 1 No- 0
Help eating Yes – 1 No- 0
Help grooming Yes – 1 No- 0
Help using toilet Yes – 1 No- 0
Help up/down stairs Yes – 1 No- 0
Help lifting 10 lbs Yes – 1 No- 0
Help shopping Yes – 1 No- 0
Help with housework Yes – 1 No- 0
Help with meal preparations Yes – 1 No- 0
Help taking medications Yes – 1 No- 0
Help with finances Yes – 1 No- 0
Lost more than 10 lbs in last year Yes – 1 No- 0
Self-rating of health Poor – 1; Fair -0.75; Good – 0.5; V. Good – 0.25; Excellent - 0
How health has changed in last year Worse – 1 better/same - 0
Stayed in bed at least half of the day due to health (in last month)
Yes – 1 No- 0
Cut down on usual activity (in last month) Yes – 1 No- 0
Walk outside < 3days- 1; >3 days - 0
Feel everything is an effort Most of the time – 1; Some time – 0.5; Rarely - 0
Feel depressed Most of the time – 1; Some time – 0.5; Rarely - 0
Feel happy Most of the time – 1; Some time – 0.5; Rarely - 0
Feel lonely Most of the time – 1; Some time – 0.5; Rarely - 0
Have trouble getting going Most of the time – 1; Some time – 0.5; Rarely - 0
High blood pressure Yes – 1; Suspected – 0.5; No - 0
Heart attack Yes – 1; Suspected – 0.5; No - 0
CHF Yes – 1; Suspected – 0.5; No - 0
Stroke Yes – 1; Suspected – 0.5; No - 0
Cancer Yes – 1; Suspected – 0.5; No - 0
Diabetes Yes – 1; Suspected – 0.5; No - 0
Arthritis Yes – 1; Suspected – 0.5; No - 0
Chronic lung disease Yes – 1; Suspected – 0.5; No - 0
MMSE <10 – 1; 11-17 – 0.75; 18-20 – 0.50; 20-24 – 0.25; >24 - 0
Peak flow (l/min) <340 *
BMI <18,>30 men; <18.5, >30 women*
Shoulder strength (Kg) <12 men; <9 women*
Grip strength <29-32 men; <17-21 women*
Rapid pace walks for 20ft (s) >10 (men and women) *
Usual pace walks for 20ft (s) >16 (men and women) *
Legend: *1 point for each criterion; FI – frailty index; CHF – cardiac heart failure; MMSE – Mini Mental State Examination; BMI – body mass index
19
FRAILTY ASSESSMENT TOOLS
Many tools have been developed to measure frailty and, owing to a lack of consensus which one is better, there is variability among studies and confusion on which tool to use. These tools can be divided in multi-item frailty scales and single-item, some follow the phenotypic model, others consist of administered or self-administered questionnaires, and some require clinical evaluation or task performance and measurement(13, 34).
The lack of consensus on which method should be used to measure frailty is due to several issues:
• Absence of a universally accepted definition hampers precise identification or measurement;
• There are different intentions in measuring frailty (assessing, screening, case-finding or predicting prognosis);
• Measurement of frailty has mainly been undertaken in the research setting and thus the assessment of clinically feasible tools is only just emerging in the literature(19).
20
WHICH TOOL USE CLINICALLY?
The question which is best clinical tool for assessment of frailty remains unanswered. Choosing a frailty assessment tool for the older surgical population should be undertaken considering the two main purposes of preoperative identification of frailty: risk stratification and identification of factors for potential modification. For example, some single-item frailty tools such as grip strength or gait speed have the benefit of simplicity, reproducibility and application to the busy preoperative setting and can define an individual as being ‘at risk’ of adverse postoperative outcomes. Although, such measures do not point the clinician to clear areas for modification of frailty(19).
Defining the optimal tool set to measure frailty is a high priority. We must first determine whether there is incremental value in using multi-item scales as opposed to single-item measures(13).
Belga et al., made a comparison of three frailty tools: Clinical Frailty Scale (CFS), modified Fried score and the Timed Up and Go (TUG). Frailty has a significant impact on post-discharge outcomes, and the CFS is the most useful of the frequently used frailty tools for predicting poor outcomes after discharge(11).
MULTI-ITEM SCALES
There are several multi-dimensional frailty scales which have excellent content validity and reliability for frailty screening(55), some of them and their characteristics are described below.
21
CHS frailty scale and FI
The CHS scale or Fried scale includes the five components of the frailty phenotype described above in this work, and it requires the presence of 3 or more criteria for a diagnosis of frailty to be confirmed. The FI scale is based on the theory of deficit accumulation and was also described above. These are the most frequently cited frailty scales and where all demonstrated to predict mortality and disability in large cohorts of community-dwelling elder, post-operative complications, LOS, and discharges to assisted-living facility in elderly patients undergoing major surgery (13, 27, 55).
COMPREHENSIVE GERIATRIC ASSESSMENT
Comprehensive geriatric assessment (CGA) is a multi-dimensional scale based on deficit accumulation model that includes comorbidity, polypharmacy, physical function, psychological status and nutrition(56, 57). This multidimensional frailty scale is useful for predicting outcomes in geriatric patients undergoing surgery and has emerged as an useful tool on the oncologic field(29, 45). It adds information to more generalized measures of functional status(18). As a logical extension of the prognostic and predictive capabilities of the geriatric assessment, this tool has been applied prospectively to guide the treatment of older adults with cancer(58).
22
CLINICAL FRAILTY SCALE
The Clinical Frailty Scale (CFS) is a practical and efficient tool for assessing frailty. This tool includes domains like current illnesses, ability to manage Activities of Daily Living (ADL) or Instrumental Activities of Daily Living (IADL) and physical signs. ADL are activities in which people engage on a day-to-day basis (Supplement 1). These are everyday personal care activities that are fundamental to caring for oneself and maintaining independence. IADL are activities related to independent living and are valuable for evaluating persons with early-stage disease, both to assess the level of disease and to determine the person’s ability to care for themselves(19, 20).
The CFS was shown to be capable of identifying patients that are most likely to have prolonged hospital stays, functional decline and mortality on acute medical units (14, 20).
The classification of patients and the characteristics of each category by CFS was described in Table 3.
23 Table 3 - Clinical Frailty Scale from Canadian Study of Health and Aging (adapted from Juma et al.) (20)
Legend: IADL – Instrumental Activities of Daily Living; ADL - Activities of Daily Living
1 Very fit Robust, active, energetic, well-motivated and
fit; these people exercise regularly and are in the most fit group for their age
2 Well Without active disease, but less fit than people
in group 1; these people are very active occasionally
3 Well, with treated comorbid
disease
Disease symptoms are well controlled compared to people in group 4; not regularly active
4 Apparently vulnerable Although not frankly dependent, these people
commonly complain of being “slowed up” or have disease symptoms
5 Mildly frail More evident slowing with limited dependence
on other for IADL
6 Moderately frail Help is needed with both ADL and IADL
7 Severely frail Completely dependent on others for ADL
8 Very severely frail Completely dependent for personal care; they
could not recovery from a minor illness
24
CAF and FORECAST
Comprehensive Assessment of Frailty (CAF) is a multi-domain scale utilized in Sundermann’s(24, 30, 59) studies that combines data from Fried and CFS, plus the assessment of disability, balance and blood analysis.
The first part is deduced from the Fried criteria: weakness, self-reported exhaustion, slowness of gait speed and low activity. The second part of the CAF test is designed to assess physical performance. Firstly, the balance is tested and then body control is assessed. The patient should get up and down from a chair three times, pick up a pen from the floor and put on and remove a jacket. Selected laboratory tests are included in the CAF score. Serum albumin as a marker for nutritional state and liver function, creatinine as a marker for kidney function and brain natriuretic peptide (BNP) as a marker for heart failure is measured. To assess respiratory function, the forced expiratory volume in 1 s (FEV1) is measured. In addition, two physicians estimate frailty of the patient according to the CFS from the Canadian Study of Health and Aging(59).
The disadvantages of the CAF scale are: it is time-consuming as it takes 10–20min to perform the test; require special equipment, and it is not easily integrated into daily clinical routine. To supersede these disadvantages Sundermann identified discriminating factors that showed predictive value for one-year mortality as single factors. ‘Chair rise’, ‘Weakness’, ‘Stair-rise’, ‘CFS’ and ‘Creatinine’ were identified so these factors were used to build a modified CAF-score: Frailty predicts death One year after Elective Cardiac Surgery Test (FORECAST) (24).
FORECAST is a simplified version of the CAF composed by five test items that have shown the highest impact on the predictive power of the CAF:
• Chair rise: Patient is asked to get up and down from a chair three times and time is measured;
• Weak: Patient is asked if he felt weak in the last two weeks; • Stair: Patient is asked to climb as many stairs as he can;
25
• CFS: Clinical frailty scale is a clinical frailty scale from the Canadian Study of Health and Aging;
• Creatinine: Serum creatinine level;
The main advantage of this adaptation of CAF is that the time to assess frailty is reduced to 3–5 min, which allows an easy and fast assessment of frailty during the routine clinical examination(24).
OTHER MULTI-DOMAIN SCALES
26 Table 4 – Description of other multi-domain scales used in literature
Legend: BMI- body mass index; ADL – activities of daily living; TUG – timed up-and-go; IADL – instrumental activities of daily living
Frailty measure Characteristics
Robinson Scale(60) 8 ‘markers’ of frailty: age, cognition,
recent weight loss, BMI, serum albumin, falls, depression, hematocrit
Marshall score(61) 11 “markers” of frailty: History of fall in
preceding six months, require assistance with any ADL, BMI <18.5 or > 4.5Kg unintentional weight loss, reported exhaustion, self-reported low physical activity, serum albumin <33g/L, hematocrit <0.35, serum creatinine >120mmol/L, 5m walk time, chair rise time, grip strength
Lee index(62) ADL dependence
Dependence in ambulation History of dementia
Green index(63) 15 – ft gait speed
Grip strength
Serum albumin level ADL dependence
Codner index(64) Gait speed
ADL dependence Serum albumin level Oxygen therapy Cognitive function General appearance Subjective assessment
Stortecky index(65) TUG test
Mini-Mental state Examination ADL dependence IADL dependence
Preclinical mobility disability Mini Nutritional assessment
27
SINGLE-ITEM SCALES
In contrast to the multi-item frailty scales previously described, there are the single-item scales, which are less time-consuming. The gait speed, 6-min walk test and TUG are some of these tools described in literature.(66-68)
The gait speed test has been shown to have excellent inter-rater reliability and test-retest reliability. Large registries have adopted the 5-m distance, showing a good balance by allowing patients to achieve a steady walking speed without eliciting cardiopulmonary symptoms. The short distance and comfortable pace are well below cardiopulmonary limitations, making the focus of this test different than a typical stress test or 6-min walk test (6-MWT).(13)
The 6MWT is an objective submaximal assessment of exercise functional capacity in patients with cardiopulmonary disease. A shorter distance walked in the 6MWT may be a marker of frailty, which is associated to worse outcomes(69).
Finally, TUG measures the time needed to stand up from a chair, walk 10 ft., return to the chair, and sit. Represents a simple, quick, and more powerful alternative for stratifying preoperative risk in older persons(70).
28
FRAILTY AND SURGERY
Physical and psychological post-surgical stress can have profound effects on the patient, leading to imbalance in autonomic, endocrine, metabolic and immune functions. Such imbalance is not just age-related, but also depends on the patient’s preoperative physiological state and the type of surgery. It has been known for many years that some older people lack the physiological reserves to withstand surgery. However, there was a lack of standardized definitions for this vulnerability. Frailty has advanced this science as many studies have demonstrated that increasing frailty has worsening outcomes in terms of postoperative complications, increased length of stay, mortality and inability to be discharged home(47, 71, 72).
Bagshaw et al., looked at both the short-term and long-term postoperative outcome of frail and non-frail patients. While in the short term it confirmed the link between frailty and poor surgical outcome, it also showed that this effect lasts long term. For the people who survived the surgery and intensive care unit stay, frailty was associated with a mortality of 48% vs 25% for non-frail patients 12 months later(73).
This ability to adapt to surgical stress is not only dependent on the degree of frailty but also the type of surgery, which is a stronger influence on outcomes after major surgery than minor surgery(47).
The decision to operate on an older person, therefore, is one that should be taken with careful considerations(21).
29
PREVALENCE OF FRAILTY IN THE OLDER SURGICAL POPULATION
The prevalence of frailty in patients of all ages presenting for surgical procedures ranges from 4.1 and 50.3%(19). This wide variation can be attributed in part to differences in the definition (and thus, assessment tool), measurement and features of the population in study. A recent study used the Fried model to define frailty in community-dwelling people aged between 65 and 74 years. Prevalence rates of frailty in this study were 8.5% for women and 4.1% for men(74). Studies examining older patients undergoing elective cardiac and non-cardiac surgery quote prevalence rates of frailty at between 41.8 and 50.3%(13, 24, 47). This high prevalence of frailty in older surgical populations, compared with the prevalence rate of less than 10% observed in older community-dwelling individuals, highlights the vulnerability of this particular population(19).
30
RELEVANCE OF THIS REVIEW
As described above, frailty is a state of vulnerability that impacts a heterogeneous group of people and has been associated with a decreased physiologic reserve and function across multiple physiological systems. The concept of frailty remains relatively well accepted and several different models, based on either a frailty phenotype or a deficit-based model, have been proposed in order to define and assess it. However, there is no gold standard tool for the assessment of frailty, which makes
the prevalence of frailty highly variable according to the used tool and to the specific features of the population under evaluation(8, 11, 28).
A consistently accurate frailty assessment has utility in several key areas. First, it might help to substantiate the decision to operate, delay surgery or not to operate. Ferraris et al. 2014, found that 20% of patients with the greatest risk for developing postoperative complications (based on age) accounted for roughly 90% of severe complications. This means that 80% of the remaining patients had a low rate of complications but could potentially be refrained from surgery based on their surgery risk classification(1). Second, although there have been no studies demonstrating a preoperative intervention on frail patients that improve postoperative outcomes, it may highlight patients who deserve more attention in the postoperative period, which may include a higher level of care or more frequent postoperative office visits. Third, it is a tool to improve patient counseling of risks to facilitate shared decision making. Finally, and perhaps most importantly, it represents potentially actionable targets where intervention could improve a patient’s fitness for surgery(75).
A general overview of frailty concepts and their relationship with perioperative outcomes still lacks in literature, making it difficult for health care professionals and researchers to recognize frailty and the related risks for health and properly follow up the frailty process(76). Therefore, the presented study aims to clarify the value of frailty scales in the prediction of postoperative adverse outcomes in older patients.
31
METHODS
SEARCH STRATEGY
A search was performed in the databases PubMed/Medline, Scielo, Cochrane Library, ScienceDirect using combined keywords: “frailty” and “surgery” in combination with “outcomes” or “complications”. The search was conducted between October 2016 and March 2017, with filters applied to limit the results to the English or Portuguese language, and papers published after 2010.
PUBLICATION SELECTION
One author (VR) performed the research in the above mentioned databases, and the selection of studies to be included in the analysis was based on the following criteria: 1) prospective cohort studies; 2) patient population submitted to surgical procedure; 3) frailty was assessed and was the main factor of interest in the study; 4) the relationship between frailty and adverse outcomes (mortality, morbidity, hospitalization length of stay) was evaluated.
Exclusion criteria were: 1) review articles; 2) publication data before 2010; 3) absence of outcomes of interest; 4) severe heart failure and severe aortic stenosis. If a study was considered potentially eligible, the full text was obtained and analyzed. A second author (FM) helped to verify the eligible studies and, in case of doubt with inclusion/exclusion criteria, a third author (DMG) helped in the final decision.
32
QUALITY ASSESSMENT
The methodological quality of the included studies was independently evaluated by two authors (VR and FM) through the use of Methodological Index for Non-Randomized Studies (MINORS)(77).
A third author (DMG) participated in case of
disagreement. This instrument consists of the following 8 items: a clearly stated aim, inclusion of consecutive patients, prospective collection of data, endpoints appropriate to the aim of the study, unbiased assessment of the study endpoint, follow-up period appropriate to the aim of the study, loss to follow-up less than 5%, and prospective calculation of the study size. An item is scored 0 points if the information is not reported, 1 point if the information is reported but inadequate, or 2 points if the information is reported and adequate; so, the ideal score is 16.
DATA EXTRACTION
One author (VR) extracted the following data from the selected studies: 1) number of patients involved; 2) the frailty assessment tool; 3) the prevalence of frail and not frail patients; 4) the adverse outcomes. For the purpose of our analysis, we categorized the patients in a simplified two-category classification as previously suggested(17): frail and not frail. Therefore, studies that categorized the patients in “frail, prefrail and robust”, the prefrail and frail patients were combined in a “frail group” and compared to the “not frail group” (robust patients); in studies that categorized the patients in “frail, intermediate frail or moderately frail and robust”, we combined “frail” and “intermediate frail” or “moderately frail” in a “frail” group and robust in a “not-frail” group; in the Marshall et al.’sstudy(61),patients were categorized as robust (0-1 score), borderline frail (2-3 score) and frail (≥4 score) and then the authors combined “borderline frail” and “robust” in “not frail” group. This categorization differs from the one we adopted but we could not combine “borderline frail” with “frail” due to the absence of information in the paper. Regarding the data from Robinson et al.’s studies(68, 70), we considered patients submitted to colorectal and cardiac surgery as a single group. Moreover, patients classified in “fast” group by TUG were included in “not frail” group
33
and patients classified in “intermediate” or “slow” walkers were combined in “frail” group.
When studies used different frailty scales to compare the same outcome in the same population, the results obtained by each scale were included in the meta-analysis. The frailty instruments used by all authors were identified and grouped in three categories: frailty phenotype scales, single-item frailty scales and other multi-domain frailty scales.
STATISTICAL ANALYSIS
Statistical analysis was performed using Review Manager software (RevMan 5.1; Copenhagen: the Nordic Cochrane Centre, Cochrane Collaboration), in accordance with the Cochrane Heart Review Group. The meta-analysis of binary outcomes used study specific frequency of events (comparing frail with non-frail patients) as outcome data, and the resulting pooled estimates and confidence intervals were converted to odds ratios (ORs). If not available, the authors were contacted to provide access to data. Since the binary outcomes were all adverse events, a positive OR indicated that frailty is associated with worse patient outcomes. For all dichotomous outcomes, the fixed-effect model was used in the meta-analysis to determine the OR. The results from the meta-analyses are presented as pooled ORs (with 95% confidence intervals [CIs]). Heterogeneity (I2) of the effect size between studies was tested for each outcome to describe the extent of the between-study heterogeneity. I2 values may range from 0% (no observed heterogeneity) to 100% (complete heterogeneity) and values of 25%, 50% and 75% can be considered as low, moderate and high, respectively.
34
RESULTS
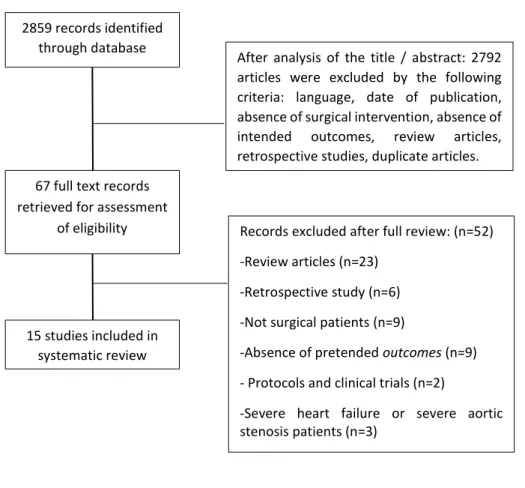
A total of 2859 articles were initially identified (Figure 2). After analysis of the title/abstract, 2792 articles were excluded because they did not meet the selected criteria (language, date of publication, absence of surgical intervention, absence of intended outcomes, review articles, retrospective studies, duplicate articles). A total of 67 full-text records were retrieved for assessment of eligibility: 52 records were eliminated after full review [review articles (n=25); retrospective study (n=6); not surgical patients (n=9); absence of pretended outcomes (n=8); protocols and clinical trials (n=2); severe heart failure patients (n=2)]. Information about the exclusion of each study can be consulted in the supplement 2. A total of 15 studies were included in our systematic review. Seven studies assessed patients submitted to cardiac surgery(24, 30, 51, 59, 61, 67, 78) , 3 to colorectal surgery(29, 45, 48), 1 to orthopedic surgery(32) , 2 to undifferentiated major surgery (47, 75) and 2 to cardiac and colorectal surgery(68, 70). Of the 3743 patients enrolled, 2055 were men (55%) and 1605 were woman (43%), with an average age of 76.9±4.9 years. No information about gender was provided in one study (corresponding 2% of our total sample) (48). Different frailty instruments were used by authors and a summary is presented in Table 5.
35 2859 records identified
through database searching
67 full text records retrieved for assessment
of eligibility
After analysis of the title / abstract: 2792 articles were excluded by the following criteria: language, date of publication, absence of surgical intervention, absence of intended outcomes, review articles, retrospective studies, duplicate articles.
15 studies included in systematic review
Records excluded after full review: (n=52) -Review articles (n=23)
-Retrospective study (n=6) -Not surgical patients (n=9)
-Absence of pretended outcomes (n=9) - Protocols and clinical trials (n=2)
-Severe heart failure or severe aortic stenosis patients (n=3)
36 Table 5- Frailty Assessment Tools and Scoring Systems
Study N (F vs NF) Mean age
(years)
Gender n (%) Type of surgery Frailty measure Description Clinical outcome
Ad et al., 2016 (51) 166 (39 vs 127) 74.1 +/- 6.6 Fe – 41 (25) M – 125 (75) Cardiac surgery (valve surgery or CABG) CHS Frailty Index F: Score ≥ 3
Weight loss, exhaustion, low physical activity, slow walk time, and weak grip strength
Operative mortality (<30 days); major morbidity
Afilalo et al., 2010 (67)
131 (60 vs 71) 75.8 +/- 4.4 Fe – 44 (34) M – 87 (66)
Cardiac surgery 5-m gait speed F: Time ≥6 secs
In-hospital post-operative mortality or major morbidity; all-cause death, discharge to a health care facility; prolonged postoperative LOS Afilalo et al., 2012 (78) 152 (CHS: 30 vs 122) or (GS: 70 vs 82) 75.9 +/- 4.4 Fe – 52 (34) M- 100 (66)
Cardiac surgery CHS frailty scale Score ≥ 3
Described above Postoperative mortality or major morbidity 7-item expanded CHS frailty scale CHS + scale cognitive impairment + depressed mood
4-item MSSA frailty scale
Gait speed, handgrip strength, inactivity, cognitive impairment 5-m gait speed F: Time ≥6 secs Cooper et al., 2016 (32) 415 (CHS:368 vs 47) or (FI: 329 vs 86) 76.8 +/- 5.2 Fe – 250 (60) M – 165 (40) Orthopedic surgery
CHS frailty scale Described above Postoperative medical and surgical
complications, hospital LOS greater than 5 days Frailty Index 42 individual deficit
measures that were part of the baseline study
37 Kristjansson et al., 2010 (29) 178 (157 vs21) 79.6 +/- 5.7 Fe – 102 (57) M – 76 (43) Colorectal cancer surgery CGA F: Score ≥ 1
Personal ADL; IADL; Mini Nutritional Assessment; Mini Mental State Examination; Geriatric Depression Scale Postoperative mortality or major morbidity Kristjansson et al., 2012 (45) 176 (CHS: 106 vs 70) or (CGA: 155 vs 21) 79.6+/- 5.7 Fe – 101 (57) M – 75 (43) Colorectal cancer surgery
CHS Frailty scale Described above Postoperative mortality or major morbidity (30 days after surgery) CGA F: Score ≥ 1 Described above Li et al., 2016 (75) 189 (50 vs 139) 62 (19-86) Fe – 76 (40) M – 113 (60) Major surgical intervention for urologic, general surgical, or surgical oncology illness CHS Frailty scale F (0-1 score) IF (2-3 score) F (4-5 score)
Described above 1-y mortality
Makary et al., 2010 (79) 594 (248 VS 346) F: 76 (65-94) IF: 75 (65-92) NF: 71 (65-94) Fe – 358 (60) M – 236 (40) Elective surgery (major procedure, intra-abdominal procedure, procedure for cancer) CHS Frailty scale F (0-1 score) IF (2-3 score) F (4-5 score)
Described above Postoperative complications; LOS Marshall et al., 2016 (80) 123 (17 vs 106) 77.1 (70-92) Fe: 38 (31) M-85 (69)
Cardiac surgery Marshall score
F (0-1 score) IF (2-3 score) Biochemical markers: serum creatinine; hypoalbuminemia; hematocrit. 5 self-reported markers of frailty: falls; assistance in
Hospital mortality, deep sternal wound infection, discharge to another care facility; LOS
38 F (≥ 4 score) their ADL; exhaustion; low
physical activity;
unintentional weight loss. 3 physical assessments: walk 5 m; time taken to rise 3 times from a standardized chair with armrests (>11s) grip strength. Robinson et al., 2013 (68) 201 (96 vs 105) 74+/-6 Fe – 5 (2) M – 196 (98) Elective colorectal or cardiac surgeries Robinson score NF: Score 0-1 borderline: Score 2-3 F: Score ≥4
TUG; Katz Score; Mini-Cog; Charlson Index; Anemia; Poor nutrition; Falls
Postoperative complications Robinson et al., 2013 (70) 272 (189 vs 83) 74 +/- 6 Fe – 6 (2) M – 266 (98) Elective colorectal or cardiac surgeries TUG Fast: ≤10s Intermediate:11-14s Slow: ≥15s
Measures the time needed to stand up from a chair, walk 10 ft, return to the chair, and sit
Postoperative complications and mortality
39 Sundermann et al., 2011 (24) 213 (114 vs 99) 80.1 +/- 4 Fe – 103 (48) M – 110 (52) Cardiac surgery CAF NF: 1-10 MF: 11-25 SF: 26-35
Combines values from Fried + CFS + disability + balance + blood One-year mortality Sundermann et al., 2011 (59) 400 (201 vs 199) 80.3 +/-4 Fe – 206 M – 194 Cardiac surgery CAF NF: 1-10 MF: 11-25 SF: 26-35
Described above 30-day mortality
Sundermann et al., 2014 (30) 450 (220 vs 230) or (281 vs 169) 79 +/- 4 Fe – 223 (50) M – 227 (50)
Cardiac surgery CAF
FORECAST NF: 0-4 MF:5-7 SF:8-13
Described above.
Measures ability to rise from a chair x3, subjective reported
weakness, stair climb, CFS, serum creatinine level
One-year mortality
30 days mortality
Tan et al., 2012 (48)
83 (23 vs 60) 81.5 (75-93) n.d Colorectal surgery CHS Frailty scale Described above Postoperative major complications; mortality within 30 days of surgery
Legend: mean age +/- standard deviation; mean age (range years); ADL – activity daily living; IADL- instrumental activity daily living; F – frailty; NF – Not frail; IF – intermediately frail; MF – Moderately frail; SF – severely frail; Fe – Female; M – Male; CABG – coronary artery bypass graft; LOS – length of stay; CHS – Cardiovascular Health Study; MSSA- MacArthur Study of Successful Aging; GS – gait speed; CGA – comprehensive geriatric assessment; TUG – timed Up-and-Go; CAF - Comprehensive Assessment of Frailty; FORECAST - Frailty predicts death One year after Cardiac Surgery Test; CFS – Clinical frailty scale; n.d – not defined
40
QUALITY ASSESSMENT
Table 6 summarizes the quality assessment of the 15 included articles. Scores ranged from 10 to 16 with a median value of 12. Every study had a clearly stated aim and had endpoints appropriate to the aim of the study. Only one study(78) filled all the criteria. Furthermore, the unbiased (blinded) assessment of the study endpoint was not clear for the most of studies, only two studies have unbiased assessment of the study endpoint clearly defined(67, 78).
41 Table 6 – Results of the MINORS(77) quality assessment
Legend: 0 – not reported; 1 – reported but inadequate; 2 – reported and adequate Clearly stated aim Inclusion of consecutive patients Prospective collection of data Endpoints appropriate to the aim of the study Unbiased assessment of the study endpoint Follow-up period appropriate to the aim of the study Loss to follow-up <5% Prospective calculation of the study size Total Ad et al., 2016 (51) 2 2 0 2 0 2 2 2 10 Afilalo et al., 2010 (67) 2 2 2 2 2 0 2 2 14 Afilalo et al, 2012 (78) 2 2 2 2 2 2 2 2 16 Cooper et al, 2016 (32) 2 1 1 2 0 2 0 2 10 Kristjansson et al, 2010 (29) 2 1 2 2 0 2 2 2 13 Kristjansson et al, 2012 (45) 2 2 0 2 0 2 2 2 12 Li et al, 2016 (75) 2 1 2 2 0 2 2 2 13 Makary et al, 2010 (47) 2 0 2 2 0 2 0 1 10 Marshall et al, 2016 (61) 2 2 1 2 0 0 1 2 10 Robinson et al, 2013 (70) 2 0 2 2 0 2 2 0 10 Robinson et al, 2013 (68) 2 0 2 2 0 2 2 2 12 Sundermann et al, 2011 (59) 2 2 2 2 0 2 0 1 11 Sundermann et al, 2011 (24) 2 2 1 2 0 2 0 2 11 Sundermann et al, 2014 (30) 2 2 1 2 0 2 0 2 11 Tan et al, 2012 (48) 2 2 2 2 0 2 2 1 13
42
PREVALENCE OF FRAILTY
The prevalence of frailty, as assessed by each frailty tool, is described in Table 7. A total of 11 different tools was used for evaluation of frailty. Seven studies used CHS frailty scales, three used single-item scales (gait speed and TUG), and nine studies used multi-domain frailty scales. The mean proportion of patients categorized as being frail was 55.4±20.0%, and ranged from 13.82%(80) to 88.67%(32). Less variation on the prevalence was found in studies using single-item frailty scales. Four studies (29, 30, 45, 78) used different frailty scales in the same population in order to compare their predictive value and also obtained different prevalence rates: Afilalo et al. (78) found a prevalence of frailty of 19.74% and 46.05% when using CHS frailty scale and gait speed only, respectively; Cooper et al. (32) found a prevalence of 88.67% and 79.28% when using CHS frailty scale and Frailty index, respectively; Kristjansson et al. (45) found a prevalence of 60.23% and 88.07% when using CHS frailty scale and CGA, respectively; Finally, Sundermann et al.(30) found a prevalence of 48.88% and 62.44% when using CAF and FORECAST, respectively. The biggest variation was obtained in Kristjansson et al.’s(45) study when using CHS frailty scale and CGA.
43 Table 7 – Prevalence of frailty
Frailty scale Total (n) Frail (n) Not-Frail
(n)
Frailty prevalence (%)
CHS frailty scale (5-items) Ad et al., 2016 (51) Afilalo et al., 2012(78) * Cooper et al., 2016(32) * Kristjansson et al., 2012 (45) * Li et al., 2016 (75) Makary et al., 2010 (79) Tan et al., 2012 (48) Total 166 39 127 23.49 152 30 122 19.74 415 368 47 88.67 176 106 70 60.23 189 50 139 26.46 594 248 346 41.75 83 23 60 27.71 1775 864 911 48.68
Single-item frailty scales
Afilalo et al., 2010 (gait speed)(67) Afilalo et al., 2012 (gait speed)(78) * Robinson et al., 2013 (TUG)(68) Total
131 60 71 45.80
152 70 82 46.05
272 189 83 69.49
555 319 236 57.47
Other multi-domain frailty scale Cooper et al., 2016 (FI) (32)
Kristjansson et al., 2010 (CGA) (81) * Kristjansson et al., 2012 (CGA) (45) * Marshall et al., 2016 (Marshall score) (80) Robinson et al., 2013 (Robinson score) (70) Sundermann et al., 2011 (CAF) (24) Sundermann et al., 2011 (CAF)(59) Sundermann et al., 2014 (CAF) (30) * Sundermann et al., 2014 (FORECAST) (30) *
Total 415 329 86 79.28 178 157 21 88.20 176 155 21 88.07 123 17 106 13.82 201 96 105 47.76 213 114 99 49.57 400 201 199 50.25 450 220 230 48.88 450 281 169 62.44 2606 1570 1036 60.02
Legend: *Studies that compared the ability of different frailty scales to predict the risk of adverse outcomes in the same population; TUG – Timed Up-and -Go; FI – Frailty index; CGA – comprehensive geriatric assessment; CAF - comprehensive assessment of frailty; FORECAST - Frailty predicts death One year after Cardiac Surgery Test.
44
MORBIDITY or COMPLICATIONS
The association of frailty and occurrence of any postoperative complications (defined by Society for Thoracic Surgery or National Surgical Quality Improvement
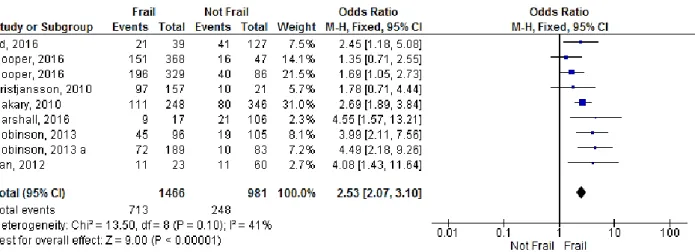
Program) after surgery was reported in 8 studies(29, 32, 47, 48, 51, 61, 68, 70). Only in two of these studies (29, 32) the pooled OR was not significantly higher in frail patients. The OR was 1.35 (95% CI: 0.71-2.55; p=0.36) in Cooper et al.’s study(32) with CHS frailty scale and 1.78 (95% CI: 0.71-4.44; p= 0.22) in Kristjansson et al.’s study (29). The cumulative analysis showed a significant association of frailty with postoperative complications (OR=2.53, 95% CI: 2.07-3.10; p<0.00001) and the heterogeneity was found to be moderate (I2=41%; p=0.10) (Figure 3).
45
The identification of the most common postoperative complications were reported in 5 studies (24, 51, 62, 67, 68, 70). None of these studies showed significant association between frailty and the risk of renal failure, neurological complications or cardiac complications. The risk of respiratory complications and wound infection was significantly increased in frail persons assessed by both multi-domain(70) (OR=5.99, 95% CI: 1.28-28.07, p=0.02 and OR=2.44, 95% CI: 1.14-5.23, p=0.02, respectively) or single-item scale(68) (OR=18.01, 95% CI: 1.07-302.58, p=0.04 and OR= 3.39, 95% CI: 1.46-7.89, p=0.005, respectively). The risk of sepsis was assessed in two studies(70) (68) but was significantly increased only in one study using a single-item scale(68) (OR=8.10, 95% CI: 1.06-61.95, p=0.04). The pooled OR for association between frailty and each postoperative complication was 5.03 (95% CI: 1.74 – 14.54, p=0.003; I2= 0%, p=0.78) for renal failure (Figure 4 - A), 3.41 (95% CI: 1.08-10.73, p=0.04; I2= 0%, p=0.96) for neurological complications (Figure 4 - B), 9.21 (95% CI: 2.35-36.02, p=0.001; I2= 0%, p=0.47) for respiratory complications (Figure 4 - C), 2.46 (95% CI: 0.98-6.15, p=0.05; I2= 53%, p=0.12) for cardiac complications (Figure 4 - D), 2.85 (95% CI: 1.65-4.94, p=0.0002; I2= 0%, p=0.84) for wound infection (Figure 4 - E) and 3.84 (95% CI: 1.37-10.71, p=0.01; I2= 16%, p=0.28) for sepsis (Figure 4 - F). Frailty was significantly associated with all the above mentioned complications, except for cardiac complications, which was more likely due to the methodological differences as heterogeneity was high. No subanalysis of complications by scale was possible due the limited number of studies.
As shown in Table 8, the risk of postoperative complications was more frequently assessed by the Frailty Phenotype scales(32, 48, 51, 79), followed by multi-domain frailty scales(32, 79, 81), and, less frequently, by single-item frailty scales(68). All these instruments were able to predict the risk of developing postoperative complications. Subgroup analysis was not possible as the outcomes evaluated differed between studies.
46 Figure 4 - Forest plot showing the effect of frailty on the occurrence of the different postoperative complications, according to OR: A) renal complications; B) neurological complications; C) respiratory complications; D) cardiac complications; E) wound infection; and F) Sepsis.
A B C D F E
47 Table 8 – Frailty scales and prediction of postoperative complications
Frailty assessment
Studies Participants Statistical Method Effect Estimate p Heterogeneity (I2) p Frailty Phenotype scale 4 1258 OR (95% CI) 2.39 (1.81 - 3.14) <0.00001* 34% 0.21 Single-item frailty scales 1 201 OR (95% CI) 3.99 (2.11 - 7.56) <0.00001* n.a n.a Other multi-domain frailty scales 3 716 OR (95% CI) 1.93 (1.31 - 2.86) 0.001* 29% 0.25
Legend: OR: Odds Ratio; CI: Confidence interval; n.a - not applicable; *p value was significant
MORTALITY
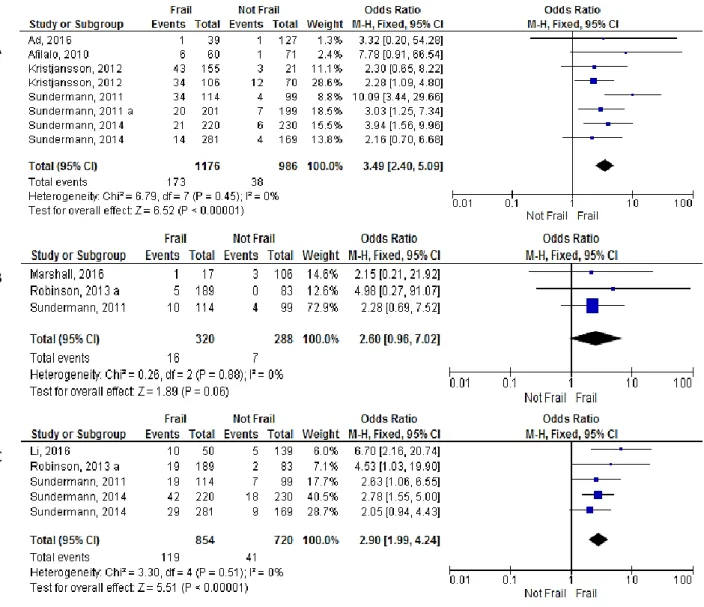
The association of frailty and occurrence of mortality until 30 days after surgery (Figure 5 A) was reported in 6 studies (24, 30, 45, 51, 59, 67) and was more frequently assessed by multi-domain frailty scales(30, 45, 59), , followed by Frailty Phenotype scale(45, 51) and lastly by single-item frailty scales(67). Individual analysis showed that 30-day mortality was significantly increased in four of these studies, using multi-domain scales: an OR=10.09 (95% CI: 3.44-29.66, p<0.01)(24) , OR= 3.94 (95% CI: 1.56-9.96, p=0.04)(30) and OR= 3.03 (95% CI: 1.25-7.34, p=0.01) (59) in the studies by Sundermann et al., using multi-domain scales; and an OR= 2.30 (95% CI: 0.65-8.22, p<0.01) in the study by Kristjansson et al. (45). The pooled OR was 3.49 (95% CI: 2.40-5.09, p<0.00001; I2=0%, p=0.45). Subanalysis by frailty scale showed that frail patients identified by the FP or multi-domain are greater significant risk of mortality (Table 9). (24, 68, 80)
1- year mortality (Figure 5 C) was reported in 4 studies(24, 30, 68, 75) and a significant association with frailty was found in three: Li et al. (75) found an OR=6.70 (95% CI: 2.16-20.74, p=0.001) using the CHS scale; Sundermann et al. (2011) (24) found an OR=2.63 (95% CI: 1.06-6.55, p=0.04) using multi-domain scale; and Sundermann et al. (2014) (30) found an OR=2.78 (95% CI: 1.55-5.00, p=0.006) using multi-domain scale. The cumulative analysis showed an OR was 2.90 (95% CI: 1.99-4.24, p<0.00001; I2=0%, p=0.51).
48
Hospital mortality (Figure 5 B) was reported in 3 studies (24, 68, 80) and none of them showed significant predictive value of frailty. The pooled results also showed a non-significant cumulative OR of 2.60 in frail patients (95% CI: 0.96-7.02, p=0.06; I2=0%, p=0.88).
Figure 5 – Forest plot showing the effect of frailty on mortality, according to OR: A) mortality until 30 days after surgery; B) in hospital mortality after surgery; C) 1-year mortality after surgery;
A
B
49 Table 9 – Frailty scales and prediction mortality until 30 days.
Legend: OR: Odds Ratio; CI: Confidence interval; n.a – not applicable; *p value was significant. Frailty
assessment
Studies Participants Statistical Method Effect Estimate p Heterogeneity (I2) p Frailty Phenotype scale 2 342 OR (95% CI) 2.33 (1.13 - 4.79) 0.02* 0% 0.80 Single-item frailty scales 1 131 OR (95% CI) 7.78 (0.91 - 66.54) 0.06 n.a n.a Other multi-domain frailty scales 3 1289 OR (95% CI) 4.17 (2.45 - 7.09) <0.00001* 37% 0.19
50
HOSPITAL LENGTH OF STAY
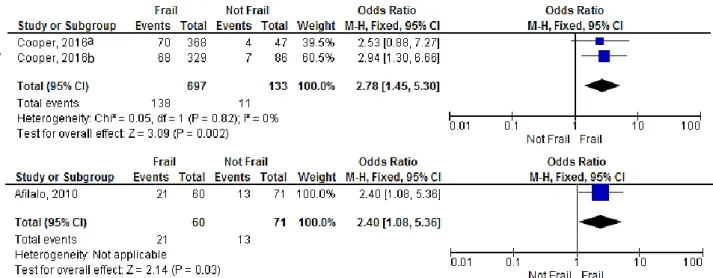
The association of frailty and LOS after surgery was determined in two studies (32, 67). In the first, hospital LOS was defined as “> 5 days” and the authors assessed this outcome according to the frail status given by two different frailty scales for the same patient’s population (FP and FI scales). The pooled OR for association between frailty and hospital LOS (> 5 days) using FP scale was 2.53 (95% CI: 0.88-7.27; p=0.09) and using FI was 2.94 (95% CI: 1.30-6.66; p=0.01) (Figure 6 A). Their combined effect resulted in a OR of 2.78 (95% CI: 1.45-5.30, p=0.002; I2=0, p=0.82), suggesting a significant association between frailty and duration of hospital stay. In a second study, hospital LOS was defined as “> 14 days”. The pooled OR for association between frailty and hospital LOS (> 14 days) was 2.40 (95% CI: 1.08-5.36) (Figure 6 B). No subanalysis was possible.
Figure 6 - Forest plot showing the effect of frailty on hospital length of stay, according to OR: A) comparison of the predictive effect of LOS (> 5 days) in frail patients as assessed by 2 different frailty scales (a-FP and b-FI scales) B) Predictive effect of frailty assessed by gait speed in the LOS (> 14 days)
a b A
51
DISCUSSION
This systematic review and meta-analysis aimed to evaluate the utility of different frailty scales in the prediction of negative postsurgery health outcomes. Although several assessment tolls (ie, definitions) of frailty were used, available data shows that being frail is associated with higher risk of postsurgery complication, mortality and hospital length of stay.
Frailty is increasingly being recognized as an important predictor of patient outcomes. The geriatrics literature has conceptualized frailty as a loss of physiologic reserve leading to increased vulnerability to stressors, such as surgery. Although the approaches used to measure frailty differ across the literature, virtually all seek to capture some element that suggests decreased physiologic reserve in order to identity those individuals at increased risk(82). Identifying those at risk for frailty is important for improving patient outcomes and may provide a window of opportunity to prevent or slow the progression to disability(83) . As previously noted(34, 84), we report that the overall prevalence of frailty is high (average of 55.4%) but it shows important variations between studies (range from 13.82% to 88.67%). While different features of the population in study could explain such diversity, this was also verified when different scales were used in the same population. For instance, in the study from Kristjansson et
al. (45), frailty prevalence was 60.23% when using the CHS frailty scale and 88.07% when using the CGA scale. In another study, Belga et al. (13) compared the CFS, CHS frailty scale and TUG in the same population and found a frailty prevalence of 33%, 22% and 18%, respectively. This indicates that the classification of an individual as frail may change according to the toll in use, which has obvious implications in clinical decisions based on frailty status like to proceed or not with surgery. Thus, the findings from our meta-analysis support the urgent need to standardize a toll to measure frailty.
Despite the variability in tolls and prevalence, the concept that it leads to poor outcome following surgery was corroborated by our meta-analysis. Compared with not-frail patients, not-frail individuals were more likely to have postoperative complications as previously noted(85). Of note, postoperative complications were predicted by FP scales,