U
NIVERSIDADE DEL
ISBOAF
ACULDADE DEM
OTRICIDADEH
UMANAT e a m s ’ c o o r d i n a t i o n d y n a m i c s r e v e a l s
p e r f o r m a n c e o u t c o m e s o f o p e n p l a y a t t a c k s i n
p r o f e s s i o n a l s o c c e r
Dissertação elaborada com vista à obtenção do Grau de Mestre em Treino de Alto Rendimento
Orientador: Professor Doutor Ricardo Filipe Lima Duarte
Júri:
Presidente
Professor Doutor António Paulo Pereira Ferreira Vogais
Professor Doutor Ricardo Filipe Lima Duarte Professor Doutor Luís Pedro Camelo Vilar
João Pedro Carriça Frutuoso 2013
Table of contents Abstract ... 1 Resumo ... 2 Introduction ... 3 Methods... 6 Sample ... 6 Reliability ... 8
Positional Data Collection ... 8
Compound Variables ... 9 Data Analysis ... 10 Results ... 12 Discussion ... 17 Conclusions ... 20 References ... 21
Tables List
Table 1. Beginning of the ball possession criteria according to Reis et al. (2013). ... 7 Table 2. Mean and standard deviation values of all compound variables for attacking and defending teams according to defensive and attacking success. ... 12 Table 3. Mean, standard deviation of Pearson correlations and significant value from the spatial interaction of teams in the sequences of open play ending with defensive success and attacking success. ... 13 Table 4. Effects of the success of the teams in the relative phase modes of coordination, divided by quarters. ... 16
Figures List
Figure 1. Relative phase histograms (%) of surface area, stretch index, length and width. Left panels show sequences ending with defensive success while right panels show sequences ending with attacking success. ... 14
Abstract
The aim of this study was to examine whether teams’ coordination dynamics reveals the success of the attacking and defending performance outcomes. The players’ trajectories from 8 matches were recorded, 242 open play attacks ending in defensive success and 122 ending in attacking success were selected for analysis. Four compound variables (surface area, stretch index, length and width) were used to capture the overall teams’ dispersion behaviors during each play. The results showed that attacking teams presented larger values than the defending teams. Only the width measure revealed significant superior values for both teams when the attacks ended with defensive success. The positive correlations values between teams in every measure showed that, teams spent most of the time contracting and expanding together. However, only the length correlation value presented significant higher values when attacks ended with attacking success than defensive success. The relative analyses showed an equal distribution across every mode of coordination between teams when the attacks ended with defensive success. A lead-lag relation was observed when attacks ended in attacking success, with defending teams temporally leading the spatial contraction-expansion relationship. Findings suggest that attacking teams succeed when break symmetry with defending teams, exploiting subtle temporal lags in coordination between teams.
Key words: Performance analysis, Association Football, team success, surface area, stretch index, length, width, relative phase, dispersion behaviors, multi-camera tracking system.
Resumo
O objetivo deste estudo foi examinar se a coordenação dinâmica das equipas revela sucesso atacante e defensivo. As trajetórias dos jogadores foram capturadas de 8 jogos e foram selecionados 242 ataques terminados em sucesso defensivo e 122 em sucesso ofensivo. Para capturar os comportamentos de dispersão das equipa em cada jogada, utilizaram-se 4 variáveis de dispersão (área de equipa, stretch index, comprimento e largura). Os resultados mostraram que a equipa atacante apresenta valores superiores à equipa defensora. Apenas a largura revelou valores superiores significantes para as duas equipas em ataques de sucesso defensivo. Os valores de correlação positivos entre as equipas revelam que as duas equipas contraem e expandem ao mesmo tempo. Contudo, apenas a correlação do comprimento apresentou valores significantes superiores nos ataques terminados em sucesso atacante do quem em sucesso defensivo. As análises relativas mostraram uma distribuição igual entre equipas ao longo de cada modo de coordenação, quando os ataques terminaram em sucesso defensivo. Observou-se uma relação de "lead-lag" quando os ataques terminaram em sucesso atacante, com a relação espacial de contração-expansão a ser liderada temporalmente pela equipa defensora. Os resultados sugerem que o sucesso das equipas atacantes surge de uma quebra de simetria com as equipas defensoras, explorando atrasos temporais subtis na coordenação entre equipas.
Palavras chave: Análise da Performance, Futebol, Sucesso de Equipa, Área de Equipa, Stretch Index, Comprimento, Largura, Comportamentos de dispersão, Sistema de tracking multi-cameras.
Introduction
In the last few years the performance analysis of sports’ teams as collective systems has increased, contributing for the current understanding about the dynamics featuring teams’ behaviors (e.g., Frencken et al., 2012; Moura et al., 2012; Bartlett et al., 2012). The development and validation of several motion-tracking systems were influential to allow capturing the players’ movement trajectories on-field. Besides, the development and use of key compound positional variables is an important requisite to investigate team coordination behaviors of sports teams, since they synthesize at the collective system level the high-dimensional information emerging from the multiple interactions between players’ on the field (Duarte et al., 2012a; Duarte et al., 2013).
Maybe due to methodological concerns, the first studies on soccer using tracked positional data focused on the analysis of small-sided games. Frencken et al. (2011) investigated 4-a-side games and found that in 10 out of 19 scored goals, the centroid of the attacking team crosses the centroid of the defending team. This feature was also confirmed by Duarte et al. (2012b) in 3-a-side games near the scoring zone. One important question that challenged researchers was the extent to what these findings could be generalized for full-size games formats featuring the competitive performance settings. Bartlett et al. (2012) found no evidence of the centroids crossing in the 11-a-side game format.
Also on 11-a-side competition, Moura et al. (2012) investigated Brazilian teams’ coverage area and spread on the pitch while attacking and defending. These authors found somewhat unclear results with compression of both the defending and attacking teams being beneficial to performance in those plays. So, it was not possible to understand the association between teams’ behaviors and the performance outcomes. Based on visual inspection of time-series data, authors speculated on a possible counter-phase relation between teams in terms of
dispersion values. However, their analyses did not consider the coordination dynamics between teams.
Taking these limitations, Bartlett et al. (2012) examined the degree of linear association between teams’ behaviors (abusively mentioned as capturing teams’ coordination dynamics) in selected open plays ending in a shot at goal or in a tackle situation. Their findings shed important light on earlier results and speculations of Moura et al. (2012) showing that the teams contracted and expanded their collective movements in a relatively synchronized way, and not in a counter-phase relation. Bartlett et al. (2012) found also few differences in teams’ spatial interaction dynamics for open play situations ending with defensive or offensive success. However, as the authors used Pearson product moment correlations to analyze the global degree of linear association between teams, it can be speculated that relevant parameters other than mean and variance were not captured in their analyses of teams’ spatial interactions. Recent evidence from Moura et al. (2013) stressed this idea by showing how the use of other analysis methods such as spectral analyses revealed significant changes in the frequency of teams’ contraction/expansion movements between game halves. So, Bartlett et al. (2012) suggestions that team dispersion measures are not sensitive enough to signify critical events such as goals or a turn-over in possession might derive from a lack of exploration of nonlinear measures. Some of these measures (e.g., relative phase) have been suggested in literature as appropriate to capture the structure underlying the spatial-temporal dynamics of interpersonal interactions in invasive team sports (Glazier, 2010; Vilar, Araújo, Davids & Button, 2012b).
For example, Duarte et al. (2012c) conducted an investigation on 1-vs-1 sub-phases in youth soccer using relative phase analysis. Data showed a lead-lag in the attacker-defender relation when the defender achieved the success of the contesting plays. In these cases, the defender moved before the attacker anticipating his movements. When the attacker succeeds,
players presented a trend for an in-phase relation, which means they moved synchronously together. These findings showed that, at the 1-vs-1 level, the success was associated to different patterns of interpersonal coordination. One unanswered question about teams’ coordination dynamics is to ascertain whether distinct modes of coordination between teams result in different performance outcomes, resembling the earlier findings of Duarte and colleagues in 1-vs-1 sub-phases of soccer.
With this study we aimed to examine whether teams’ coordination dynamics reveals the success of the attacking and defending performance outcomes during the open play attacks. Based on previous literature review (Moura et al., 2012; Bartlett et al., 2012; Duarte et al., 2012c) we hypothesized that:
1. The defending team should present lower dispersion values than the attacking team, independently of the success achieved in the open play attack; Besides, there would be no significant differences in the teams’ dispersion mean values between open play attacks ending with defensive success and attacking success; 2. There would be no significant differences in the teams’ contractions-expansion
correlation pattern between open play attacks ending with defensive success and attacking success;
3. Significant differences in teams’ coordination dynamics (assessed with nonlinear measures) should predict the teams’ success in the open play attacks.
Methods
Sample
A total of 364 open play attacks were selected from 8 English Premier League matches contested in the 2010/2011 season. These matches involved a common reference team in order to minimize potential uncontrolled interaction effects. Moreover, the matches were selected to ensure a balanced design in respect to match location (4 at home and 4 away) and opponent team level to prevent from bias due the reported effects on literature for these situational variables (e.g., Lago & Martin, 2007). The opponent team level was determined based on the league table at the time that the teams met each other. The first six teams from the league table were considered as strong teams, and the last six teams were considered as weak teams.
To allow comparisons with previous studies (e.g., Moura et al., 2012; Bartlett et al., 2012) we selected only open play attacks, having been excluded set plays (e.g., free kicks, corners). However, a problem may arise, since some set plays can originate open plays. A free-kick near the goal area is usually performed with the intention to score a goal, and there is a different spatial concentration and positioning of the team. On the other hand, if the free-kick occurred in the defensive midfield it is most likely that the team, instead of play a long ball into the area, give preference to the offensive organization and build up, creating an open play. The same can occur with throw-ins and goal kicks. In these cases, we considered an open play when we could confirm the necessary criteria for the beginning of ball possession (see Table 1), which was built by Reis and colleagues (2013) based on technical literature (e.g. Castelo, 1996).
The beginning of the open plays occurred when the team complied the beginning of ball possession criteria and that the end of these plays occurred when any of the end of the
ball possession criteria was fulfilled. As our purpose was to compare groups of open plays ending with defensive success and open plays ending with attacking success, the end of the open plays was inspected based on well-defined criteria based on previous studies (Bartlett et al., 2012) and, also, in the technical literature (Castelo, 2008). So, the groups of open play attacks were divided into:
1) Ending with defensive success – in which the lost of ball possession by the attacking team occurred through a wrong pass, tackle or ball interception. According to Bartlett et al. (2012), only plays in which the wrong pass, tackle or interception occurred between the location of the farther shot and the goal line, were counted/selected for analysis. 2) ending with attacking success – in which the open play attack ended with a goal, a shot on goal saved by the goalkeeper, or other shooting actions (out of goal) with the ball leaving the final line. See the Appendix section for objective and detailed technical definitions for every action relevant for our classification system.
Table 1. Beginning of the ball possession criteria according to Reis et al. (2013).
In keeping with these procedures, the 8 matches were video inspected by notating the time of beginning and end of open play attacks, as well as the corresponding group of plays
Criteria Description
Number of Passes
- We considered 1 pass as long as it followed by ball conduction with number > 3 touches.- We considered 2 passes as long as they are followed by ball conduction with number > 2 touches.
- We considered > 2 passes.
Ball Conduction
- If performed after pass, see the previous criterion. - We consider the number of touches > 4
Time - It is considered this criterion if none of the above are verified, but the
for where each one belonged. Each play was observed more than once, frame by frame, ensuring the accurate register of the plays’ time and the criteria interpretation. At the end, from the 364 overall open play attacks we coded 242 situations ending with defensive success and 122 situations ending with attacking success.
Reliability
To test intra-observer reliability we selected all the open play attacks (n=67, 18,4% of the sample) from the match that more contributed for the sample. These plays were observed twice. The time of open play attacks were assessed for reliability using the coefficient of reliability proposed by Goto and Mascie-Taylor (2007). Data showed a large degree of consistence in the two observations with values of the coefficient of reliability higher than 99%. Also, no changes were observed on the groups of open plays regarding their success/outcome.
Positional Data Collection
The movement trajectories of every player were captured with a video-based,
multi-camera tracking system ProZone3® (ProZone Sports Ltd, Leeds, UK). This system was
validated by Di Salvo and colleagues (2006). Eight to twelve cameras were used (Vicon Surveyor 23xcameras dome/SVFT-W23) at the top of the stadiums, in order to cover the whole field. All the cameras are linked to a central point and connected to a video distribution box, which distribute each video in three ways: for a primary capture equipment, for a reservation capture equipment and for a telemetry unit.
After the capture, the video files were sent to specialized servers that recognized the new files and began the automatic tracking. Each file was treated individually. When the tracking was finished all the information was automatically collected and stored in a single
combined file. Then, the video co-ordinates were converted on world pitch co-ordinates using a calibration process.
Finally, the data was confirmed through a quality control process, in which operators identified each player and their trajectories, manually correcting the tracking markers, if necessary (Di Salvo et al., 2006). After these procedures, we obtained output spreadsheet files containing every player’s co-ordinates (x, y) synchronized with a timestamp at a sampling rate of 10 Hz.
Compound Variables
In order to capture team coordination in terms of whole dispersion/contraction movements we have reviewed literature from previous studies (e.g., Moura et al., 2012; Duarte et al., 2012a; Bartlett et al., 2012). Based on the lack of sensitivity to changes in the scoreline reported by Duarte et al. (2013) we excluded team centroid measures. Also, due the similarity between Frobenius norm and stretch index measures we choose the last measure because it is less prone to outliers (Bartlett et al., 2012). Thus, we selected four compound measures to capture distinct and complementary aspects of dispersion/contraction behaviors
at the team level. The surface area is a dispersion measure, that captures the total space (m2)
covered by teams, calculated using a convex hull polygonal area (Frencken et al., 2011). The stretch index was used by Yue et al. (2008) and was defined as the instantaneous radius of each team throughout the game. This is a radial measure calculated by averaging the distances (m) between all players to the geometrical centre of the team. The length represents the maximum longitudinal spread (m) of a team, calculated as the difference between the maximum and minimum positions of players in the field’s longitudinal dimension in each frame (Duarte et al., 2013). The width represents the maximum lateral spread (m) of a team, calculated as the difference between the maximum and minimum positions of players in the
field’s lateral dimension in each time frame (Duarte et al., 2013). These last two compound variables are one-dimensional measures capturing team stretching tendencies for specific longitudinal and lateral movements, while the others are two-dimensional measures implying both x and y spatial co-ordinates. The calculation of all compound variables did not include the goalkeepers position.
These variables were calculated for the two teams in all of the 8 matches, through
Matlab® (R2012b, The MathWorks Inc, Natick, USA) files specifically conceived for this
study. All variables data series were converted to 2 Hz to prevent for oversampling in nonlinear analyses (Lames et al., 2010; Duarte et al., 2013). Based on the previous video analyses, the players’ co-ordinates of each open play were identified originating an individual file for each sequence of play.
Data Analysis
The mean values of the four compound variables for each team, in each sequence of play were analyzed using a two-way ANOVA with Team and Success as between-participants factors. To verify the global linear association between attacking and defending teams’ dispersion behaviors we used the Pearson product-moment correlation. Next, we examined for differences in the correlation values between the sequences of play ending with defending and attacking success using the independent samples t-test.
To analyze the teams’ coordination dynamics the relative phase between all measures of the two teams was conducted using the Hilbert transform (Palut & Zanone, 2005; Bourbousson et al., 2010; Travassos et al., 2011). For data presentation we used frequency histograms forcing relative phase to be between -180º and 180º. To examine for differences in histograms frequency distributions, the spectrum of relative phase histograms were divided into quarters, considering: 1st quarter [-180º, 90º[; 2nd quarter [-90º, 0º[; 3rd quarter [0º, 90º[,
and; 4th quarter [90º, 180º[. For that, we used independent samples t-tests applied to the quarters of relative phase of all compound variables and testing for differences between open plays ending with defensive success and attacking success.
All the statistical analyses were performed using IBM® SPSS 19.0 software (IBM,
Inc., Chicago, USA). Significance level was maintained at p < .05 for all statistical procedures.
Results
Table 2 shows the mean and standard deviation values of each team coordination variable, both for attacking and defending teams and according with the success.
Table 2. – Mean and standard deviation values of all compound variables for attacking and
defending teams according to defensive and attacking success.
Defensive success Attacking success
Compound variables Attacking team Defending team Attacking team Defending team
Surface area (m2) 1151.97± 245.33 820.40±227.74 1113.86±227.87 780.33±245.23
Stretch index (m) 18.52±10.18 15.56±10.48 17.61±1.81 14.47±2.49
Length (m) 38.88±10.87 36.53±11.73 38.90±6.44 36.09±8.94
Width (m) 46.37±11.27 36.54±10.47 43.64±7.43 34.55±5.67
A two-way ANOVA revealed significant main effects of Team on all the compound variables: surface area, F(1,36)=567.70, p<0.001; stretch index, F(1,36)=660.83, p<0.001); length, F(1,36)=30.00, p<0.001; width, F(1,36)=615.41, p<0.001, with the attacking team displaying larger values of dispersion. There was also a significant main effect of Success on the width dispersion variable, F(1,36)=8.64, p<0.01. All the others compound variables showed no significant main effects for the Success: surface area, F(1,36)=3.81, p=0.05; stretch index, F(1,36)=3.31, p=0.7; length, F(1,36)=0.29, p=0.59.
Following Bartlett et al. (2012) approach we determined the Pearson correlation coefficients between attacking and defending teams in order to assess the overall direction of their linear association between teams. Table 3 presents the mean and standard deviations of the correlation values and the respective value of significance between groups of open play attacks ending with attacking and defensive success.
Table 3. Mean, standard deviation of Pearson correlations and significant value from the spatial interaction of teams in the sequences of open play ending with defensive success and attacking success.
* Significant differences at p < 0.05
Every compound variable has shown positive correlation values, which mean that teams spent most of the time contracting and expanding together. However, independent samples t-test revealed significant differences between Success only for the length correlations, t(290.58) = -2931, p <0.05. These data indicated that higher correlation values of teams’ length were observed when the attacking teams succeed (0.70±0.38) than when the defending teams succeed (0.57±0.47). However, no other differences were obtained between groups of plays.
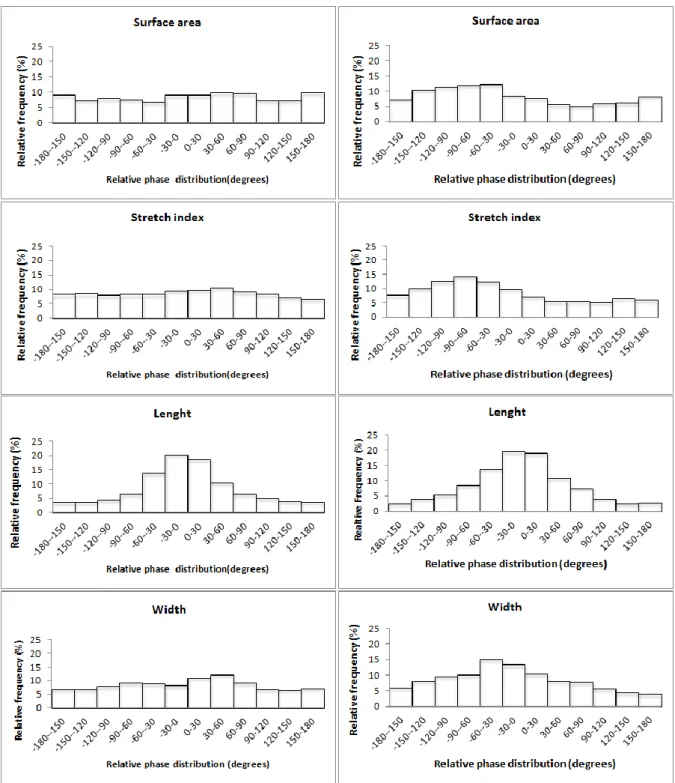
Since teams spent most of the time contracting and expanding together, it seemed interesting to see how this process occurs in terms of their coordination dynamics. Based on the relative phase analyses, we aggregated every sequence of play in frequency histograms for each compound variable contrasting sequences ending with defensive and offensive success (see Figure 1).
Defensive success Attacking success p value
Surface area 0.36 ± 0.53 0.37 ± 0.50 0.896
Stretch index 0.47 ± 0.51 0.51 ± 0.47 0.529
Length 0.57 ± 0.47 0.70 ± 0.38 0.004*
A preliminary analysis of histograms data suggested that teams’ lengths were similar in the two groups of sequences, showing a trend for an in-phase mode of coordination (i.e., both teams tended to contract and expand synchronously). On the other hand, preliminary
Figure 1. Relative phase histograms (%) of surface area, stretch index, length and width. Left panels show sequences ending with defensive success while right panels show sequences ending with attacking success.
analyses seemed to display different tendencies between groups for all the other compound variables. The sequences ending with defensive success resembled a flat/equal distribution tendency across all the spectrum of the histogram, while in the sequences ending with attacking success there seemed to be a lagged spatial interaction with the defending teams temporally leading the relationship.
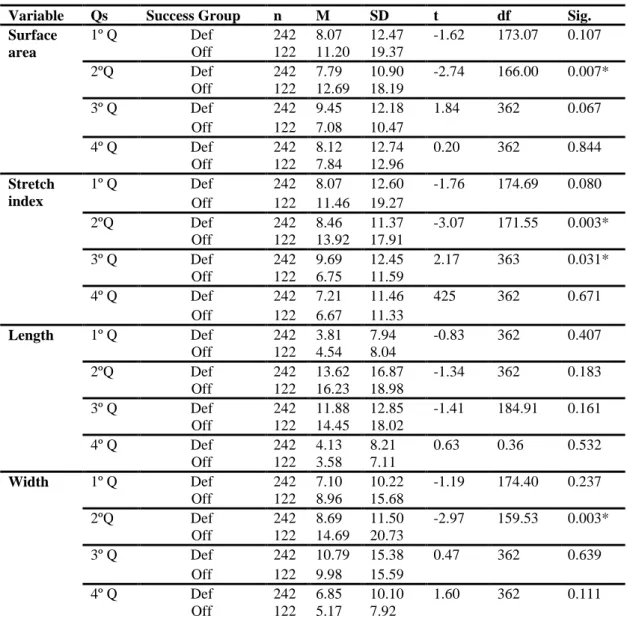
To examine for these differences in the frequency histograms we performed independent samples t-tests between groups of success, dividing the entire spectrum of relative phase in quarters (see Table 4).
Table 4. Effects of the success of the teams in the relative phase modes of coordination, divided by quarters.
Qs = relative phase quarters; 1ºQ = 1st relative phase quarter [-180º,-90º[; 2ºQ = 2nd relative phase quarter [-90º,0º[; 3ºQ = 3rd relative phase quarter [0º,90º[; 4ºQ = 4th relative phase quarter [90º,180º[, Def = defensive success group, Off = offensive success group, n = number of cases, M = mean, SD = standard deviation, t = t value, df = degrees of freedom, Sig. = p-value. * significant differences at p < 0.05
The results showed that there were significant differences (p < 0.05) mainly in the 2nd
quarter of the surface area, stretch index and width, but not in the length dispersion measure. Generally, sequences ending with attacking success had larger frequencies between -90º and 0º than when the defensive teams succeed. These data revealed a tendency for the defending team to change first its dispersion value and the attacking team to adjust then itself accordingly.
Variable Qs Success Group n M SD t df Sig.
Surface area 1º Q Def 242 8.07 12.47 -1.62 173.07 0.107 Off 122 11.20 19.37 2ºQ Def 242 7.79 10.90 -2.74 166.00 0.007* Off 122 12.69 18.19 3º Q Def 242 9.45 12.18 1.84 362 0.067 Off 122 7.08 10.47 4º Q Def 242 8.12 12.74 0.20 362 0.844 Off 122 7.84 12.96 Stretch index 1º Q Def 242 8.07 12.60 -1.76 174.69 0.080 Off 122 11.46 19.27 2ºQ Def 242 8.46 11.37 -3.07 171.55 0.003* Off 122 13.92 17.91 3º Q Def 242 9.69 12.45 2.17 363 0.031* Off 122 6.75 11.59 4º Q Def 242 7.21 11.46 425 362 0.671 Off 122 6.67 11.33 Length 1º Q Def 242 3.81 7.94 -0.83 362 0.407 Off 122 4.54 8.04 2ºQ Def 242 13.62 16.87 -1.34 362 0.183 Off 122 16.23 18.98 3º Q Def 242 11.88 12.85 -1.41 184.91 0.161 Off 122 14.45 18.02 4º Q Def 242 4.13 8.21 0.63 0.36 0.532 Off 122 3.58 7.11 Width 1º Q Def 242 7.10 10.22 -1.19 174.40 0.237 Off 122 8.96 15.68 2ºQ Def 242 8.69 11.50 -2.97 159.53 0.003* Off 122 14.69 20.73 3º Q Def 242 10.79 15.38 0.47 362 0.639 Off 122 9.98 15.59 4º Q Def 242 6.85 10.10 1.60 362 0.111 Off 122 5.17 7.92
Discussion
The aim of this study was to examine whether teams’ coordination dynamics reveals the success of the attacking and defending performance outcomes during open plays attacks. For that we formulated three specific aims inspired in recent literature. To the first aim we hypothesized that, in general, defending teams would have lower dispersion values than the attacking teams as previously shown by Moura et al. (2012). The results showed that regardless of their success, the attacking teams tended to keep up with a wider spatial organization than the defending teams. All compound positional variables consistently showed this trend. These results converged with Moura et al. (2012), who showed higher values of covered area and overall dispersion, in the Brazilian attacking teams compared to the defending teams.
In 11-a-side soccer games, such as in other invasive team sports, the two teams seem to have this natural tendency throughout the game for the attacking team to exhibit a wider spatial organization on the field, while the defending team usually displays less dispersion, as a consequence of trying to reduce the space available for opponent between the ball and the goal (Vilar et al., 2012a; Travassos et al., 2011, 2012).
As opposed to Moura et al. (2012) findings, our analyses revealed that only the teams’ lateral dispersion (i.e. width) presented significant differences between the open play attacks ending with defensive success and attacking success. While Moura et al. (2012) showed a trend for a compression of both teams to be linked to successful behaviors, the covered area and radial dispersion measures did not predict any differences in the current study with English Premier League players. Supposedly, these differences can be attributed to cultural constraints or styles of play associated to the two analyzed leagues (Brazil vs. England).
The second aim of this study was to examine the differences in the teams’ dispersion correlation values between open play attacks ending with defensive success and attacking success. Previous work from Moura et al. (2012) speculated that teams exhibit a counter-phase relation in terms of their contraction-expansion pattern. However, Bartlett et al. (2012) found positive correlations between the teams in all the used dispersion variables, which indicated that, on the contrary, teams tend to contract and stretch together in a synchronous or simultaneous pattern. In the current study, all compound dispersion variables showed positive correlations with values ranging from 0.4 to 0.7. Generally, our data agreed with Bartlett et al. (2012) findings suggesting that teams spent much of their time contracting and expanding together. It is also important to note that the weaker correlation value was found in the stretch index (r = 0.36 and r = 0.37) while the strongest correlation was found in the length (r = 0.57 r = 0.7). However, only the correlation between teams’ lengths showed significant differences between performances outcomes, with superior correlation values associated to the attacking success.
Although we can affirm that teams’ contract and expand together for a great part of the time, Pearson correlations coefficients are not sensitive enough to capture changes of magnitude and frequency of oscillation between two variables (Rosenblum, Cimponeriu & Pikovsky, 2006), which may mask the nonlinear relationship featuring the "true" coordination dynamics between teams. With this in mind, our third aim was to analyze whether the landscape of both linear and nonlinear coordination between teams could reveal which dynamics may underlie different performance outcomes for attack and defense. Based on the relative phase of each compound variable, frequency histograms aggregated the open play attacks with outcomes favorable for the defense and for the attack, separately.
With the exception of the coordination between team’s lengths, the coordination dynamics landscapes (revealed with relative phase histograms) showed different trends
between the outcomes for all the other compound variables. While the surface areas, stretch indexes and teams’ widths of open play attacks ending with an outcome favorable for defense displayed a tendency for a flat or equal distributions of relative phase values, when the outcomes favored the attack data showed a lead-lag relations shift to negative values. These results were confirmed using inferential statistics applied to relative phase quarters. These findings suggest that the outcomes favorable to the attacks are featured by defending teams spending some time leading the spatial interaction in relation to the attacking teams. In a functional interpretation, this data suggest that the defending team contract or expands itself first and the attacking team follows it with some delay. Our results differed from the ones found in the study of interpersonal coordination in 1-vs-1 sub-phases of soccer, which showed that in plays in which the defender succeed, he leaded the relationship with the attacker (Duarte et al., 2012c).
Synthesizing, our findings suggested that when the attacking team changes its organization with a slight delay compared to the defending team, probably taking advantage from it, the probability to achieve a scoring-opportunity or shot at goal increases. Possibly, in these open play attacks the attacking team causes or, at least, waits for a destabilization of the defending team spatial organization exploiting subtle temporal lags in coordination between teams. So, the apparent spatial leading of the defending team needs to be interpreted with some care in reference to the intentionality of both teams. Finally, the use of nonlinear measures in the current study contributed to clarify that team dispersion variables can be used to predict critical moments in play such as shots on goal and turn over in possession, contrary to what was argued by Bartlett and colleagues (2012).
Conclusions
This study aimed to examine whether teams’ coordination dynamics reveals the success of the attacking and defending performance outcomes during open play attacks. The results showed that defending teams presented lower dispersion values in all compound dispersion variables than the attacking team, independently of the success achieved in the open play attacks. No differences were found in the teams’ dispersion mean values between open play attacks ending with defensive success and attacking success. All correlation values of compound dispersion variables were positive, but only the correlation between teams’ lengths showed significant differences between performances outcomes, with superior correlation values associated to the attacking success. Using relative phase analysis (a nonlinear measure), we found significant differences in the teams’ coordination dynamics underlying different performance outcomes.
References
Bartlett, R., Button, C., Robins, M., Dutt-Mazumder, A., & Kennedy, G. (2012). Analysing Team Coordination Patterns from Player Movement Trajectories in Soccer: Methodological Considerations. International Journal of Performance Analysis in Sport 2012, 12, 398-424
Bourbousson, J., Sève, C., & McGarry, T. (2010). Space-time coordination dynamics in basketball: Part 2. The interaction between the two teams. Journal of Sports Sciences, 28: 3, 349 — 358.
Castelo, J. (1996). Futebol – A organização do jogo. (pp.127 – 189). Edição do Autor.
Castelo, J. (2008). Futebol – A organização dinâmica do jogo. (pp.261-345). Edição do Autor.
Di Salvo, V., Collins, A., McNeill, B., & Cardinale, M., (2006). Validation of Prozone ®: A new video-based performance analysis system. International Journal of Performance Analysis in Sport, 6 (1), 108 – 119.
Duarte, R., Araújo, D., Correia, V., & Davids, K. (2012a). Sports Teams as Superorganisms - Implications of Sociobiological Models of Behaviour for Research and Practice in Team Sports Performance Analysis. Sports Med 2012; 42 (8): 633-642.
Duarte, R., Araújo, D., Freire, L., Folgado, H., Fernandes, O., & Davids, K. (2012b). Intra- and inter-group coordination patterns reveal collective behaviors of football players near the scoring zone. Human Movement Science 31 (2012) 1639–1651.
Duarte, R., Araújo, D., Davids, K., Travassos, B., Gazimba, V., & Sampaio, J. (2012c). Interpersonal coordination tendencies shape 1-vs-1 sub-phase performance outcomes in youth soccer, Journal of Sports Sciences, 30:9, 871-877.
Duarte, R., Araújo, D., Folgado, H., Esteves, P., Marques, P., & Davids, K. (2013). Capturing complex, non-linear team behaviours during competitive football performance. J Syst Sci Complex (2013) : 1-11.
Frencken, W., Lemmink, K., Delleman, N., & Visscher, C. (2011). Oscillations of centroid position and surface area of soccer teams in small-sided games, European Journal of Sport Science, 11:4, 215-223
Frencken, W., Poel, H., Visscher, C., & Lemmink, K. (2012). Variability of inter-team distances associated with match events in elite-standard soccer. Journal of Sports Sciences, 30:12, 1207-1213
Glazier, P. S. (2010). Game, Set and Match? Substantive Issues and Future Directions in Performance Analysis. Sports Med 2010; 40 (8): 625-634.
Goto, R., & Mascie-Taylor, C. G. N. (2007). Precision of measurement as a component of human variation. Journal of Physiological Anthropology, 26, 253–256.
Lago, C., & Martín, R. (2007). Determinants of possession of the ball in soccer, Journal of Sports Sciences,25:9, 969 — 974.
Lames, M., Erdmann, J., & Walter, F. (2010). Oscillations in football – Order and disorder in spatial interactions between the two teams. International Journal of Sport Psychology, 41, 85–86.
Moura, F., Martins, R., Anido, L., Barros, R., & Cunha, S. (2012). Quantitative analysis of Brazilian football players’ organisation on the pitch. Sports Biomechanics, 11, 85-96. Moura , F., Martins , L., Anido, R., Ruffino, P., Barros, R., & Cunha, S. (2013). A spectral
analysis of team dynamics and tactics in Brazilian football, Journal of Sports Sciences, 31:14, 1568-1577, DOI: 10.1080/02640414.2013.789920
Palut, Y., & Zanone, P. G. (2005). A dynamical analysis of tennis: Concepts and data. Journal of Sports Sciences, 23, 1021–1032.
Reis, M., Duarte, R., Araújo, D., Folgado, H., & Frias, T. (2013). Spatial interaction tendencies of football players captured by Voronoi diagrams. Proceedings of the Mathematical Methods in Engineering International Conference (p. 279-287), Porto, Instituto Superior de Engenharia do Porto.
Rosenblum, M., Cimponeriu, L., & Pikovsky, A. (2006). Coupled oscillators approach in analysis of bivariate data. Handbook of Time Series Analysis, Wiley-VCH, 2006, pp. 159-180.
Travassos, B., Araújo, D., Vilar, L., & McGarry, T. (2011). Interpersonal coordination and ball dynamics in futsal (indoor football). Human Movement Science 30 (2011) 1245– 1259
Travassos, B., Araújo, D., Duarte, R., & McGarry, T. (2012). Spatiotemporal coordination behaviors in futsal (indoor football) are guided by informational game constraints. Human Movement Science (2012), doi:10.1016/j.humov.2011.10.004
Vilar, L., Araújo, D., Davids, K., & Travassos, B. (2012a). Constraints on competitive performance of attacker–defender dyads in team sports, Journal of Sports Sciences,
30:5, 459-469, DOI: 10.1080/02640414.2011.627942
Vilar, L., Araújo, D., Davids, K., & Button, C. (2012b). The Role of Ecological Dynamics in Analysing Performance in Team Sports. Sports Med 2012; 42 (1): 1-10.
Yue, Z., Broich, H., Seifriz, F., & Mester, J. (2008). Mathematical analysis of a soccer game. Part I: Individual and collective behaviors. Studies in Applied Mathematics, 121 (3), 223–243.
Appendix 1 - Definition of technical actions
Pass: "technical-tactical action of the communication relation materials (with the ball) between two players of the same team" (Castelo, 2008. p.282)
Wrong pass: when the communication relation materials between two players from the same team is not succeeded, by taking the opponent direction or by leaving the field.
Tackle: "technical-tactical action performed by the defender, who seeks to interfere on the ball, (...) in direct struggle with the attacker that it holds it" (Castelo, 2008. p.293).
Interception: "technical-tactical action in which the player takes the ball possession or puts it away when it is played towards his goal (interception of a shot), or between two opponents (interception of a pass)" (Castelo, 2008. p.296).
Shot: "technical-tactical action exerted by the player on the ball, with the objective of introduce it on the goal" (Castelo, 2008. p.287)
Goal: it's when a shot is performed in the goal direction and the ball cross all the goal-line between the sticks.
Shot on Goal: it's when a shot is performed in the goal direction and the ball is stopped by the goalkeeper or the sticks.
Shot out of the goal: it's when a shot is performed and not takes the goal direction, leaving the field through the goal line.