Complex cell-based model of intestine
permeability
JOANA MARQUES E COSTA
DISSERTAÇÃO DE MESTRADO APRESENTADA
À FACULDADE DE ENGENHARIA DA UNIVERSIDADE DO PORTO EM BIOENGENHARIA
ii
Faculdade de Engenharia da Universidade do Porto
Instituto de Ciências Biomédicas Abel Salazar
Complex cell-based model of intestine
permeability
Joana Marques e Costa
Master Thesis
Submitted in partial fulfilment
of the requirements for the Degree of
Master of Science in Bioengineering,
at the Faculdade de Engenharia da Universidade do Porto
and Instituto de Ciências Biomédicas Abel Salazar
Advisor: Prof. Dr. Pedro Ganja
Co-advisor: Prof. Dr. Bruno Sarmento
ii
Abstract
In vitro cell models are widely used tools to screen the absorption and pharmacokinetics of
new drugs. In the case of oral administration, the intestinal in vitro cell models are usually based on Caco-2 cells, which may differentiate into enterocytes-like cells after 21-days on culture.
One of the referred improved in vitro intestinal models consists in a co-culture system of Caco-2 cells and Raji B lymphocytes. The rationale behind it is supported by the observations of a phenotypic shift on Caco-2 cells into M cell-like cells induced by the lymphocytes. M cells are a specific epithelial cell type specialized in transepithelial transport of macromolecules, particles, and microorganisms, generally present in mucosa-associated lymphoid tissues.
With the aim of studying such transdifferentiation mechanism using a less time consuming cell model, this project consists in the assessment of a 7-days co-culture model of Caco-2 and Raji B cells. In order to do so, several experiments were performed in four models, namely 7-days Caco-2 monoculture, 7-7-days Caco-2:Raji B co-culture, 7-days Caco-2 monoculture and 21-days Caco-2:Raji B co-culture. The goal was to assess characteristics of the models and validate the 7-days models by comparison with the settled 21-days one.
The first parameter to be assessed was cell monolayer integrity by the transepithelial electrical resistance (TEER) and the performance of paracellular permeability studies. These revealed that although the TEER values of the 7-days model are lower, all of the four model showed their cell monolayer intact. Then, a permeability study was performed with insulin as model drug aiming to assess the permeation capability of the models. The obtained values were satisfactory when comparing to others in the literature and there was no permeation difference between any of the models. Regarding cell morphology and phenotype, traits of differentiated cells were analyzed by microscopic techniques, as the presence of tight junctions and microvilli
ii
and also the expression of occludin, a tight junction protein, and alkaline phosphatase, a digestive enzyme. It was also examined the presence of galectin-9, a lectin that was reported as a specific marker for M cells. These experiments revealed that all the differentiated cell features analyzed were found in the 7-days models as in the 21-days models, with exception of galectin-9 whose labeling is still being optimized. Additionally the enzymatic activity of alkaline phosphatase, that is a more reliable indicator of cell differentiation, was also assessed. With this assay, differences were found between the 7-days models and the 21-days models, which exhibited higher activity. In all the studies performed, no significant variations between the mono and co-cultures were detected, pointing out that the phenotypic shift may have been too subtle to be perceived. As an outcome of this project there is the evaluation of the 7-days Caco-2 mono-culture that seems to be a model capable of resembling the intestinal epithelium as a dynamic barrier. Regarding the co-culture model, more studies are necessary to optimize de procedures and then validate the M cell-like transdifferentiation ability of the model.
Acknowledgments
First of all, I would like to thank to my advisor, Dr. Pedro Granja, for giving me the amazing opportunity of making part of INEB, kindly welcoming me in his team, always sharing positivism. I also express my deepest gratitude to my thesis co-advisor, Dr. Bruno Sarmento, for the provided guidance and support, and also for motivating me to look optimistically to my research whether things go as planned or not – that was a precious lesson.
Secondly, I am grateful to my team headed by Bruno Sarmento and also to BioCarrier group for creating such a great working environment. Here, I express my gratitude individually to: Sílvia Bidarra, for lending me a lot of material that was crucial to get my results in time; Pedro Fonte, for kindly perform the quantification of insulin samples; and the last, but not the least, to Carla Pereira, who was a mentor in the beginning of my work, helping me tirelessly whenever I needed.
To all INEB people, for welcoming me in the family and for inspiring me every day. Among these people I have a special acknowledgment to my friends of the -1.17 room with whom I shared the ups and downs of this experience. Without them this journey would not have been as exceptional.
Foremost, I would like to mention my family and my closest friends, especially my parents, for always supporting me and for making possible everything I ever did. For them, there is no possible fair acknowledgment, because no such thing can be put in words.
iv
Table of Contents
Abstract ... i
Acknowledgments ... iii
Table of Contents ... v
List of Figures ... vii
List of Tables ... ix
Glossary ... xi
Chapter 1 ... 1
Outline ... 1Chapter 2 ... 3
Introduction ... 3 2.1. The Intestine... 3 2.2. M cells ... 52.3. In vitro intestinal cell models ... 12
Chapter 3 ... 17
Aim of the project ... 17
Chapter 4 ... 19
Materials and Methods ... 19
4.1. Establishment of the co-culture system ... 19
2.1.1. Cell culture and subculturing ... 19
2.1.2. Cell seeding ... 20
vi
4.2. Assessment of the monolayer integrity ... 21
4.1.1. Measurement of Transepithelial Electrical Resistance ... 21
4.1.2. Assessment of Paracellular Permeability ... 21
4.1.2.1. Fluorimetry ... 22
4.3. Permeability study ... 22
4.3.1. Insulin quantification ... 22
4.4. Morphological and structural characterization ... 23
4.4.1. Scanning Electron Microscopy (SEM) ... 23
4.4.2. Transmission Electron Microscopy (TEM) ... 23
4.4.3. Immunofluorescence staining... 24
4.5. Enzymatic Activity Assessment ... 25
4.5.1. Alkaline phosphatase activity assay ... 25
4.6. Statistical analysis ... 25
Chapter 5 ... 26
Results and Discussion ... 27
5.1. Comparison of the monolayer integrity ... 27
5.1.1. Assessment of Transepithelial Electrical Resistance ... 27
5.1.2. Paracellular permeability assessment ... 29
5.2. Permeability studies ... 31
5.2.1. Insulin Permeability Studies ... 32
5.3. Morphological and structural characterization ... 34
5.4. Enzymatic Activity Assessment ... 40
Chapter 6 ... 43
Conclusions ... 43
List of Figures
Figure 1 - Schematic illustration of Schematic representation of the intestinal epithelium
and the pathways fir drug absorption. ... 5
Figure 2 – Schematic representation of sections of a Peyer’s patch lymphoid follicle and overlying follicle-associated epithelium (FAE). ... 6
Figure 3 - Representation of the possible mechanisms behind M cell genesis.. ... 10
Figure 4 - Schematic representation of the co-culture model on a Transwell. ... 15
Figure 5 – Evolution of the TEER along the culture time in the different cell models.. ... 28
Figure 6 - Highest TEER values obtained for the 7 and 21 days monocultures and co-cultures. ... 29
Figure 7 - Permeation and TEER profiles during the permeability assay with FITC-dextran of different cell models. ... 30
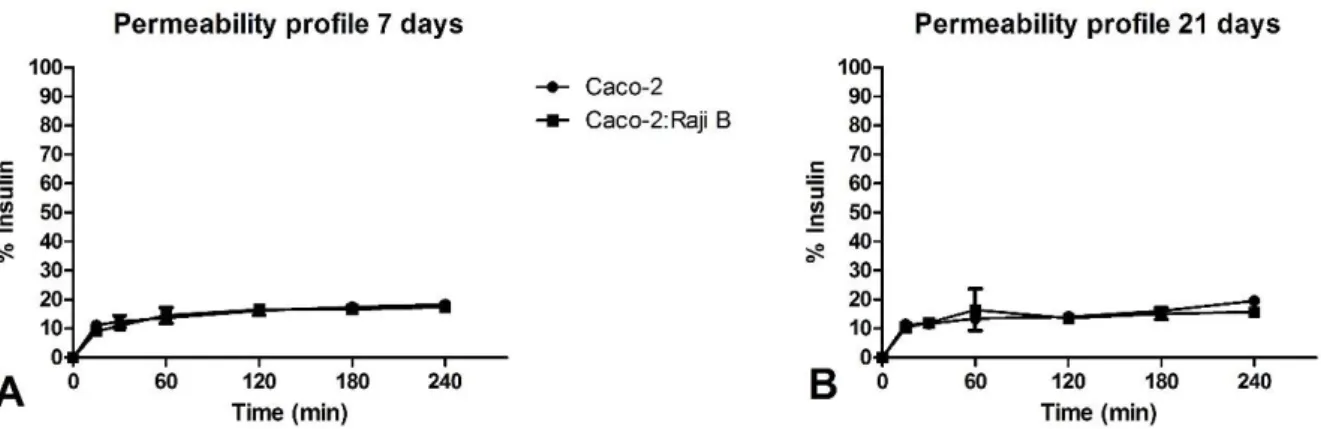
Figure 8 – Cumulative permeation profile of the models for the insulin permeability assay... 32
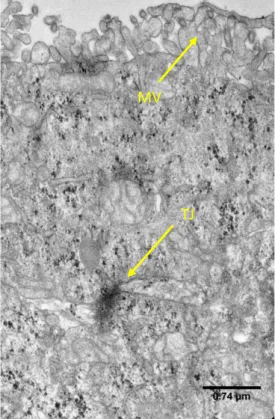
Figure 9- Transversal view of a Caco-2 cell cultured for 7 days.. ... 35
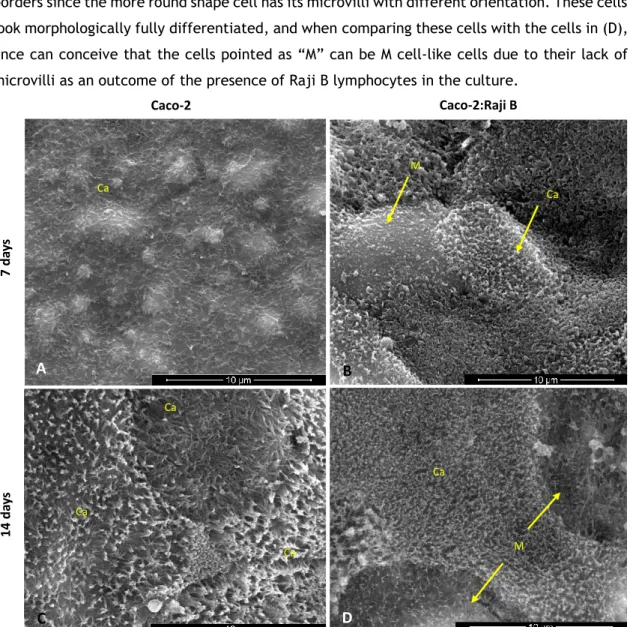
Figure 10 - Images from SEM analysis; view of cells surface ... 36
Figure 11 – Fluorescent microscopy analysis of the 7-days models ... 37
Figure 12 – Fluorescence microscopy analysis of the 21-days cultures. ... 38
Figure 13 - Alkaline Phosphatase Activity of the four cell models ... 41
viii
List of Tables
Table 1 - ALP activity ... 41 Table 3 - Comparison of the assessed parameters between the 7-days model and the
x
Glossary
ALP – Akaline phosphatase
BALT – Bronchus-associated lymphoid tissue DMEM – Dulbecco’s modified eagle’s medium ETS - E26 transformation-specific
FAE – Follicle-associated epithelium FBS – Fetal bovine serum
FITC – Fluorescein isothiocyanate GALT – Gut-associated lymphoid tissue GI – Gastrointestinal
GP2 – Glycoprotein 2
HMDS - Hexamethyldisilazane
Lgr5 – Leucine-rich repeat-containing G protein-coupled receptor LT – Lymphotoxin
M – Microfold
MALT – Mucosa-associated lymphoid tissue MIF – Migration inhibitory factor
NALT – Nasopharyngeal-associated lymphoid tissue
xii
PBS – Phosphate buffered saline PFA – Paraformaldehyde
PP – Peyer’s patches
RANK – Receptor Activator of NF-kB
RANKL – Receptor Activator of NF-kB ligand SEM – Scanning Electron Microscopy
TEER – Transepithelial electrical resistance TEM – Transmission Electron Microscopy TJ – Tight junction
TNF – Tumor Necrosis Factor UEA-1 – Ulex europaeusagglutinin 1
Chapter 1
Outline
This document is divided into four chapters. Firstly, a general view of the scientific background supporting this project is presented in Chapter 2 – Introduction, as well as the objectives of the work. Chapter 3 describes the aim of the present thesis. In Chapter 4 –
Materials and Methods - all the methodology used to perform the experiments can be found.
In Chapter 5 – Results and Discussion – all the relevant results are described and analysed. The implications of the data obtained during the project are also scrutinized in these chapter. Finally, the main results are highlighted and suggestions for future work are presented in
2
Chapter 2
Introduction
2.1. The Intestine
The intestine is responsible for the digestion and absorption of nutrients and it has also the functions of secreting molecules and carrying out immunoresponses. These process are facilitated by the unique structure of the intestine that comprises several levels of infolding resulting in a vast surface area, which allows maximal nutrient absorption1. In fact, 90% of the
absorption sites in the gastrointestinal (GI) tract occur in the small intestine and the presence of villi and microvilli increase the surface area by 30-fold to 600-fold, respectively2.
The wall of the intestine is divided, as any other segment of the GI tract, into four layers that are connected by connective tissue and neural and vascular components: the mucosa, the submucosa, the muscularis propria, and the serosa1.
The innermost and also the most complex layer is the mucosa, where the absorptive function takes place. By its turn, it comprises three layers: the first layer in contact with the intestinal lumen is the epithelium, which is a single layer of epithelial cells; the second layer is the lamina propria, that contains subepithelial connective tissue, blood capillaries and lymph nodes; the third and deepest layer is the muscularis mucosae, a thin layer of smooth muscle1,3.
The intestinal epithelium is the most self-renewing tissue of adult mammals4. It is composed
by enteroendocrine cells, Paneth cells, goblet cells, enterocytes (that make up more than 80% of all intestinal cells) and microfold (M) cells which will be extensively reviewed further ahead. The enteroendocrine cells coordinate gut functioning through specific hormonal secretion; Paneth cells reside at the crypts and have a role in innate immunity by secreting proteins such as antimicrobials and defensins; goblet cells produce and secrete mucins, which constitute the
4
mucus required for the chemical and mechanical protection of the gut; enterocytes represent the absorptive lineage and are columnar cells, highly polarized, with an apical brush border that absorbs nutrients across the epithelium3.
Since the intestinal epithelium itself represents the biggest barrier to the ingested foreign substances2 and participates in the innate immunity, it is associated to a lymphoid tissue. In
fact, the intestinal mucosa contain organized immune inductive tissues, collectively referred as mucosa-associated lymphoid tissue (MALT), which can disseminate T and B cells after antigenic stimulation. MALT typically consists of lymphoid follicles having distinct T and B-cell areas with germinal centers, as well as dendritic cells, overlaid by a specialized follicle-associated epithelium (FAE)5. Depending on the localization in the organism there are different
version of MALT. In the intestine one should refer to the gut-associated lymphoid tissue (GALT). More specifically, Peyer’s patches (PP) are lymphoid follicles on the wall of the intestine projecting themselves into the lumen forming dome shapes6,7. The distinct feature of FAE
overlying the PP’s dome is that it contains M cells. These cells are specialized in the uptake and sampling of antigens, being approximately 10% of PP’s FAE in humans6,8.
2.1.1.
Mechanisms of intestinal uptake
There are several routes of uptake regarding the intestinal epithelium. Small and amphiphatic molecules can cross the epithelial cell layer by passive diffusion since they can partion into the lipid bilayers. By its turn, low molecular weight hydrophilic molecules can cross the epithelial cell layer by the paracellular route, or by uptake of fluids. Also, there several specialized transporters to perform facilitated uptake of molecules such as sugar, aminoacids, among others9. Regarding larger molecules as peptides and proteins (some of interest to the
drug delivery), these can be absorbed by endocytic events10.
Concerning the endocytic uptake, it has been described four elucidated mechanisms in epithelial cells: clathrin-mediated endocytosis, phagocytosis, micropinocytosis and caveolin-mediated endocytosis. The first ones are both mechanisms caveolin-mediated by receptors11.
Macropinocytosis is an active process, depending on actin, in which large volumes of fluid may be internalized12. The invaginations named caveolae have only be found in the basolateral
membrane of epithelial cells13.
In respect to the absorptive cells, enterocytes commonly take up proteins by clathrin-mediated endocytosis10, but it has been described that they may also be capable of taking up
particles through phagocytosis14. On the other hand, it has been described that M cells are
capable of performing transepithelial transport of substances by fluid-phase or receptor-mediated endocytosis at the apical membrane8. Then, the particles are transported in vesicles
across the cytoplasm and suffer exocytosis on the basolateral membrane7,8,15. This whole
process of uptake, transport across the cell and exocytosis is called transcytosis.
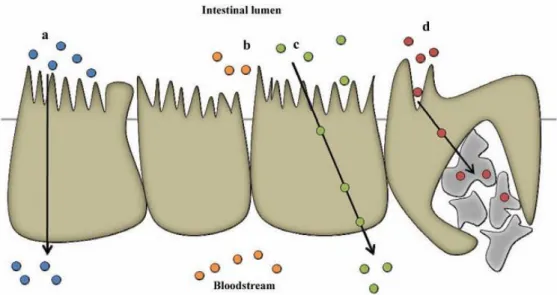
Figure 1 - Schematic illustration of Schematic representation of the intestinal epithelium and the pathways fir drug absorption. a) Transcellular pathway. b) Paracellular pathway. c) Transcytosis and receptor-mediated endocytosis. d) Absorption into the lymphatic circulation via M-cells of Peyer's patches. Adapted from Antunes et al, 201316
It is of special interest to note that the FAE is considered a break in the intestinal barrier to macromolecules by presenting lower enzyme activity, less mucus and increased endocytic capacity17.
2.2. M cells
M cells combine two important functions: maintenance of the barrier and the transport and sampling of luminal antigens, triggering the immune response at the mucosa level.
2.2.1. Characteristics of M cells
M cells present site- and species-related variation but they are generally characterized by specific features, namely the sparse and irregular microvilli on their apical surface, the basolateral pocket containing lymphocytes or macrophages, absence of a thick glycocalix layer and the ability to transport a wide range of materials associated with a high transcytotic capacity 6–8,15,18. These unique features make M cells able to perform luminal antigen sampling
so that cells of the immune system contact with potential pathogens. Lymphatic dissemination is the broadly documented faith of the particles taken by M cells in PP. The particles are
6
transported to the mesenteric lymph nodes and might be able to disseminate via the lymphatic vessels to the systemic circulation8,19,20. All together these characteristics make M cells
attractive targets for oral drug and nanoparticle delivery studies8,18.
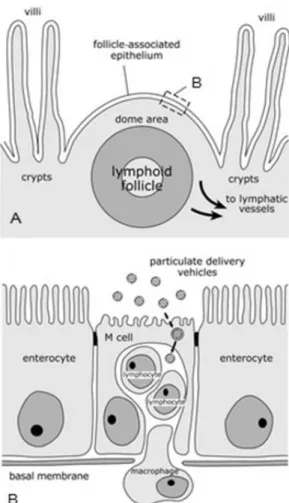
Figure 2 – Schematic representation of sections of a Peyer’s patch lymphoid follicle and overlying follicle-associated epithelium (FAE).The structure of intestinal organized mucosa-follicle-associated lymphoid tissues is represented by the transverse section of a Peyer’s patch lymphoid follicle (A). The lymphoid follicle is situated beneath a dome area which goes into the gut lumen between villi and which is covered by the FAE. This epithelium is characterized by the presence of M cells which possess a reduced number of irregular microvilli on their apical surface and a basolateral cytoplasmic invagination which creates a pocket for lymphocytes and macrophages. Adapted from Clark et al, 20018.
Additionally, some of the pathogenic microorganisms, such as Salmonella21, Yersinia22,
Mycobacterium23, and reovirus24 have evolved mechanisms to exploit M cells as a portal to
infect the host’s organism.
M cell targeting has been provided in animal models, using targeting molecules such as the fucose binding lectin Ulex europaeusagglutinin 1 (UEA-1), and the sigma protein from reovirus. However these molecules are only specific to mouse M cells25. Indeed, many efforts have been
made to discover cellular markers of human M cells. Human M cell markers would allow specific delivery of antigens in order to improve the efficacy of mucosal vaccines or drug carriers (M cells in drug and vaccine delivery is extensively reviewed elsewhere8). In that sense, studies
using microarray analyses and an M cell-like model have shown that galectin-926, sialyl-Lewis A
antigen27, and clusterin28 are specific for human intestinal M cells.
2.2.2. Hypothesis on M cell genesis
In the intestine, almost all epithelial cell lineages develop from intestinal epithelial stem cells within the crypts: the dome-associated crypts surrounding the FAE and the villous crypts at the base of the villi. Thereby studies have confirmed that FAE cells, including M cells, are derived from the Lgr5+ (leucine-rich repeat-containing G protein-coupled receptor) stem cells
within the dome-associated crypts 29–32. Studies suggest that LGR5 may be a marker for stem
cells in small and large intestines. Moreover, using genetic approaches, it was demonstrated that LGR5-positive crypt base columnar cells are multipotent for all mature intestinal epithelial cell types33,34.
However, it is still controversial whether M cells arise as a separate cell line or differentiate from enterocytes under the influence of immune cells that lie in the dome epithelium15,32,35.
The first hypothesis defends that M cell formation is restricted to specialized dome associated crypts, where a subpopulation is pre-determined as M cells before attaining their morphological and functional features, as it was suggested in the works of Gebert et al32 and
Lelouard et al36. The hypothesis that M cells differentiate from enterocytes was firstly proposed
by Smith et al37 and Bhalla et al38.
In both theories, there are studies supporting that the commitment to the intestinal M-cell linage is dependent on the action of the cytokine Receptor Activator of NF-kB Ligand (RANKL). RANKL is selectively expressed by stromal cells in the sub-epithelial dome region beneath the FAE of PP 39. RANKL together with its receptor activator of NF-kB (RANK), expressed by FAE
cells, are a cognate pair of the Tumor Necrosis Factor (TNF) receptor/ligand superfamilies40.
RANKL not only induces M cell specific markers such as the glycoprotein 2 (GP2), but it also strongly regulates Spi-B30,41, a transcription factor from the E26 transformation-specific (ETS)
family42.
Although immature M-cell differentiation appeared to be unaffected in Spi-B-deficient (Spi-B-/-) mice, their FAE were almost completely deficient in functionally mature M cells10,16
indicating that the differentiation of these cells, as for other intestinal epithelial cell lineages, is regulated by a specific transcription factor41. Sato et al have also investigated the
requirement for Spi-B in M-cell through the detection of specific M cells markers. Though the expression of the mature GP2+ M cells was completely absent in the FAE of Spi-B-/- mice, a small number of sites of -1,2 fucosylation (another M cell-like feature) was evident. This
8
suggests that a small population of M cells in the FAE may mature independently of Spi-B and as consequence do not express proteins such as GP2 on their surfaces43.
On the other hand, some works have reported an increase in the number of M cells and enhanced transcytosis activity within the FAE after microbial challenge. One of the first reported showed that Salmonella Typhimurium caused an increase in the number of M cells in mouse FAE within 12 hours of infection, that would be differentiated enterocytes44. The
possible role of pathogens in the formation of M cells will be explored further ahead.
The theory that M cells differentiate from enterocytes was also supported by findings of
Kernéis et al45 and later also by Araújo et al35, where interaction of the epithelial cell line
Caco-2 with lymphocytes led to the formation of M-cell-like cells that resembled intestinal M cells functions and morphology. However, insights on the chemomediators involved in this phenotype acquisition are not identified. In addition, some in vivo studies have brought up evidences that M cell genesis is indeed immunoregulated: bone marrow transplantation in severe combined immunodeficient mice induced the formation of M cells46; B cells participated
in the formation of both FAE and M cells in knockout mice experiments47.
2.2.2.1. The role of immune cells
The theory of lymphocyte induced M cell formation raises the question of how exactly can lymphoid cells transform an enterocyte into an M cell. The molecular events are still unclear but the referred data seems to demonstrate that M cells development is controlled by lymphoepithelial cross talk. In fact, in the small intestine, the chemokine CCL20 is specifically expressed by the FAE and in the PP it mediates the chemoattraction of CCR6 (C-C motif chemokine receptor 6) expressing lymphocytes and leukocytes48,49. In a study by Ebisawa et al
it was reported that a specific subset of CCR6hiCD11cint B cells migrates towards CCL20 produced
by FAE and promotes M-cell differentiation. In mice lacking CCR6, the referred subset of B cells could not migrate towards the FAE and M-cell differentiation was impaired50. An interesting
fact about CCL20 is that the previously cited study also reported that the CCL20–CCR6 and RANKL–RANK systems are regulated independently of each other50, whereas Mabbott et al
reports that the expression of CCL20 in the intestinal epithelium is rapidly induced by RANKL stimulation31. So, RANKL may not only stimulate M cells differentiation through direct contact
with M cells precursors (in a Spi-B dependent manner) but also/or through CCL20-mediated attraction of B cells to the FAE region. Nevertheless, further analysis points out that while mature M cells are dramatically reduced in the FAE of CCR6-/- mice, immature M cells are maintained, implying that CCL20-CCR6 signaling does not influence the initial M-cell differentiation but instead hampers their functional maturation50,51.
Moreover, some other cytokines of the TNF family – lymphotoxin (LT), LT and TNF – which play an important role in the formation of peripherial lymphoid tissues52, have been
investigated in the scope of M cell organogenesis. More specifically, it was reported that stimulation of TNF and LT receptors enhanced the expression of CCL20 in intestinal epithelial cells53,54. Additionally, another study from Hsieh et al showed that the treatment with TNF
and LT receptor agonist strongly induced the transcription of the TNF receptor superfamily member CD137 by epithelial intestinal cells55. Some authors claim that CD137/CD137L signaling
between M cell progenitors and basolateral pocket B cells may provide at least one of the signals that induce final functional maturation of developing M cells55,56. Such event may
explain how B cells could interact with M cell precursors, but it is still a subject not fully clarified.
Regarding the role of the cytokines TNF and LT, once they may stimulate the expression of CCL20 and CD137 molecules, one could propose that they may trigger M cell development. One interesting aspect of the mentioned lymphotoxins is that they may be also supplied by non-lymphocyte cells, as it was proposed by Debard et al, since non-lymphocytes were required for the complete formation of FAE but their absence did not prevent the development of M cells57.
2.2.2.2. The role of pathogens
Cells exhibiting features of M cells that were not in contact with lymphocytes were observed in other experiments. It is the case of some enteroinvasive bacteria, including
Salmonella Typhimurium and the pathogenic bacteria Salmonella Enteritidis and Listeria monocytogenes that have been shown to induce CCL20 expression by intestinal epithelial
cells58. This could be either a host response to infection in an attempt to enhance the
immunosurveillance of the gut lumen, or a way for these pathogens to infect the host by stimulating the differentiation of enterocytes into M cells, guaranteeing their uptake31.
Similarly, other pathogens have been stated to induce rapid (less than one hour) formation of vimentin-positive M cells in rabbit PPs59. Vimentin is a well-established sensitive marker for
M-cells in rabbit MALT60,61. More recently, Tahoun et al used in vivo and in vitro models of
10
together suggest that due to the sudden increase of M cells, synthesis of these cells from lineage-specific stem cells in follicle associated crypts is highly unlikely62.
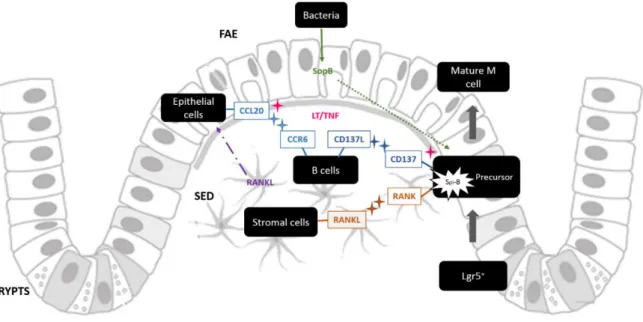
Figure 3 - Representation of the possible mechanisms behind M cell genesis. Lgr5+ differentiate into FAE
cells precursors, including M cells precursors. Stromal cells produce RANKL, which is thought to be bound to the cell surface or in soluble form dispersed in SED, and the cytokine will interact with RANK at the precursor cells surface. This interaction will induce Spi-B expression that could induce the maturation into functional M cell. Immune cells can also induce M cell phenotype. These cells are attracted to the dome region by the cytokine CCL20 produced by epithelial cells. The latter phenomena could be a response to RANKL stimulation, or by action of lymphotoxins. Immune cells interact with CCL20 through their receptor CCR6 and also interact with M cell precursors through the interaction CD37L-CD37, which seems to induce M cell maturation. Once again CD137 expression could be induced by lymphotoxins. Another external factors can induce M cell maturation which is the case of SopB produced by bacteria that will stimulate molecular pathways in the M cell precursors (one of them is thought to be RANKL – Spi-B differentiation pathway).
The referred study of Tahoun et al intended to determine if the infection agents, namely
S.Typhimurium, could either trigger transdifferentiation of epithelial cells into M cells or induce de novo genesis of M cells. The experiment led to an increase in M cell numbers and interestingly it
seemed result of the release of the cytokine RANKL62. The study revealed that the bacteria secreted
an effector protein, SopB, which is known for controlling many cellular pathways during different stages of infection63–65, into host cells and acted as the mediator of M cells RANKL-dependent
differentiation62. It is described that RANKL-RANK activation prompted expression of Spi-B and also
the epithelial–mesenchymal transition-regulating transcription factor Slug that induced the FAE enterocytes to differentiate into M cells. Another report about M cell differentiation induced by bacteria infection brings up again a possible role of the immune cells and comes from the hypothesis that the cytokine macrophage migration inhibitory factor (MIF) was produced rapidly after in vivo bacterial challenge, by CD11c+ cells located beneath the FAE of PP, and also had the capacity to
On Figure 3 there is a schematized summary of the molecules and interactions which were previously referred as mechanisms underlying M cell genesis. Whether or not M cells precursors have their phenotype defined, it seems that signals somehow associated with B cells are necessary to complete M cells maturation. So, it is reasonable to consider that M cell development might be a process in steps in which the first lineage commitment step is B cell independent, and is followed by a step that is dependent on B cells or other external factors. Nevertheless, there is not a decisive genesis model, or at least not one that could put together all interesting points that the different theories present. More experiments are still needed in order to clarify the differentiation process and the role of molecules such as CCL20, CD137, RANKL, Spi-B, SopB, LT.
2.2.3. M cells in other MALT
The morphology of M cells in GALT have been thoroughly studied, but relatively little is known about the presence and properties of M cells in MALT outside the gut. Such tissues can be found in the oropharynx, along the upper and lower airways, in the salivary gland ducts, among others7. Thus it should be expected to find a cell type similar to intestinal M cells in
their associated epithelium to perform antigen sampling.
The oro- and nasopharynx lymphoid tissue, which is called the Waldeyer’s ring in humans, is formed by the palatine, pharyngeal, lingual and tubal tonsils67. Along with the lymphoid
tissue of the nasal cavity, these tissues constitute the nasopharyngeal associated lymphoid tissue (NALT)68,69, although some authors refer to them separately70.
There are different types of epithelium covering the tonsils: the palatine and lingual tonsils are covered by a squamous stratified epithelium, and the pharyngeal and tubal tonsils are covered by a respiratory epithelium7.
Structural and histochemical features of M cells present in the epithelial cells of tonsils have been described in some animal models: irregular microfolds, the ability to take up tracers, the presence of the cell marker vimentin (in the case of rabbit’s tonsils), close contact with intraepithelial lymphocytes7,61, and a specialized composition of glycoconjugates in their apical
membrane which could be involved in the adhesion and uptake of inhaled or ingested particles71. For some time, studies failed to detect a separate epithelial cell type in human
tonsils, but nowadays specific human tonsillar M cell markers, such as class II b-tubulin, are identified. The basic structure of M cells in the human nasopharyngeal lymphoid follicles is the same as in the PP. Thus, it is likely that the M cells in nasopharyngeal lymphoid follicles of the Waldeyer’s ring are sites of antigen uptake for induction of mucosal immunity68.
12
On the other hand, a study demonstrated that specific immune responses were induced by infection via the upper respiratory tract on mice with structural and functional defects of NALT, suggesting that additional inductive sites and/or M cells are present in that region72. The
authors identified M cells developed in the murine nasal epithelium as an alternative and NALT-independent gateway for the sampling of respiratory antigens. However, differences between murine and human epithelium points that the presence of respiratory M cells in the nasal cavity might be a unique feature of the mouse72.
It is described that the induction of the M cell phenotype in the case of NALT M cells is as complex as it is for the intestinal cells. Instead of a rapid turnover and crypt stem cell origin, airway epithelial cells are generated from a dispersed population of basal cells and have half-lives on the order of weeks to months73. Regardless of their different origin and turnover
mechanism, NALT and GALT M cells show very similar phenotype and functions, indicating that convergent or overlapping genetic programs are induced56.
While bronchus-associated lymphoid tissue (BALT) is found in rats and rabbits, it is present only rarely in healthy adult humans7. Likewise its development seems to be related to microbial
stimulation and can be induced by infections and vaccinations74.
The lymphoepithelium that overlies the lymphoid tissue of the bronchi differs in several aspects from the ordinary respiratory epithelium. The number of ciliated cells is reduced, goblet cells are rare, but numerous lymphocytes and also some macrophages lie among the epithelial cells7. Similarly to other MALT, M cells were found among other epithelial cells of
the dome area of BALT in rabbits. It was also shown that antigen and viruses were transported more avidly by M cells than by other epithelial cells. Still, no M cells have been evidently characterized for BALT in humans7,75. Toyoshima et al reported BALT induction after exposure
of the airways of mice by P. aeruginosa, with higher response as well76. Moreover, M cells in
the lung have also been recognised as entry sites for Mycobacterium tuberculosis in mice77.
2.3. In vitro intestinal cell models
Intestinal in vitro models have been established in order to evaluate the intestinal absorption of drug candidates. In vitro models are cheaper and less laborious when compared to in vivo techniques. Also, they replace and reduce the use of experiments with animals, valuing the 3R’s policy78. On the other hand, one cannot extrapolate the data to the in vivo
situation since these models do not consider physiological factors that influence absorption such as GI pH, intestinal emptying rate, control by the nervous system and systemic blood flow79,80.
2.3.1.
Caco-2 monoculture
Caco-2 cells are an immortal human cell line derived from a human colorectal adenocarcinoma. In culture they grow into a confluent monolayer, differentiate and behave similarly to enterocytes, in terms of function and structure, resembling normal intestinal epithelium81. It is the most used cell model to study the permeability of drugs over the last 20
years, and is accepted as standard assay to predict drug intestinal permeability in humans by pharmaceutical companies and controlling authorities82. When Caco-2 cells are grown in a
semipermeable membrane, the apical compartment corresponds to the intestinal lumen and the basolateral compartment corresponds to the serosal side, simulating the vivo intestine83,84.
The cell differentiation starts when the cells achieve confluence, around 7 days, and is completed within 21 days. That is when the cells are polarized and connected to each other through tight junctions (TJ), exhibiting an apical brush border structure with several enzymes, membranar active, ionic and non-ionic transporters and receptors16.
Nevertheless, this system presents some shortcomings, namely the overexpression of P-glycoprotein, an efflux pump, when compared to primary small intestinal enterocytes, and the fact that these cells form tighter junctions than those found in the human epithelium, which could lead to decrease the paracellular permeability85. Additionally, the Caco-2 monoculture
does not contemplate some other important factors that influence the functionality of enterocytes such as the mucus layer or the interactions between the epithelium and the stroma86. Furthermore, in another perspective, the referred cell culture process requires about
3 weeks which is labor intensive and time consuming, limiting its wide application in high-throughput screening of a large number of compounds87.
2.3.1.1. Accelerated Caco-2 models
With the aim of shortening and simplify the process of Caco-2 cell culture, some modified Caco-2 culture protocols have been reported in which a minor period of culture time is required. Lentz et al. have developed a more rapid, reduced serum culture system for Caco-2 monoculture, in which iron and a combination of growth factor and hormones were added to the culture media88. However the effects of these individual substances on Caco-2 cellular
growth are unclear87. Chong et al used a BioCoat® Intestinal Epithelial Cell Environment
claiming that it resulted in a Caco-2 monolayer suitable to be an absorption model in only 3 days89. However, these procedures typically only reduce the time required to obtain
monolayers ready for transport studies with up to 3 days. Also, Caco-2 cells grown in these conditions may not develop tight junctions or express fewer efflux pumps, which limit the utility of such models90.
14
Another study, from Sevin et al, reports an evaluation of an accelerated 6 days Caco-2 cell permeability model obtained by using puromycin treatment of the cells. Strong correlations were obtained between the apparent permeability of the drugs in the accelerated model and in the traditional models and comparable efflux ratios were observed in the both models90.
A report from BD-BioSciences describes another decreased time model that revealed results of a Caco-2 monolayer after only 3 days, by using a three-dimensional extra cellular matrix substrate and an optimized serum-free medium91. In this experiment it was used Differentiation
Medium (containing butyric acid serum-free DMEM with MITO+™), which was also used in Cai et
al experiments on a 7 days Caco-2 model that displayed comparable cellular morphology and
integrity with the traditional 21-day model and no significant differences in paracellular and transcellular permeability87.
Peng et al indicated similar results regarding permeability values and efflux ratios between
a 7 days model and the established 21 days model. The cells were seeded the in collagen coated transwells92. A coating procedure was also transversal to the two previous mentioned studies.
Nevertheless, multiple protocols for the culture of Caco-2 cellular models result in diverse cellular morphology and transporter expression88, so it is difficult to establish a new protocol
that requires less time to develop a suitable and reliable Caco-2 intestinal model.
2.3.2.
Caco-2:Raji B co-culture
As M cells constitute a minor subset of intestinal epithelial cells in the FAE and are difficult to isolate, study of the signaling involved in their development and maintenance is quite complex. Several approaches are used to investigate these cells and one is the use of an in vitro model of M-cell differentiation. As it was mentioned on section 1.2.2., it was reported that Raji B cells, a cell line that is originated from a human Burkitt’s linfoma, induce M cell’s phenotype in Caco-2 cells.
Kérneis established an in vitro model to study the properties of M cells by settling a co-culture of Caco-2 cells with lymphocytes isolated from mouse Peyer’s patches that were added at the 15th day of the culture. After a couple of days of direct contact it was possible to
Later, Gullberg and co-workers developed a new co-culture system in which, Caco-2 cells were seeded on normal oriented inserts and after 14 days human Raji B lymphocytes, were added to the basolateral chamber of the Transwell™ 93. This means that lymphocytes were not
in direct contact with Caco-2 cells, although it resembles better the physiological conditions. In this system it was possible to observe that some cells developed M-cell like morphology.
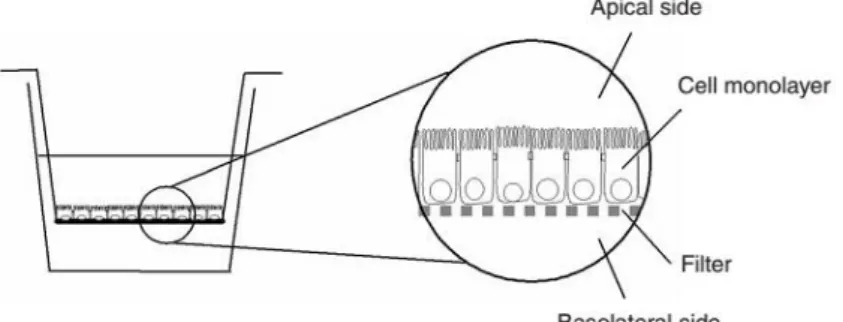
Figure 4 - Schematic representation of the co-culture model on a Transwell. Caco-2 cells are seeded on the Transwell membrane while Raji B are added later to the basolateral compartment. Image adapted
fromHubatsch et al, 2007118
Afterwards, the effect of M cells on the transport of drugs in comparison with the Caco -2 cell model was studied by Rieux’s group, this time using Gullberg’s model. It was assessed the transport of nanoparticles versus the drug in the free form and the group described that M cells increased the transport of the encapsulated drug94, indicating that these cells participate in
the transport of nanoparticles.
Although the Caco-2:Raji B model still lacks the influence of mucus and stromal cells, it mimics the uptake of particles in a more reliable way. It is also a great tool to explore the differentiation of enterocytes into M cells and inherently it is a way to discover the interactions between epithelial cells and lymphocytes.
16
Chapter 3
Aim of the project
The project here presented is included in the overall aim to develop an intestinal cell-based engineering model to study the absorption of nanoparticles containing biopharmaceutical drugs. More particularly, this thesis was developed within the context of the enhancement of the Caco-2:Raji B co-culture model, by optimizing the conversion of Caco-2 cells into M cells in a similar extension to the in vivo tissue. For that, the transdifferentiation process and the molecular factors responsible for the phenotypic shift must be studied. Additionally to this goal, a new improvement to the intestinal in vitro cell models was proposed: the study of M cells in a more rapid and cheaper manner. This proposal was based on the hypothesis that induction of M cell phenotype would also work in an early time of Caco-2 cell maturation, since it is a process that somehow requires a certain phenotypic plasticity.
Thus, the final aim is to assess a 7-days co-culture model as a suitable tool for the study of
in vitro M cell transdifferentiation, which would have an enormous positive impact in the
development of intestinal cell models by sparing time and money.
To do so, the first objective is to validate the model in comparison with the 21-days model in terms of development of Caco-2 cells. This implies the evaluation of certain parameters: the integrity of the cell monolayer, the expression of certain cell markers, the enzymatic activity of brush border enzymes and the ability to transport substances. Then, one should compare the two models in the co-culture system where some cells should differentiate into M cells, causing changes on the previous mentioned parameters.
A such, there will be four systems to analyse: 7-days 2 monoculture, 7-days Caco-2:Raji B co-culture, 21-days Caco-2 monoculture, 21-days Caco-Caco-2:Raji B co-culture.
18
Chapter 4
Materials and Methods
4.1. Establishment of the co-culture system
4.1.1.
Cell culture and subculturing
Caco-2 cell line was obtained from American Type Culture Collection (ATCC). Raji B cell line was kindly provided by Dr. Alexandre Carmo from Cellular and Molecular Biology Institute (IBMC), Porto, Portugal. Caco-2 cells were used between passage numbers 22 and 40 and Raji B cells between 30 and 42.
Both cell lines were cultured and grown separately in tissue culture flasks (Orange Scientific) in a complete medium, consisting of DMEM (Dulbecco's Modified Eagle's medium) supplemented with 10% (v/v) heat-inactivated Fetal Bovine Serum (FBS), 1% (v/v) L-glutamine, 1% (v/v) non-essential amino acids and 1%(v/v) penicillin/streptomycin. Unless otherwise stated, all reagents regarding cell culture were purchased from Gibco (Invitrogen Corporation, Life Technologies). Cells were maintained at 37°C in a humidified atmosphere of 5% CO2. Medium was changed every two or three days, and cells were regularly sub-cultured when reaching 70-80% of confluence as follows. Medium was removed, cells were washed with sterile Phosphate Buffered Saline (PBS, pH 7.4: 147 mM NaCl, 2.7 mM KCl, 1 mM CaCl2, 0.5 mM KH2PO4, 3.2 mM Na2HPO4 and 5.5 mM glucose). To detach them it was used a 0.25% (w/v) Trypsin-EDTA solution for 5-10 minutes at 37°C that was then inactivated by the addition of double volume of complete medium. A small aliquot of the cell ressuspension was then mixed with 0.4% (v/v) trypan blue (Sigma) and cell were counted using a Neubauer chamber. Cell density was determined by the trypan blue exclusion test of viability:
No. cells/ml = 𝑇𝑜𝑡𝑎𝑙 𝑣𝑖𝑎𝑏𝑙𝑒 𝑐𝑒𝑙𝑙𝑠 𝑛𝑢𝑚𝑏𝑒𝑟
𝑛𝑜.𝑜𝑓 𝑠𝑞𝑢𝑎𝑟𝑒𝑠 × 𝑑𝑖𝑙𝑢𝑡𝑖𝑜𝑛 𝑓𝑎𝑐𝑡𝑜𝑟 × 10 4
20
A volume of cell suspension was transferred to new T75 culturing flasks, with 10 mL of fresh complete medium, corresponding to a cell density of 6 to 8x10⁵ cells/flask and 1 to 2x10⁶
cells/flask for Caco-2 cells and Raji B cells, respectively. As Raji B cells are in suspension the trypsinization step is skipped and the following steps were maintained. Every time PBS or complete medium was added to the cells the solutions were pre-warmed at 37°C.
4.1.2. Cell seeding
For all experiments cells were cultured on 24-well culture plates (Corning). Caco-2 cells were seeded at a cell density of 1x10⁵ cells/cm2 and a number of Raji B cells corresponding to
twice the number of Caco-2 cells was then added to the system. Depending on the experiment two different set-ups were used.
To perform the permeability studies, the evaluation of the monolayer integrity and the assessment of the morphology by Scanning Electron Microscopy (SEM) and Transmission Electron Microscopy (TEM), the cells were cultured in the Transwell system of polyethylene terephthalate transwell (BD Falcon™) with 8 µm size pores. In this set-up, Caco-2 cells were seeded on the apical side of the insert, which was filled with 300 µL of complete medium, and the Raji B cells were added to the basolateral chamber, which was filled with 800 µL, at day 15-18 for the 21-days model or at day 3 of the 7-days model. This experimental set-up is represented on figure 4. Medium was change every 3 days and after the addition of Raji B cells only half of the volume was removed and replaced by fresh medium.
To perform the alkaline phosphatase assay cells were seeded directly on the culture plate and to perform immunofluorescence staining cells were seeded on top of coverslips to facilitate image acquisition. The seeding conditions were the same as in the previous set-up, except Caco-2 and Raji B cells were in direct contact and the total volume of complete medium was around 1mL.
In all experiments of the 7 days-model, the inserts/coverslips/culture plate were coated with rat tail collagen type I just before the Caco-2 cell seeding, in an attempt to induce a more rapid development of the model, since it was described that fibrillar collagen accelerates the development of a tight monolayer by Caco-2 cells91.
All the experiments, except for the samples for morphological analysis, were performed in triplicates.
4.1.3. Collagen type I coating
For the 7-days culture, before cell seeding, it was performed a coating of with Collagen I from rat tail tendons (Gibco®, Invitrogen) and manufacturer’s instructions were followed. Firstly, the collagen stocking solution of 3 mg/mL was diluted to 50 µg/mL in 0.02 M acetic acid. Then, the solution was added to the Transwells/coverslips at 5 µg per cm2, incubating at
room temperature. After 1 hour, the solution was aspirated and the surfaces were rinsed three times with equal volume of PBS to remove de acid. The cell seeding happened immediately after.
4.2. Assessment of the monolayer integrity
4.2.1.
Measurement of Transepithelial Electrical Resistance
The evaluation of the epithelial integrity was made by measuring the transepithelial electrical resistance (TEER). The measurements were made every three days and during the permeability assays, using an Electric-Volt-Ohm Meter device from Millipore®. TEER increases with culture time, reaching a plateau value after about 10 days, when the adhesion between the cells should be already formed95.
Before every measurement, the electrodes were equilibrated with culture medium for 3-5 minutes. The computed values were obtained by deducting the resistance values of the insert filter and the culture medium and multiplying it by the surface area of the Transwell.
4.2.2. Assessment of Paracellular Permeability
Permeation studies were performed using 4kD Fluorescein isothiocyanate–dextran (FITC- dextran, Sigma-Aldrich) - a fluorescent marker for paracellular transport - which can indicate the integrity of the membrane. After cell-washing and equilibration in PBS, 300 µL of FITC-dextran solution at a concentration of 200µg/ml were added to the apical chamber, while 800 µL of PBS were added to the basolateral chamber. The assay lasted 2 hours and every 15 minutes 100µL were taken from the basolateral chamber to a black micro-assay 96-well plate (Greiner Bio-one) and substituted with 100µL of PBS. In the last time-point 100 µL were also recovered from the apical chamber. The plates were maintained at 37ºC with an agitation of 80 RPM during the course of the experiment. TEER measurements were also performed every 30 minutes during the assay to assess membrane viability.
22
4.2.2.1.
Fluorimetry
The collected samples from the paracellular permeability assay were analysed by fluorimetry. A calibration curve was obtained by using solutions with known concentrations of FITC-dextran) from which the concentration values of the samples were extrapolated. Fluorescence was read using a SynergyTM Mx HM550 microplate reader (BioTeK® Instruments) at
an emission wavelength of 520nm and excitation wavelength of 495nm. Microplate readings were obtained through Gen5 Data Analysis software (BioTek® Instruments). The apparent
permeability (Papp) was calculated with resource to the calibration curve, by calculating the
mass of FITC-dextran in each sample and using the following equation:
𝑃𝑎𝑝𝑝=
∆𝑄 𝐴 × 𝐶0× ∆𝑡
,
where C0 is the initial concentration in the apical compartment (μg/mL), A is the surface
area of the insert (cm2), ∆t is the time correspondent to the time-point (seconds) and ∆Q is the
concentration of compound detected in the basolateral side (μg/mL).
4.3. Permeability study
After cell-washing and equilibration in PBS, 300 µL of insulin solution at a concentration of 100 µg/mL were added to the apical chamber, while 800 µL of PBS were added to the basolateral chamber. The assay lasted 4 hours and at the time-points: 15 min, 30 min, 1h, 2h, 3h and 4h, 100µL were taken from the basolateral chamber to a black micro-assay 96-well plate (Greiner Bio-one) and substituted with 100µL of PBS. In the last time-point 100 µL were also recovered from the apical chamber. The plates were maintained at 37ºC with an agitation of 80 RPM during the course of the experiment. TEER measurements were also performed every time a sample was taken to assess membrane viability.
Complementary studies to integrity were performed at the end of permeability studies to evaluate the final integrity state of the monolayers. For this, apical-basolateral flux was assessed using 4 kDa FITC-Dextran which occurred the same way as described on the previous section but with only one time-point taken after 1 hour.
4.3.1. Insulin quantification
The samples were further quantified by reverse HPLC-UV on a Merck-Hitachi LaChrom HPLC instrument (Merck). The HPLC system was equipped with a XTerra RP-18 column, 5 μm particle size, 4.6 mm internal diameter × 250 mm length (Waters) and a LiChrospher 100 TP-18, 5 μm particle size guard column (Merck). The experiment was run at room temperature and the total
area of the peak was used to quantify insulin96. The results were expressed in percentage of
release and apparent permeability (Papp), calculated as presented on section 2.3.2.
4.4. Morphological and structural characterization
4.4.1. Scanning Electron Microscopy (SEM)
Transwell membranes were first washed twice in PBS, following primary fixation with 3% (v/v) Glutaraldehyde (AGAR Scientific) in 0.1M sodium cacodylate during 45 minutes at room temperature. After rinsing with 0.1M sodium-cacodylate buffer (Fluka®), membranes were incubated with secondary fixative 1% (v/v) osmium tetroxide in 0.1M sodium cacodylate buffer for 1 hour at 4°C. Membranes were washed with 0.1M sodium-cacodylate buffer, following dehydration through a graded series of ethanol for 10 minutes each. To dry the membranes it was used (HMDS, Sigma) solution to incubation for 10 minutes and then the samples were air-dried. Finally, the membranes were removed from the transwell insert with a scalpel blade and placed on the top of double-sided sticky tape that was placed on top of an aluminium stub. Before observation the samples were sputter coated with 200 Angstroms of Gold-Palladium. Images were acquired using Quanta 400FEG ESEM/EDAX Genesis X4M.
4.4.2. Transmission Electron Microscopy (TEM)
Transwell membranes were first washed twice in PBS, following primary fixation with 2.5% (v/v) Glutaraldehyde (AGAR Scientific) in 0.1M sodium cacodylate during 3 days at 4°C. After rinsing with 0.1M sodium-cacodylate buffer, membranes were post-fixed in 2% (v/v) osmium in 0.1M sodium cacodylate buffer overnight. Membranes were washed with 0.1M sodium-cacodylate buffer, following dehydration through a graded series of ethanol and propylene oxide for 10 minutes each. The membrane was infiltrated in embedding resin as follows: propylene oxide and epon (2:1 proportion), 1:1, 1:2 and 0:1 during 1 hour each. After that, resin was allowed to harden during 48 hours in an incubator set at 65°C. The block was sectioned with 60 nm of thickness using a Leica Reichert SuperNova ultramicrotome (Leica Microsystems) and samples are collected to an aluminium disk. The disks were contrasted using uranyl acetate and lead citrate during 5 minutes in each solution. Images were acquired using a transmission electron microscope Jeol JEM 1400.
24
4.4.3. Immunofluorescence staining
The staining procedure were performed entirely on the coverslip containing the Caco-2 cells monolayer. Generally, all of the presented immunofluorescence staining procedures are composed by some key steps: fixation, permeabilization (if required), blocking, incubation with primary antibody, incubation with secondary antibody (if applicable) and mounting. Between these steps there are washing steps that consist in washing the cells three time with PBS for 5 minutes. Every time a washing step is mentioned it consists on the previously described.
In all the immunofluorescence staining practices two fixatives were tested: 2% (v/v) paraformaldehyde (PFA, Merk) solution and methanol (Sigma). Regarding the first mentioned fixative, cells were incubated with PFA for 15 minutes at room temperature, followed by a washing step to remove the fixative; then the next step comprised a permeabilization procedure with the incubation for 7 minutes with a 0.05% Triton X-100 (Sigma) solution also at room temperature. The alternative method was to perform the first washing step with cold PBS and then incubate the cells for 10 minutes on ice with cold methanol. After this step, cells were washed again for the removal of the fixating agent and no permeabilization step was necessary. After this, cells were incubated in blocking solution – PBS + 10% (v/v) Fetal Bovine Serum (FBS) - for 30 minutes at room temperature, so that the antibodies would not bind non-specifically in the next step. Then, without washing, the blocking solution was removed and the cells were incubated with the primary antibody solution. In the case of Alkaline Phosphatase the staining was obtained by incubating the cells with intestinal alkaline phosphatase rabbit polyclonal antibody (Biorbyt) at a dilution rate of 1:100 in PBS, for 1 hour at room temperature. The staining of Galectin-9 was obtained by incubating the cells with purified galectin-9 mouse anti-human antibody (BioLegend) at a dilution rate of 1:50 in PBS, overnight at room temperature in a humidified chamber. Occludin was stained through the incubation with occludin mouse monoclonal antibody-Alexa Fluor® 594 (Invitrogen) at a dilution rate of 1:100 in PBS for 1 hour at room temperature. After washing cells previously incubated with anti-Alkaline phosphatase antibody and anti-galectin-9 antibody were incubated with the secondary antibodies Alexa Fluor®594 Goat Anti-rabbit (Invitrogen) and Alexa Fluor®594 Rabbit Anti-Mouse (Invitrogen), respectively, at a dilution rate of 1:1000 in PBS, for 1 hour at room temperature, protected from light. Finally, were washed again and were incubated with 4',6-diamidino-2-phenylindole (DAPI, Sigma Aldrich) for nuclei staining for 10 minutes and mounted in Fluoromount™ Aqueous Mounting Medium (Sigma Aldrich). Inverted Fluorescence Microscopy images were obtained using a Zeiss (Germany) Axiovert 200M inverted fluorescence microscope and analysed using AxioVs40 v4.8.2.0 software.
4.5. Enzymatic Activity Assessment
4.5.1. Alkaline phosphatase activity assay
The assessment of alkaline phosphatase was evaluated as it is an indicator of Caco-2 cells differentiation. Culture medium was removed from the wells and cell monolayer washed twice with PBS. Then, 1 ml of reaction buffer was added to the wells. This reaction buffer was composed by 1 volume of collection buffer (10 mM Tris–HCl, 150 mM NaCl) and three volumes of Nitrophenyl phosphate (NPP) solution. This last solution was composed by 2.5 mg/ml p-NPP (Sigma-Aldrich) dissolved in 100 mM diethanolamine (Sigma-Aldrich), 150 mM NaCl and 2 mM MgCl2. The assay occurred for 12 minutes at 37ºC with an agitation of 80 RPM. Samples of 100 µL were collected every 2 minutes and transferred to a black micro-assay 96-well plate (Greiner Bio-one) which wells contained 50 µL of 0.5 M NaOH to stop the reaction. The standard curve was prepared with 50 µL of each p-Nitrophenol (p-NP) standard solution (Sigma-Aldrich) (concentration range: 0–600µM) added to 150µl of pNPP solution and 50µl of 0.5 M NaOH. Absorbance was read in SynergyTM Mx HM550 microplate reader (BioTeK® Instruments), at 405
nm, and converted to concentration after blank subtraction with reference to the standard curve and corrected for the reaction volume. Then the concentration values were plotted as a function of time. Finally, enzyme activity was calculated from the angular coefficient of the linear slope and expressed as mU = nmol of p-NP/min and normalised to mg of cellular protein. Quantification of cellular protein was performed accordingly to the Lowry method97, using the
DC Protein Assay (Bio-Rad).
4.6. Statistical analysis
Statistical analysis was performed using GraphPad Prism 5 software. Mean and standard deviation were calculated for each sample. A one-way analysis of variance (ANOVA) with Tuckey post test was used to evaluate group’s comparison. Samples were considered significantly different if a difference of P < 0.05.
26
Chapter 5
Results and Discussion
The principal objective of this project is to assess the 7-days model characteristics and its validity as a tool to study M cells differentiation. As such, the effects of the different culture periods will be assessed and the differences between the co-culture and monoculture will be analysed as well.
As it was mentioned before, the study subjects consist in 4 different models: Caco-2 monocultures with culture time of 7 days and of 21 days, and Caco-2:Raji B co-cultures with 7 days and 21 days of culture time as well. In every following section, the data regarding each model will be compared and analysed.
5.1. Comparison of the monolayer integrity
5.1.1.
Assessment of Transepithelial Electrical Resistance
The first step of the project was to evaluate the integrity of the cell monolayer in the four conditions above mentioned. Since the integrity and robustness of the cell monolayer is dictated by the presence and graduate stronger tight junctions between cells95, it is expected
that the time in culture will influence the transepithelial electrical resistance. The following graphs contain the TEER values obtained for the models.
28
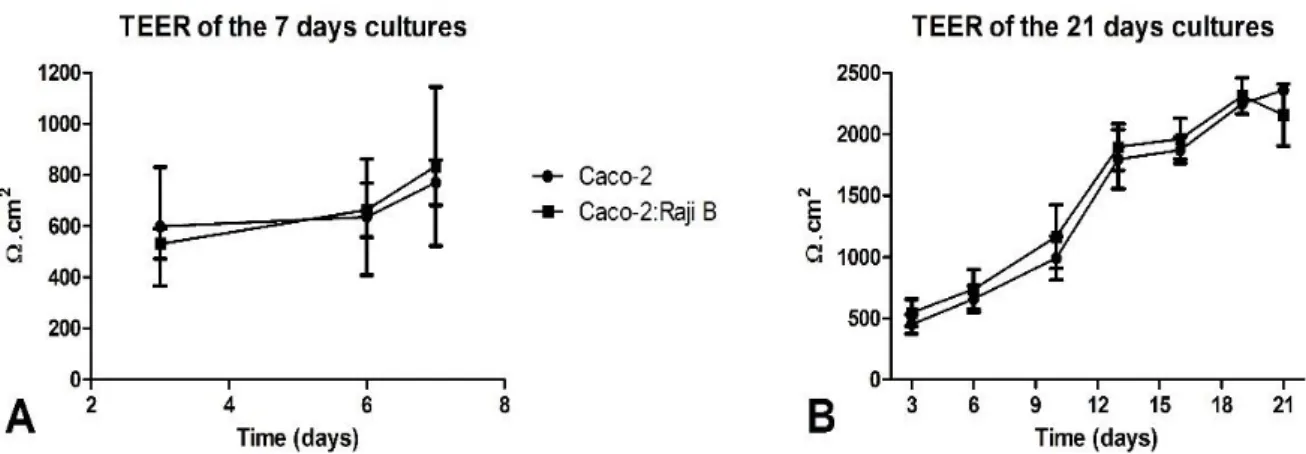
Figure 5 – Evolution of the TEER along the culture time in the different cell models. On A are presented the TEER values for the monoculture and co-culture of 7 days; on B are presented the TEER values for monoculture and co-culture of 21 days.
In fact, on figure 5 it is observable that the TEER, increased with culture time in all models as expected. In the literature is described that TEER of Caco-2 monolayers reach a maximum after about 10-15 days95. In the 21-days cultures, although there was a slight increase of the
TEER in the last days, it was verified that the after 12 days in culture a plateau was reached, so in this aspect there is concordance with the literature. However, there is disagreement in what concerns the TEER values. As one can easily visualize on figures 5 and 6, the highest TEER value obtained for the 21-days culture is somewhere between 2000 to 2500 ohms.cm2, and the
reported range of such values is between 150 to 1600 ohms.cm2 95,98. Though the obtained values
are fair above of what was expected, the reference consists in a broad range of values which leads to conclude that there is some accepted variability in this parameter, as it depends on the numbers of cells seeded, filter support, culture condition, and passage number95,98.
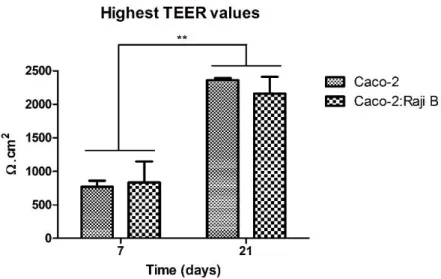
Figure 6 reveals that once more as it was expected, the TEER values obtained for the 7-days cultures were significantly lower than the 21-7-days cultures values. Even though the cells were seeded on collagen fibers, TEER depends highly on the tightness of the junctions between cells and these take some time to fully develop99. So, although the monolayer of the 7-days
model may be intact, the TJ between the cells are not as tight as in the 21-days model, so the proposed model fails in this parameter. Still, the implications of this failure have to be ponder.
Figure 6 - Highest TEER values obtained for the 7 and 21 days monocultures and co-cultures. The difference between the 7-days model and the 21-days model TEER is statistically significant (p<0,05). However, there is no significant statistically difference between the TEER of the monocultures and the co-cultures (p>0,05).
The results of other parameters assessment must be analysed to make a correct assumption of the implications of the lower TEER values of the model.
Concerning the effects of the presence of the Raji B cells in the co-cultures models, as it is evident on both of the previous graphs, there is no significant difference between the TEER values of the monoculture and the co-culture systems in both 7 and 21-days models. It would be expected that he presence of Raji B cells in the co-culture models could have an impact on the integrity of the cell monolayer. In fact it was described that in such cell model TEER values obtained in the co-culture were lower, due to the transformation of enterocytes in cells with M-phenotype which do not form TJ as tight as in the Caco-2 monocultures35. The obtained
results mean that if the conversion of Caco-2 cells into M cells happened, two of the follow events took place: either the process was not relevant enough to cause loss of the junctions tightness between a significant group of cells, or the transdifferentiation did not affect this parameter.
5.1.2.
Paracellular permeability assessment
Another way of assessing the integrity of the monolayer was accomplished by determining the paracellular permeability to hydrophilic tracers which can be monitored with compounds that are labelled fluorescently, such as dextrans. So, in order to do so, the permeability of
30
FITC-dextran was determined and also TEER, whose first time point was obtained after the substitution of DMEM for PBS, was measured during the assay, as it is presented on figure 7.
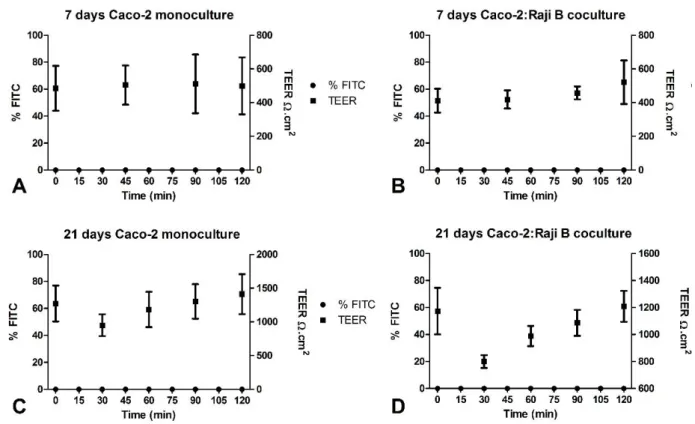
Figure 7 - Permeation and TEER profiles during the permeability assay with FITC-dextran of different cell models. The dots represent the percentage of FITC and the squares represent the TEER values. A - Permeation profile of the 7-days Caco-2 monoculture; B – Permeation profile of the 7-days Caco-2:Raji B co-culture; C – Permeation profile of the days Caco-2 monoculture; D – Permeation profile of the 21-days Caco-2:Raji B co-culture.
In the previous graphs it is visible that none of the cell models was permeable to FITC dextran. There was no detectable compound on the basolateral side of the Transwell during the whole assay meaning that all the FITC-dextran was retained by the cell monolayer. It is also observable that all the systems maintained high TEER values throughout the permeability study. As it was expected, the 7-days models TEER values were lower when compared to the 21-days model values, but the measurements were practically stagnant with time. The 30 minutes measurement on the 21-days co-culture assay (D) was an exception, but it was likely due to an abnormal reading, explaining the following increase of TEER values.
Such results reveal that not only cell monolayers were intact, but also the tight junctions between cells were narrowly and strongly tight. Although reported permeation studies indicate that TEER values usually decrease, representing the increase of permeability through the TJ