Equity Valuation – Eurocash Group
Ana Isabel Antunes de Azevedo Branco - 152413301
Advisor: Professor José Carlos Tudela Martins
Dissertation submitted in partial fulfillment of requirements for the degree of MSc in Finance, at the Universidade Católica Portuguesa, June 2015.
Page | 3
Abstract
Title: Equity Valuation – Eurocash Group Author: Ana Isabel Antunes de Azevedo Branco
Equity valuation is an extremely complex and subjective process, it depends not only on the theoretical models but also on the analysis and assumptions used by the analyst. This thesis focuses on the valuation of Eurocash Group, a leading wholesale distributor of fast moving consumer goods (FMCG) in Poland.
In order to present stronger conclusions we decided to use two different models: the discounted cash-flow (DCF) model and the multiples method as a complement. The combination of both lead us to a price target of roundly PLN 35,42 while shares were trading at PLN 32,96 (02/03/2015), so our recommendation was to buy.
Our valuation was compared with the equity research from Wood & Company, “a leading independent investment bank in central and Eastern Europe”. The research team used also the DCF model and the multiples method to perform the valuation and reach out a price target of PLN 39 while shares were trading at PLN 32,2 (04/11/2014), so their recommendation was also to buy.
Page | 4
Acknowledgments
Católica-Lisbon School has been my second, and sometimes first, home for the last years. This dissertation is a closure of this cycle and this last months were very important to consolidate some knowledge.
Professor José Tudela Martins was crucial on this process and helped me with his advices. I also have to thank Inês Cassiano and Jordi Martins for the support and especially to my boyfriend, Gonçalo Carreteiro, who was always with me during this journey.
Finally I have to thank to the most important person; my father. Throughout my life he never let me give up on anything even when all around us was falling apart. For all the support and wisdom advices I want to give you the most honest and sincere “thank you”.
Page | 5 Contents Abstract ... 3 Acknowledgments ... 4 1. Introduction ... 9 2. Literature Review ... 10 2.1 Multiples Valuation ... 10 2.1.1 Peer Group ... 11 2.2 Profitability Models ... 12
2.2.1 Economic Value Added (EVA) ... 12
2.2.2 Residual Income (RI) Model or Dynamic ROE ... 12
2.3 Option Pricing Theory ... 13
2.4 Cash-flows Based Valuation Methods ... 14
2.4.1 Dividend Discount Model ... 15
2.4.2 Discounted Cash-Flow ... 15
2.4.2.1 Terminal Value ... 16
2.4.2.2 Discount Rate (WACC) ... 17
2.4.3 Adjusted Present Value ... 18
2.4.4 Conclusion ... 20
3. Eurocash Group - Business Overview ... 21
3.1 Macroeconomic Analysis: Poland ... 21
3.2 Polish FMCG Market ... 23
3.3 Wholesale Distribution of FMCG Market ... 24
3.4 Eurocash Group – The Company and its Business Formats ... 24
3.5 Eurocash Group - History ... 26
3.6 Eurocash Group - Year of 2014 ... 26
Page | 6
3.8 Eurocash Group - Factors Impacting the Development ... 28
3.9 Eurocash Group - Risks and Threats ... 29
4. Forecasting ... 30
4.1 WACC ... 30
4.2 Revenues ... 33
4.3 Cost of Sales ... 35
4.4 Operating Expenses ... 36
4.5 Net Working Capital (NWC) ... 40
4.6 Conclusion ... 42
5. Sensitivity Analysis ... 44
6. Multiples ... 46
7. Comparison with Research Note ... 49
7.1 Business Fundamentals Differences ... 49
7.2 Conclusion ... 52 8. Appendices ... 53 9. Investment Case ... 63 10. Bibliography ... 67 10.1 Articles... 67 10.2 Books ... 68 10.3 Other Research ... 68 10.4 Websites... 68
Page | 7
Index of Graphs
Graph 1 - Gross domestic product (GDP) between Poland and Organisation for Economic Co-operation and Development
(OECD) ... 21
Graph 2 - Unemployment rate between Poland and OECD ... 22
Graph 3 - Consumption between Poland and OECD... 22
Graph 4 - Relation between Revenues and Cost of Sales ... 36
Graph 5 - Relation between Selling Expenses and General and Administrative Expenses ... 37
Graph 6 - Relation between Depreciation, Property Plant and Equipment and CAPEX ... 39
Graph 7– Price Performance, Last 12 Months ... 65
Index of Charts Chart 1 - Structure of FMCG Market in Poland ... 24
Chart 2 - Capital Structure of Eurocash Group... 32
Chart 3 - Projections of Stores for Cash & Carry and Delikatesy Centrum ... 34
Chart 4 - Historical Values of DSI, DSO and DPO ... 41
Chart 5 - Historical Values of Inventories, Accounts Receivable and Accounts Payable ... 41
Chart 6 - Projections of EBIT, Depreciation, ΔNWC and CAPEX ... 43
Chart 7 - Evolution of FCFF between 2015 and 2020 (Projections) ... 43
Chart 8 - Operating Expenses After 2015... 65
Index of Tables Table 1 - Consumer Price Index (CPI) change in Poland ... 23
Table 2 - Ratting Attributable to Companies based on Coverage Ratio ... 31
Table 3- Summary Table ... 32
Table 4 - Historical Growth: Poland’s GDP and Total Revenues ... 33
Table 5 - Average Growth: Poland’s GDP and Total Revenues ... 33
Table 6 - Stores of Cash & Carry and Delikatesy Centrum between 2007 and 2014 ... 34
Table 7 - Growth of Stores of Cash & Carry and Delikatesy Centrum between 2015 and 2020...33
Table 8 - Historical Growth of Different Business Units of Eurocash Group ... 35
Table 9 - Projections of Growth for Different Business Units of Eurocash Group ... 35
Table 10 – Relation between Cost of Goods Sold and Cost of Sales ... 35
Table 11 - Relation between Revenues and Cost of Sales ... 36
Table 12 - Growth of Selling Expenses ... 37
Table 13 - General and Administrative Expenses, Fixed Assets, D&A and CAPEX ... 38
Table 14 – Revenues Growth between 2006 and 2014 ... 38
Table 15 - Materials and Energy Growth between 2012 and 2014 ... 38
Table 16 - Projections of Growth for D&A and CAPEX ... 38
Table 17 - Projections for NWC and ΔNWC ... 42
Table 18 - Summary Table ... 42
Page | 8
Table 20 - Sensitivity Analysis (Variation of Final Growth Rate) ... 44
Table 21 - Sensitivity Analysis (Variation of Cost of Debt)... 45
Table 22 - Sensitivity Analysis (Variation of Capital Structure) ... 45
Table 23 - Multiples for Global Companies ... 46
Table 24 - Multiples for Western Europe Companies ... 47
Table 25 - Analyzing PER Multiple (Western Europe Companies) ... 48
Table 26 - Business Fundamentals Differences between Wood & Company and Thesis... 49
Table 27 - Business Differences between Wood & Company and Thesis ... 50
Table 28 - Multiples on the Current Market Price and Wood and Company’ Price Target ... 51
Table 29 - Key Estimates ... 64
Page | 9
1. Introduction
The main goal of this thesis is to value a listed company with reliable and appropriate models. For this purpose I chose to evaluate Eurocash Group which is listed on Warsaw Stock Exchange since 2005. The company is a leading wholesale distributor of FMCG in Poland with Cash & Carry and franchise store chains spread throughout the country.
We divided this thesis in three central parts: literature review, company and industry overview and the valuation itself.
Firstly, in literature review it will be presented different valuation models and their respective advantages and disadvantages. Even though it is pointed in Young et al. (1999) that “…virtually every popular valuation approach is simply a different way of expressing the same underlying asset”1
this valuation relies on two different models, DCF model and the multiples method as a complement, that give us different points of view and valuation ranges to not narrow our analysis.
Secondly we will analyze the company and the industry overview. We are going to present Eurocash Group business activities along with the retail and wholesale market environment. We thought that was also important to take a look at the macroeconomic situation that surrounds this business, particularly in Poland.
Lastly, we will perform the valuation itself. We made projections between 2015 and 2020 and reached out a price target of PLN 35,42. During this process we had to make some assumptions based on historical financial data but also on company’s development strategy. Our conclusions will be compared with a published equity research from Wood & Company and their price target of PLN 39.
1
Page | 10
2. Literature Review
Behind the valuation of a company may be several reasons as it was defended by Fernandéz (2004) and in our case it is to value a listed company. The author suggests that in this case there are three possible scenarios: to compare the price achieved with the share’s price and decide whether to sell, buy or hold stocks; to decide the securities that the portfolio should focus on; and, to make comparisons among the companies.
Before starting this valuation it is also important to keep in mind some crucial aspects. This process is not straightforward, the use of subjective inputs can lead us to different valuations and a good valuation will not last forever, the market is constantly changing.
In addition to the complexity of the valuation in itself finding the right model is also a true challenge. The different methodologies present some advantages and disadvantages and it is important to find the best one that suits our goals. Young et al. (1999) defends that the existence of so many approaches hamper the work of valuation and it is fundamental do “cut through this complexity”2
.
So in this section we are going to present four major methods of valuation and their subsequent branches: relative valuation or multiples, profitability models, option pricing theory and cash-flows based valuation methods.
2.1 Multiples Valuation
The valuation by multiples or relative valuation is a simple and popular method. It can be used by itself or, more usually, as a complement to other models according to Baker and Ruback (1999) and Lie and Lie (2002). This idea is also corroborated by Fernandéz (2001) that claims “multiples are useful in a second stage of the valuation… a comparison with the multiples of comparable firms enables us to gauge the valuation performed and identify differences between the firm valued and the firms it is compared with.”3
.
2
Young, M., Sullivan, P., Nokhasteh, A. and Holt, W. (1999), "All Roads Lead to Rome: An Integrated Approach to Valuation Models", Goldman Sachs Investment Research, p. 1.
3
Fernandez, P. (2001), "Valuation Using Multiples. How do Analysts Reach Their Conclusions?", IESE Business School, p. 1.
Page | 11
Baker and Ruback (1999) also praise the advantages of multiples when comparing to the DCF method. One of the most notorious is that multiples method uses current market measures avoiding the problems that arise from the use of theoretical models and historical data.
In addition Cooper et al. (2001) establishes a difference between two types of multiples: enterprise value (EV) and equity multiples. In the first case, it is taken into consideration the value of the whole company and in the second only the correspondent value of the assets and cash-flow of the business attributable to shareholders. EV multiples uses information like sales while equity multiples uses earnings, for instance.
There are several EV and equity multiples but the most used within these two categories are EV/EBITDA and price-to-earnings (PER), respectively. EV/EBITDA performs an asset valuation therefore to find equity values we must deduct net debt. PER, on the other hand, is widely popular since it links companies’ value to profit and it is, in generally, easy to calculate. According to Liu et al. (2002) EV multiples yield more precise pricing than the PER since the first one minimizes the problem related to the different capital structures. Moreover, sometimes may be important to make some adjustments. Multiples can be misleading as is it stated by Goedhart et al. (2005). They can be easy to manipulate, because of depreciations and provisions and may vary whether it is because of differences in the quality of the business (differences in value drives), accounting differences, fluctuations in cash-flow or profit and mispricing, Cooper et al. (2001).
To conclude, there are two main steps of this process: the choice of the multiples and the peer group selection.
2.1.1 Peer Group
The choice of the peer group is until today one of the greatest challenges when performing a valuation by multiples. It is difficult to find a group of companies with similar characteristics as it is defended by Henschke and Homburg (2009).
We can apply a simplistic technique by using the companies that are consider the most direct competitors of our target company even though they cannot be exactly alike. Koller et al. (2005) said that the definition of the peers should lies on statistics like return on invested
Page | 12
capital (ROIC) and long-term growth but sometimes this kind of information is not widely available.
It is not proven that the selection of the peer group will lead to positively skewed distributions, according to Lie and Lie (2002), so it is important to understand the limitations of this method.
2.2 Profitability Models
The profitability models are based on the difference between the companies’ performance and the cost of financing. The importance of these models arises from one of the main drawbacks of the DCF models: the lack of detailed information about performance that it is fundamental for the market to understand the strengths and weaknesses of the company. In this section, we are going to look at two of the most important profitability models.
2.2.1 Economic Value Added (EVA)
EVA is one of the most recognized profitability models and changed the way many people perceive value. It is a derived model from DCF and, in accordance with Tully (1993), is a measure of corporate performance that enables investors to recognize investments opportunities and stimulates managers to make value added business decisions.
The economic value added of a company is the difference between the return of invested capital (ROIC) and the cost of capital, multiplied by the invested capital as we can see by the formula bellow. Notwithstanding, to generate economic profit, the ROIC should be higher than the weighted average cost of capital (WACC).
2.2.2 Residual Income (RI) Model or Dynamic ROE
RI is another profitability model similar to the EVA the only difference is the interpretation of the results; while EVA looks at the company as a whole the RI is only seen by an equity perspective.
Page | 13
In spite of the advantages of these models, mentioned above, they also have some weaknesses. The profitability models are based on accounting data that could lead to a deceptive valuation, if all income and expenses are not reported accurately. Moreover, their optimal time structure is short term forecasting and it is the main reason why we are not going to use none of them.
This model also has an equivalent DCF model, the dividend discount model (DDM).
2.3 Option Pricing Theory
Option valuation is one of the most complex methods since it is not straightforward and the parameters, like volatility that is not observable, are difficult to estimate as it is stated by Fernandéz (2001). It is not easy to arrive to a proper valuation and therefore this method is mostly used when the others do not succeed. This is one of the main reasons why we are not going to use it along with the lack of applicability in the case of Eurocash Group.
Nevertheless real options allow for flexibility and this can, significantly, change the value of a business and the decision made. This kind of valuation is able to catch the value of a choice while most models ignore.
There are two methods of valuation, Binomial and the Black-Scholes models, and both account for options flexibility. Even though these two models are based on the same theoretical foundations and some equal assumptions they present some advantages and disadvantages when comparing to each other. The Black-Scholes model, for example, requires some strong assumptions about the volatility of the assets’ price. On the other hand, the Binomial model implies more calculations, such as the tree of stock prices, but can be applied to more situations. In the case of American options it is possible to exercise before the maturity date.
Page | 14
2.4 Cash-flows Based Valuation Methods
The models based on cash-flow are the most used and, apparently, trustworthy. We are going to present in detail three of these models: DCF or WACC, DDM and adjusted present value (APV). All of these models incur in the same process to obtain the present value: they use the future projections of the companies’ cash-flows and discount them at the cost of capital. One of the challenges of this process is exactly to estimate the discount factor. The capital asset pricing model (CAPM) introduced in Sharpe (1964) is the most used method for this purpose; this model relates the returns of the company and the market.
In spite of the wide use of CAPM, it is present in Schmidle (2006) a hard critic to this model as well as to Fama and French (1993), a three factor model, and to Koller at al. (2005), an implied-cost-of-capital method.
Schmidle (2006) is not the only author who is against the use of CAPM, Roll (1977) and Berk (1997) share the same opinion. The first one suggests that CAPM cannot be tested empirically and consequently has no predictive power. The second one says that the model assumptions are unrealistic.
“The equity beta is not stable for many companies and is a purely historically oriented, statistical concept, whereas the true cost of levered equity (the expected stock return) is future-oriented.”4.
Even though CAPM has been hardly criticized it is still the most used method. The return of a company is equal to the risk-free rate of the market, adding the company’s beta, multiplied by the market risk premium. The formula is given below and requires some parameters: a risk-free rate, a beta and market risk premium.
The use of the historical average risk-free rate, instead of the long term risk-free government bond, is one of the most common mistakes of the estimation of the risk-free rate according to Fernandéz (2004). It is important to bear in mind that a risk-free investment requires that there is neither default nor reinvestment risks.
4
Page | 15
The beta of a company or the systematic risk measures the correlation between the company itself and the market volatility. Although there are some studies, like Bendeck et al. (2004), that states that beta could assume a negative value we are going to assume always a positive one.
The market risk premium results from the difference between returns on the market and returns on the risk-free government bond. According to Fernandéz (2004) there are three different concepts about market risk premium: the required, the historical and the expected. The CAPM assumes that the required market risk premium is equal to the expected market risk premium.
2.4.1 Dividend Discount Model
The DDM model, as a cash-flow based valuation, follows the process previously explained and uses the future dividends. The main idea behind DDM is the following: if the price target is higher than what the shares are currently trading at, then the stock is undervalued and vice-versa.
This model is not applicable to all the companies; companies that do not have stable dividends or do not distribute them are not suitable. Moreover DDM does not account for investments that generate value for the company.
The most used formula is called theGordon growth model, Gordon et al. (1956). There are two inputs to this model: expected dividends and the cost on equity. To obtain the first one we need to make assumptions about expected future growth rates in earnings and payout ratios. The stock price resulting from this model is also very influence by the growth rate chosen; small variations in this rate will have a huge impact in the price target.
In conclusion this model is not the most widely used but establishes a based for others models. For this reason we are not going to use it in our valuation.
2.4.2 Discounted Cash-Flow
DCF remains the most used valuation method since it relies only on the cash-flow that goes in and out of the company. While DDM focuses on equity value DCF sees the company as a whole (enterprise value). Following the same reasoning of the cash-flows based models we
Page | 16
need to discount future cash-flows at the cost of capital. Given that we are looking at the enterprise value, this discount factor should account for the cost of debt and equity of the company at the same time, such as WACC. WACC based models perform better when a company maintains a relatively stable capital structure. The DCF formula is the following:
The DCF model estimates the cash-flows over the period, calculating the terminal value at the end of that period, and discounting them at the discount factor.
When using DCF there are also other two details that should be account for. First of all, there is no correct period to forecast cash-flows however periods between 5 and 10 years or 7 and 12 years are the most used; we only have to make sure that the company is already in steady state. Secondly, it is important to distinguish free cash-flows to the firm (FCFF) and free cash-flows to equity (FCFE). While the first one looks at the cash-flows that will go to the firm and it is discounted at the WACC the second one is centered on the cash-flows that will be available to the equity holders and it is discounted at the cost of equity. Nonetheless the results should be equal. We can see the relation between these two measures in the formula below.
Even though DCF is the preferred valuation methodology this approach has some disadvantages. One of them is that the model only focuses on long-term valuation. Additionally, this method is not suitable for all companies; companies with a lot of change in their capital structure, as we mention above, should use the APV method instead.
2.4.2.1 Terminal Value
The terminal value represents the value that the company will be worth at the time we assume a stable growth forever. There are four different methods to calculate the terminal value, identified by Koller et al. (2005): the cash-flow, the multiples, the liquidation value and the replacement cost approaches.
Page | 17
The cash-flow approach assumes that the company will be growing at a stable rate. This constant rate should be smaller than the growth rate of the economy in which the company is inserted on.
The second one, the multiples approaches, consider that the value of the company will be a multiple of its future earnings or book value and that is, usually, based on current company’ multiples. The current multiples should take into consideration the expected growth of the company for the explicit period and for the future growth.
The liquidation value estimates that the terminal value is equal to the estimated value of the sale of the assets minus the liabilities of the company. The author recommends that this method should only be use if the liquidation is likely to happen at the end of the forecast period.
Finally, the replacement cost approach reports that the terminal value equal to the expected cost to replace the company’s assets. Albeit this method has at least two problems since not all tangible assets are replaceable and not all the company’s assets will ever be replaced.
2.4.2.2 Discount Rate (WACC)
WACC formula takes into consideration the capital structure of the company, giving weight to debt, mixed instruments and capital, respectively as it is presented in the formula below.
According to Koller et al. (2005) to estimate the WACC we need three parameters: the cost of equity, the after-tax cost of debt, and the company’s target capital structure. However none of the variables are directly observable so we need to apply different models, assumptions and approximations.
The preference for the WACC collects a great consensus among analysts since it is based on the actual in and out flow of cash instead of accounting flows, Goedhart et al. (2005). This method also became popular because it is easy to compute and includes the advantage of debt (higher debt leads to higher tax shield).
Page | 18
2.4.3 Adjusted Present Value
APV computes the cash-flows of the company and uses the cost of equity as a discount factor. In this method we are calculating the value of the company as if it was entirely financed by equity. This method specifically forecasts and values any cash-flows related to capital structure separately, rather than enclosing their value in the cost of capital, Koller et al. (2005).
The limitations of the DCF model lead to an increase of the use of APV.
“APV always works when WACC does and sometimes when WACC doesn't, because it requires fewer restrictive assumptions. Besides this APV is less susceptible to yield serious errors than WACC is. But, most important, general managers will find that APV's power lies in the managerially relevant information it provides.”5.
As reported by Damodaran (2002) the process of valuation is based on three steps: the estimation of the value of the company with no leverage; the present value of the interest tax savings generated by borrowing a given amount of money; and then the evaluation of the effect of borrowing the amount considering the probability that the company will go bankrupt, and the expected cost of bankruptcy.
The price value of tax shields (PVTS) are the savings that arise from debt financing since debt interest are not subjected to taxes. The formula is given below:
However as the debt increases, along with the tax savings, some costs arise like the costs of financial distress. Calculating the expected bankruptcy costs (BC) is one of the most important and difficult steps in the valuation and some of the inputs are hard to calculate. According to Damodaran (2002), for example, one of the solutions to calculate the probability of default (PD) is to use the bond rating of a company, if exists, as an estimate. The formula is also given below:
5
Page | 19
Many authors believe that the APV is a more flexible method for valuation when comparing to the discounted cash-flow methods. This seems true in most cases but APV model has some significant drawbacks according to Damodaran (2002).
“The first and most important is that most practitioners who use the adjusted present value model ignore expected bankruptcy costs. Adding the tax benefits to unlevered firm value to get to the levered firm value makes debt seem like an unmixed blessing. Firm value will be overstated, especially at very high debt ratios, where the cost of bankruptcy is clearly not zero and, in some instances, the cost of bankruptcy is higher than the tax benefit of debt.”6.
6
Page | 20
2.4.4 Conclusion
There is no consensus among the different authors about equity valuation. However the several approaches are important to realize which one better suits our company’s characteristics and its respective industry.
For the valuation of Eurocash Group and based on the reasons previously explained we chose to use two different methods: DCF model and multiples method as a complement. The use of DCF instead of APV model relies mainly in the relatively stable capital structure of Eurocash Group throughout the years.
Page | 21
3. Eurocash Group - Business Overview
Eurocash Group has its business activities established in Poland so it is fundamental to analyze the market environment of the country, primarily in the year of 2014. The Polish economy has a huge influence in the company’s results and consequently in its valuation.
3.1 Macroeconomic Analysis: Poland
Poland is the largest member of the European Union (EU) among all countries of Central and Eastern Europe. Poland’s economy performance has been remarkable over the last years and it is one of the fastest growing within the EU.
The market environment can be reflected through some economic measures that have a direct and indirect impact on the domestic demand and therefore in the revenues of the company.
Graph 1 - Gross domestic product (GDP) between Poland and Organisation for Economic Co-operation and Development (OECD)
The forecasts are based on data of November 2014
Source: OECD website - http://www.oecd.org/
In Graph 1 it is visible that Poland’s GDP has been, over the last years, above the values of the OECD. This explains, in part, why polish economy has detached itself among other European countries. Eurocash Group stresses that, in 2014, the most contributors for this growth were the construction (4,7%), the industry (3,7%) and the trade (3,4%) sectors.
-4% -3% -2% -1% 0% 1% 2% 3% 4% 5% 2008 2009 2010 2011 2012 2013 2014 2015 2016 Poland OECD
Page | 22
Graph 1 also shows the forecasts for the next two years, where it is expected that Poland’s GDP will remain above OECD.
To corroborate the thriving situation for polish economy we present the two graphs bellow.
Graph 2 - Unemployment rate between Poland and OECD
The forecasts are based on data of November 2014
Source: OECD website - http://www.oecd.org/
Graph 3 - Consumption between Poland and OECD
The forecasts are based on data of November 2014
Source: OECD website - http://www.oecd.org/ 5% 6% 7% 8% 9% 10% 11% 2008 2009 2010 2011 2012 2013 2014 2015 2016 Poland OECD -3% -1% 1% 3% 5% 7% 2008 2009 2010 2011 2012 2013 2014 2015 2016 Poland OECD
Page | 23
In Graph 2 we can see that the unemployment rate is decreasing in the last years and the forecasts are following this trend. The population have a higher disposable income and consequently are more available to spend which leads us to Graph 3. Even though the irregularity of the values the tendency, in Poland, for the next years is to increase consumption.
Notwithstanding, 2014 was a difficult year for the food distribution market. There was a retail market deceleration and the like-for-like (LFL) sales (same number of stores) decrease among most of the market formats. Beyond this there was a continuing pricing pressure and deflation.
Table 1 - Consumer Price Index (CPI) change in Poland
Source: Central Statistical Office
In Table 1 we can see that the annual percentage change of CPI, a measure of inflation, in 2014 was flat when compared with 2013. In our projections we take into consideration the effect of unexpected changes in prices.
Table 1 also reflects the evolution of CPI change. In the last three years there was an evident decrease of this measure (deflation) mainly between 2012 and 2013 what in part can explain the decrease in revenues in those years. According to projections of PricewaterhouseCooper (PwC) in 2015 the inflation rate will be negative (-0,1) but then will recover to 1,7 in 2016 and 2,5 on average between 2017 and 2021.
3.2 Polish FMCG Market
The market of FMCG includes food and non-food products such as soft drinks, alcoholic beverages, tobacco products, household chemicals and cosmetics. This industry works mostly towards small grocery stores, kiosks, petrol stations and small catering outlets.
FMCG market is continuing growing in Poland and in 2014 registered a value of PLN 224.9 billion (an increase of 1,3% from previous year), as stated by GfK Polonia. Roundly 87% of the market value belongs to retail stores, large and small formats, while the remaining is generated by the HoReCa sector (hotels, restaurants and catering outlets).
2012 2013 2014
Page | 24
Chart 1 - Structure of FMCG Market in Poland
Source: GfK Polonia
Discount stores and supermarkets were the main drivers of this growth. While the market share of large format stores continues to increase (apart from hypermarkets) the small format stores are losing ground, Chart 1. Gfk Polonia also states that large format stores dominate the retail channels, traditional and modern, with 56% of market share.
3.3 Wholesale Distribution of FMCG Market
In 2014, the wholesale chain of Eurocash Group achieved 23% of market share in the wholesale market of FMCG. This represents an increase of 2 percentage points (pp) from previous year, without the effects of mergers and acquisitions.
The wholesale distribution of FMCG market compete mainly in the provision of independent small supermarkets, traditional grocery stores, specialized grocery stores and in the alternative distribution channels like kiosks, retail outlets attached to petrol stations and HoReCa.
3.4 Eurocash Group – The Company and its Business Formats
Eurocash Group is one of the biggest groups in Poland “in terms of sales and number of outlets involved in the distribution of FMCG products”. The core business of the company is the wholesale distribution of products to customers across all significant traditional wholesale market segments, in particular, to traditional retail stores throughout Poland and to the market segment of petrol stations, restaurants and hotels.
46% 15% 17% 22% 44% 17% 15% 24%
Small formats & other (Convenience)
Supermarkets 300-2500 Hypermarkets Discounters
Page | 25
The company has developed a range of distribution formats focused on supplying independent stores in the country, which are the following:
Cash & Carry
“A nation-wide network of discount Cash & Carry type warehouses which operate under the “Eurocash Cash & Carry” brand, with the loyalty program for the “abc” network of grocery stores.”
Franchise Systems
Delikatesy Centrum - “A franchise system for retail stores which operate under the Delikatesy Centrum brand. Over 4362 retail franchise and partner stores under the brands: Lewiatan, Groszek, Euro Sklep, Gama supplied by Eurocash Dystrybucja.”
Distribution
Eurocash Dystrybucja – “The biggest polish nationwide distributor of FMCG providing trade of products with service to the client with the broad range of assortment.”
Eurocash Gastronomia – “Supply network for restaurant chains, hotels, and petrol stations.”
Eurocash Alkohole – “Specialized wholesale and retail distribution of alcoholic beverages throughout Poland.”
Eurocash Serwis – “Active distribution of tobacco products and fast moving consumer goods through KDWT and Service FMCG since 1st December 2014.”
Other
Beside the main business activity, the company also provides electronic financial services through PayUp, which offers, for example, bill payments and charge card payments. Eurocash Group distributes also tobacco and impulse products to press stores throughout Inmedio in which the Group controls 51% of shares.
Page | 26
3.5 Eurocash Group - History
Eurocash’s traditional activity as a Cash & Carry wholesaler dates back to 1995 but only on 2003 Eurocash Group established itself as an independent company. Luis Amaral, the current CEO, acquired Eurocash Cash & Carry to Jerónimo Martins under a management buy-out (MBO) and changed the strategy pursued until then. It took only two years to turn the company profitable again and in 2005 Eurocash Group, Eurocash S.A., launch its initial public offering (IPO) at the Warsaw Stock Exchange.
In the coming years Eurocash Group was focus on strengthening their position in the market with the acquisition of several brands and stores. The company is a well recognized brand for its dynamic growth. Since 2006 the Group was joined by:
2006 - Delikatesy Centrum and KDWT
2007 - Pay Up
2008 - Mclane Polska
2009 - Batna
2010 - Premium Distributors
2011 - Pol Cater and Tradis
2012 - Noban and Dziembor
2013 - Kolporter, Inmedio and Frisco.pl
3.6 Eurocash Group - Year of 2014
The year of 2014 was an important year to introduce some changes across Eurocash Group.
Finalization of the integration of Tradis (currently Eurocash Dystrybucja) and the merger with Service FMCG, an entity that acquired Kolporter’s FMCG business. Due to this last combination the company has created the largest entity in the tobacco product distribution market (approximately 25% of market share).
Opening of the first three KONTIGO stores. This brand was developed to achieve exclusively the women target and to enter into the cosmetics´ market.
The company also tried to provide to clients a wide selection of wines with “Factoria
Page | 27
Partnership with HDS in the Inmedio concept which aims to develop media-and-convenience locations and to transfer Inmedio’s experiences over the traditional retail. This FMCG market includes products like newspapers, magazines, books, tobacco products, beverages, confectionery and impulse products, and also offers payment and courier services.
Eurocash Group became also a significant shareholder in Frisco.pl, the largest grocery operator in this segment in Warsaw. This project combines the advantages offered by online and traditional retail.
3.7 Eurocash Group - Development Strategy
The most important goal of Eurocash Group is to strengthen the competitiveness of independent retail stores in Poland and to offer value to its customers and shareholders. The strategy of the Group is focused on the customer and passes through specific distribution channel formats:
Cash & Carry warehouses and the loyalty program of stores (“abc” network) provide
FMCG products to small and medium retail stores
Eurocash Dystrybucja and partner stores provide FMCG products and give support to
manage retail operations to small and medium retail stores
Delikatesy Centrum franchise network provide comprehensive delivery of products to
retail stores
Eurocash Serwis (KDWT) provides specialized deliveries of specific product
categories such as tobacco products and FMCG
Eurocash Alkohole provides specialized deliveries like alcoholic beverages
Eurocash Gastronomia and Eurocash Dystrybucja provide comprehensive delivery for
specific products and high service quality to restaurant chains, hotel chains and petrol station
This development of the Eurocash Group is directly related with the ambition to reach a new group of customers and to consolidate the already existing. The strategic goals of the company are:
to provide to customers a wide range of distribution formats and forms of cooperation to assure that their needs are satisfied with quality,
Page | 28
to achieve economies of scale in wholesale business operations to create competitive
advantage, and
to incorporate operating systems and optimize costs.
The strategy of Eurocash Group also aims to grow across every distribution format as well as the continuation of acquisitions of other wholesalers and franchise networks.
3.8 Eurocash Group - Factors Impacting the Development
Eurocash Group stressed, in their last consolidated annual report, some external and internal factors, that can impact their development and influence their valuation. It is difficult to take these factors into consideration but being aware of them made us being more cautious.
Growth in the FMCG market and changes in market structure
The Group aims to fortify its position in modern distribution channels. The negative effects will be compensated by the growth of the FMCG market and the consolidation in the wholesale market through traditional channels.
Inflation
The results may be affected with unforeseen changes in the prices of the product. Payroll costs
An unexpected problem on the payroll costs may harm the performance of the company. However with the increase of the remuneration level in Poland (higher sales for the company) this problem can be solved.
New business formats
Creation and development of formats for wholesale distribution in order to enlarge the range offered to customers and to achieve economies of scale.
Organic growth
Eurocash Group has good prospects for 2015 with the open of new stores. Nonetheless this growth is, somehow, dependent on the integration of Tradis. Tradis was a major investment for the company and until now it seems to be successful.
Page | 29
3.9 Eurocash Group - Risks and Threats
Eurocash Group is exposed to certain risks that may be harmful. Some of them are enumerated bellow and were, once more, referred by the company in their last consolidated annual report.
Macroeconomic situation: purchasing power of the population
An economic deceleration will lead to a decrease in the purchasing power and consequently to a decrease in the sales revenues.
Structure of FMCG retail distribution market in Poland
In 2014, the traditional distribution channel had an important share on the FMCG retail distribution, approximately 44% (one of the highest in the European countries). The growth in the share of modern distribution will minimize the opportunities in the traditional market for the company.
Structure of the traditional FMCG distribution channel: competition
The entrance of new and strong players as well as the setting of the older ones could have a negative impact on margin levels.
IT systems
Possible problems in the IT systems could affect the Group’s business. New investments
This process can lead to several material risks related to integration, achievement of synergies or an inadequate evaluation of the market potential.
Page | 30
4. Forecasting
Forecasting the business fundamentals is one of the most important and complexes parts of equity valuation.
During this valuation we will not consider Poland as an emerging market so the CAPM should work and no further adjustments will be required. According to the World Bank Atlas method Poland is considered a high-income economy with a gross national income (GNI) per capital of $12,746 or above like Germany. Furthermore Poland is not only a member of the EU as well as the sixth-largest economy.
4.1 WACC
As it was explained in the literature review, the WACC is the company’s cost of capital in which each type of capital, debt and equity, has its weight, assuming that the mixed instruments are equal to zero.
For this calculation we need to estimate: the risk-free rate, the market risk premium and the equity beta to achieve the cost of equity and then the corporate tax rate, the cost of debt and the capital structure to reach WACC. We used two different methodologies for the calculation of these parameters: historical data and current data at the date of 02-03-2015.
For the risk-free rate we used the 10 year Poland Government Bond which was roundly 2,14% in 02-03-2015. This rate should be expressed in the currency of the company’s country and the market should be highly liquid.
The average market risk premium was achieved based on historical data; we used monthly data between March 2014 and March of 2015 and as benchmark the 10 year Poland Government Bond. We could have used more data however due to the instability of the last years we considered that this period should be the most representative of the upcoming years. The equity beta of 1,053 was taken from Bloomberg using the relative index (WIG 20 Index, from Poland) at the date of 02-03-2015.
Page | 31
For the effective tax rate we applied the 16% used by the company in 2014. We are going to use this rate in the whole explicit period since there is no indication for a future change in this sense.
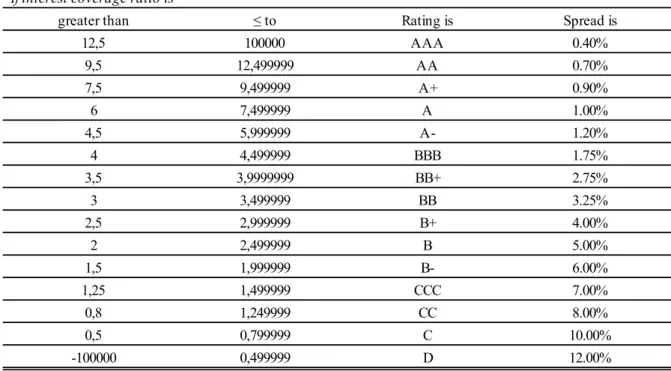
For the cost of debt we did not find the information associated with the issue of bonds (PLN 140 million) of Eurocash Group in 2013. These bonds will mature in June 2018 and their effective annual interest rate is WIBOR 6M plus a margin of 1.6%. Instead we used a study done by Damodaran that relates ratings, interest coverage ratios (EBIT divided by interest expenses) and default spread to all of the rated companies in America at January of 2015. Eurocash Group is in the category of smaller non-financial service companies with market capitalization bellow $ 5 billion. So according to this measures the attributed rating based on values of 2014 is BB+ and the consequent cost of debt is 4,89%, 2,75% plus 2,14 % (spread plus risk-free rate).
Table 2 - Ratting Attributable to Companies based on Coverage Ratio
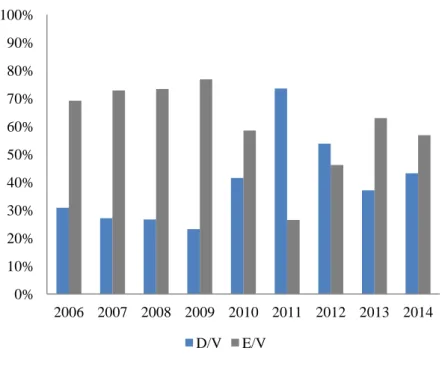
Since 2006 the ratios of capital structure, E/V and D/V, have been roundly 70%/30% and 60%/40%. Only in 2011, principally, and in 2012 the ratio of D/V was higher than the ratio of E/V because of the major investments in the business units and the need to contract debt. The company does not report any target to these ratios so we are going to assume for E/V and D/V, 60% and 40% respectively, based on historical data and on future plans since there are
If interest coverage ratio is
greater than ≤ to Rating is Spread is
12,5 100000 AAA 0.40% 9,5 12,499999 AA 0.70% 7,5 9,499999 A+ 0.90% 6 7,499999 A 1.00% 4,5 5,999999 A- 1.20% 4 4,499999 BBB 1.75% 3,5 3,9999999 BB+ 2.75% 3 3,499999 BB 3.25% 2,5 2,999999 B+ 4.00% 2 2,499999 B 5.00% 1,5 1,999999 B- 6.00% 1,25 1,499999 CCC 7.00% 0,8 1,249999 CC 8.00% 0,5 0,799999 C 10.00% -100000 0,499999 D 12.00%
Page | 32
no projections of significant acquisitions in a near future that could change this. The last historical year corroborates these values.
Chart 2 - Capital Structure of Eurocash Group
Table 3- Summary Table 0% 10% 20% 30% 40% 50% 60% 70% 80% 90% 100% 2006 2007 2008 2009 2010 2011 2012 2013 2014 D/V E/V Ke 8,13% Kd 4,89% Rf 2,14% E 60% Be 1,053 D 40% MRP 5,69% Tc 16% WACC = 6,5%
Page | 33
4.2 Revenues
Eurocash Group revenues come from Cash & Carry (including Batna stores), franchise systems, distribution and others such as Inmedio Sp. z o.o, PayUp Polska S.A., Eurocash Convenience Sp. z o.o., Kontigo Sp. z o.o., Eurocash Franczyza Sp. z o.o., Eurocash Detal Sp. z o.o. and Eurocash Trade 1 Sp. z o.o.. This is the main item of any valuation and requires a more careful and deeper analysis.
The forecast of revenues is a huge challenge; in this case the central issue was to evaluate the different business units. Throughout the years the company has been acquiring and merging with other companies so, occasionally, we were faced with incomplete data.
The first step was trying to find a relation between the growth of Poland GDP and Eurocash Group revenues. Since 2007 until 2012 the values were very different; the company was living a boost and growing more than the economy of the country as we can see in Table 4. Only in the last two years the values were similar and comparable, in fact the revenues growth was surpassing by the GDP growth, and for this reason we will not try to relate both.
Table 4 - Historical Growth: Poland’s GDP and Total Revenues
Table 5 - Average Growth: Poland’s GDP and Total Revenues
Instead we are going to use two different methods to define a trend for revenues growth: compound annual growth rate (CAGR) based on the number of stores and CAGR based on historical revenues. By using CAGR we are assuming that the growth is going to be constant between the years so some additional adjustments were required.
The revenues for the Cash & Carry and Delikatesy Centrum were estimated based on the CAGR of the stores and the average revenues per warehouse. This CAGR suffered some modifications throughout the explicit period since the values between 2007 and 2014 were extremely high.
2007 2008 2009 2010 2011 2012 2013 2014
Growth of Poland's GDP 6,80% 5,10% 1,70% 3,90% 4,30% 2% 1,60% 3,30% Growth of Total Revenues 46,12% 29,60% 9,28% 16,32% 28,09% 66,42% -0,43% 2,58%
Average 2007-2012 Average 2013-2014
Growth of Poland's GDP 3,97% 2,45%
Page | 34
Table 6 - Stores of Cash & Carry and Delikatesy Centrum between 2007 and 2014
Table 7 - Growth of Stores of Cash & Carry and Delikatesy Centrum between 2015 and 2020
Chart 3 - Projections of Stores for Cash & Carry and Delikatesy Centrum
In the case of Eurocash Dystrybucja (Tradis) the revenues of 2014 were affected by the business restructuring and the termination of contract with Stokrotka chain in the middle of 2013. Nonetheless the key stage of the integration of Tradis was already concluded and the good results were visible in the last quarter of 2014. This business unit accounted for 25% of total sales of Eurocash Group last year. Our projections, Table 9, were based on the potential of Eurocash Dystrybucja but at the same time we were cautious and expecting a slow recovering since last year there was a decrease of more than 10%, Table 8.
The business units of Eurocash Alkohole and Eurocash Serwis are the biggest contributors along with Cash & Carry and Delikatesy Centrum for the growth of the revenues in the last years. In 2014, the two together accounted for 31% of total sales of Eurocash Group surpassing Cash & Carry. One of the reasons for the growth of Eurocash Serwis was the merger with Service FMCG that led to the largest entity in the tobacco product distribution market. In our projections we took this into consideration and attribute to this business unit the biggest rates of growth, Table 9. However, according to the company the increase in sales 2007 2008 2009 2010 2011 2012 2013 2014 CAGR CAGR 2012-2014 Adjustment
Cash & Carry 102 111 120 129 137 148 158 168 6,44% 4,32% 3%
Delikatesy Centrum 295 376 466 561 650 773 875 1003 16,53% 9,07% 4%
2015 2016 2017 2018 2019 2020
Cash & Carry 6,44% 6,44% 4,32% 4,32% 3% 3%
Delikatesy Centrum 16,53% 9,07% 4% 4% 4% 4% 179 190 199 207 213 220 1169 1275 1326 1379 1434 1491 2015 2016 2017 2018 2019 2020
Page | 35
of Eurocash Alkohole was due to an increase of the level of prices followed by an excise tax increase in 2014 and market share gains so our projections were more conservative than the CAGR of last year, Tables 8 and 9.
The Eurocash Gastronomia accounted for 3% of total sales of Eurocash Group. In the last three years the revenues of this business unit have been consequently decreasing. The last year was a very difficult year for the food distribution market and these values were a reflection of that. The termination of the contract with Amrest, one of the main clients, jeopardized also the results. Although within three years we believe that the company can, reverse this situation and grow positively again, Table 9.
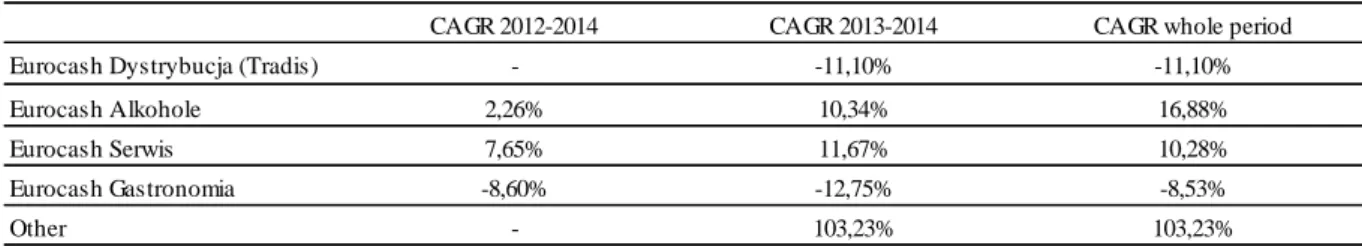
Table 8 - Historical Growth of Different Business Units of Eurocash Group
Table 9 - Projections of Growth for Different Business Units of Eurocash Group
4.3 Cost of Sales
Cost of sales represents the costs involved in the process of creating a product or a service. Eurocash Group includes in their cost of sales three different items: cost of goods, sales and materials sold. The cost of goods sold is the main item in this division and accounted for roundly 99% of the cost of sales in the last years. Due to this the cost of goods sold and the cost of sales will be treated as equals.
Table 10 – Relation between Cost of Goods Sold and Cost of Sales
CAGR 2012-2014 CAGR 2013-2014 CAGR whole period
Eurocash Dystrybucja (Tradis) - -11,10% -11,10%
Eurocash Alkohole 2,26% 10,34% 16,88%
Eurocash Serwis 7,65% 11,67% 10,28%
Eurocash Gastronomia -8,60% -12,75% -8,53%
Other - 103,23% 103,23%
2015 2016 2017 2018 2019 2020
Eurocash Dystrybucja (Tradis) 2,5% 2,5% 2% 2% 2% 2%
Eurocash Alkohole 6% 5% 5% 4% 4% 3% Eurocash Serwis 10% 10% 8% 8% 5% 5% Eurocash Gastronomia -5% -1% 1% 1% 2% 2% Other 75% 55% 35% 20% 15% 5% In Millions of PLN 2010 2011 2012 2013 2014 Cost of Sales 6990,49 8992,87 14818,50 14863,80 15151,60
Cost of Goods Sold (COGS) 6987,97 8988,87 14650,57 14734,88 15027,14
Page | 36
Table 11 - Relation between Revenues and Cost of Sales
Since 2006 cost of sales has, consequently, a weight of about 90% of the value of revenues, as it can be seen in the table above. The company has been able to manage this ratio and to maintain a stable relation between both items. This relation allows us to establish a simple pattern to forecast cost of sales growth; since this seems to be a recurrent policy in the company we are going to assume that the cost of sales will always be 90% of the revenues. It is important to keep in mind that this margin will have a huge impact on valuation of the company.
Graph 4 - Relation between Revenues and Cost of Sales
The values are in Millions of PLN
4.4 Operating Expenses
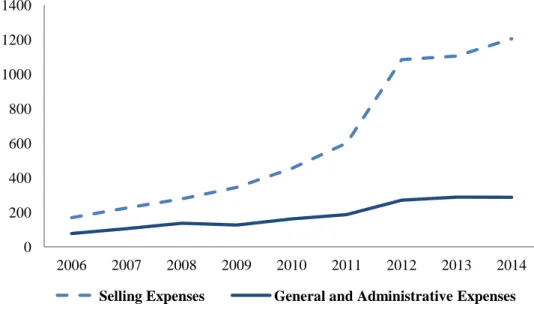
The difference between gross profit (revenues minus cost of sales) and profit on sales are the operating expenses that include selling expenses, such as sales, marketing and advertising, and general and administrative expenses. Even though the rate of growth has not been constant between these two items it moves in the same direction since 2006 (except in 2009 and in 2014).
In Millions of PLN 2006 2007 2008 2009 2010 2011 2012 2013 2014 Revenues 3236,98 4729,87 6129,74 6698,34 7791,76 9980,60 16609,29 16537,53 16963,85 Cost of Sales 2930,78 4306,16 5562,64 6054,91 6990,49 8992,87 14818,50 14863,80 15151,60 % of Cost of Sales in Revenues 90,54 91,04 90,75 90,39 89,72 90,10 89,22 89,88 89,32
0 3000 6000 9000 12000 15000 18000 2006 2007 2008 2009 2010 2011 2012 2013 2014
Page | 37
Graph 5 - Relation between Selling Expenses and General and Administrative Expenses
The values are in Millions of PLN
Due to the nature of this item we can establish a close relation between selling expenses and revenues. Throughout the years the company has increasingly raising these costs in order to generate more revenues. This growth was based on CAGR of the last three years, which we believe that are the most representative years, with some adjustments. Since in our projections some business units are going to grow at relatively high rates, mainly Cash & Carry, Delikatesy Centrum and Eurocash Serwis, we decide to forecast this item at a higher rate than its CAGR (4,5% vs roundly 3,6%).
Table 12 - Growth of Selling Expenses
In the case of Eurocash Group, general and administrative expenses include depreciation and amortization (D&A), materials and energy and taxes and charges. The first two are the main drivers of general and administrative growth and we will connect their growth. In the case of D&A we can relate this item with capital expenditures (CAPEX) and fixed assets while materials and energy are related, in part, with revenues.
0 200 400 600 800 1000 1200 1400 2006 2007 2008 2009 2010 2011 2012 2013 2014
Selling Expenses General and Administrative Expenses
In Millions of PLN 2006 2007 2008 2009 2010 2011 2012 2013 2014 CAGR 2012-2014 Selling Expenses 169,31 225,44 278,06 344,62 454,27 601,10 1083,15 1104,39 1205,00 0,036
Page | 38
Table 13 - General and Administrative Expenses, Fixed Assets, D&A and CAPEX
In the last three years the growth between fixed assets, D&A and CAPEX has been significantly different. In Table 13 we also can see that the growth of general and administrative expenses is more similar with D&A.
Table 14 – Revenues Growth between 2006 and 2014
Table 15 - Materials and Energy Growth between 2012 and 2014
In the other hand, in Tables 14 and 15 we can see that the growth of revenues and mainly of materials and energy has been lower than the previous items.
By combining all of this growth we achieve a rate of roundly 7,34% to forecast general and administrative expenses. We will adjust this rate to 5% since the higher value correspond to CAPEX and this item will suffer a deep cut due to the future plans of Eurocash Group.
For the forecast of D&A alone we should relate its growth with tangible and intangible assets and consequently with CAPEX.
Table 16 - Projections of Growth for D&A and CAPEX
In Millions of PLN 2006 2007 2008 2009 2010 2011 2012 2013 2014 CAGR 2012-2014
General and Administrative Expenses 77,02 105,74 137,05 126,83 161,77 186,62 270,40 287,61 287,13 2,02%
Property, Plant and Euipment 109,00 121,04 171,74 187,59 233,87 405,79 377,12 417,75 550,43 13,43%
D&A 32,05 35,69 42,96 49,32 60,27 72,80 113,36 116,46 125,29 3,39% CAPEX 29,72 49,01 59,13 83,41 56,65 49,33 101,46 172,98 228,39 31,06% In Millions of PLN 2006 2007 2008 2009 2010 2011 2012 2013 2014 CAGR 2012-2014 Revenues 3236,98 4729,87 6129,74 6698,34 7791,76 9980,60 16609,29 16537,53 16963,85 0,71% Growth - 46,12% 29,60% 9,28% 16,32% 28,09% 66,42% -0,43% 2,58% -In Millions of PLN 2011 2012 2013 2014 CAGR 2012-2014
Materials and Energy 66,72 131,37 124,58 118,89 -3,27%
Growth - 96,90% -5,16% -4,57%
Growth 2015 2016 2017 2018 2019 2020
D&A 20% 20% 15% 15% 10% 7,5%
Page | 39
Graph 6 - Relation between Depreciation, Property Plant and Equipment and CAPEX
The values are in Millions of PLN
CAPEX is an investment made by the company to acquire or improve the current assets. In the last years the main driver of CAPEX has been the acquisitions of several business units. In 2014, the highest expense for capital expenditures was related with merger transactions: acquisition of shares in PayUp and Inmedio. Besides this there were also investments in distribution centers of the Eurocash Group, investments in Cash & Carry stores, the development of Delikatesy Centrum franchise network and also the investment in hardware and software solutions.
However based on the last consolidated annual report there are no future specific plans of this dimension and as a result the growth of CAPEX in our projections would be more moderate in the following years, Table 16. The investments for 2015 are related to: organic growth within the current structure of business units, and in particular with the launch of 8 or 10 new Eurocash Discount Cash & Carry stores, the development of Delikatesy Centrum franchise chain and the replacement investment. In order to finance these investments Eurocash Group aims to use the resources generated by the company. It is also praised that if other important investments should be undertaken, the Eurocash Group has adequate credit repayment capacity to secure the financing.
For these reasons the growth of CAPEX would not follow the CAGR of roundly 30% of the last three years, Table 16. The growth of tangible assets will be directly related with the
0 75 150 225 300 375 450 525 600 2006 2007 2008 2009 2010 2011 2012 2013 2014
Page | 40
growth of CAPEX. We do not think that it is important to stress the role of intangible assets since their major role is related with acquisitions that we are putting aside for the next years.. On the other hand the growth of D&A, in the next years, is expected to be significantly higher than the previous years, mainly because of amortizations. We have been assisting to a constant increase in D&A; for example, between 2011 and 2012, there was a boost of more than 55% due to the acquisition of Tradis. The values in our projections, Table 16, are above the growth of CAPEX due to the latest investments.
The growth of other operating income and expenses, penalties for suppliers and inventory shortages for example and respectively were not object of a deep analysis due to its small significance. We used the approach of the CAGR of the last three years and within three years we adjusted the values for 7% and 4% respectively. The value of other operating expenses has, since 2006, always been higher than the other operating income, except in 2013. In our projections this situation remains but the difference is increasingly smaller.
4.5 Net Working Capital (NWC)
NWC is the operating liquidity of a company; it measures the short-term financial health by evaluating the difference between the current assets and liabilities, except the financial items such as cash and equivalents. In this category we can find current assets and liabilities like: trade receivables, inventories, current tax assets (receivables), short and long term prepayments and long term receivables, even though they are non-current, trade payables and current tax liabilities.
Due to the lack of information and discrimination it is hard to exalt the weight of each item through the years and consequently to forecast a variation in the NWC. So to achieve a reliable forecast we used three different measures: days sales of inventory (DSI), days sales outstanding (DSO) and days payable outstanding (DPO). The formula below, cash conversion cycle (CCC), establishes a relation between them.
CCC represents the number of days in which a company is able to transform its inputs into cash-flows, in other words, the time needed to sell the inventory, to collect the receivables and to make all of its payments timely. We used historical data for this purpose by analyzing the average of the last 9 years and the corresponding CAGR. We also incurred in the use of three
Page | 41
auxiliary formulas to get the projections of our three major items that we will use to forecast the variation of NWC: inventories, trade receivables and payables, appendices 16, 17 and 18.
Chart 4 - Historical Values of DSI, DSO and DPO
Chart 5 - Historical Values of Inventories, Accounts Receivable and Accounts Payable
The values are in Millions of PLN 0 10 20 30 40 50 60 70 80 2006 2007 2008 2009 2010 2011 2012 2013 2014
DSI DSO DPO
0 350 700 1050 1400 1750 2100 2450 2800 3150 2005 2006 2007 2008 2009 2010 2011 2012 2013 2014
Page | 42
Table 17 - Projections for NWC and ΔNWC
4.6 Conclusion
Table 18 - Summary Table
In Table 18 it is visible that we are expecting positive FCFF already in the first year of forecasts and unlike 2014. We established an explicit period between 2015 (year 0) and 2020 (year 5) years which is the time we believe it is needed for the company to finish the restructuring of its businesses and to fully grow. The number of shares used was roundly 138,69 million as it was reported in the last consolidated annual report and the final growth rate was 2%. Through this valuation we reached a price target of roundly PLN 37,74.
In Millions of PLN 2015 2016 2017 2018 2019 2020 NWC -356,86 -422,24 -490,03 -564,80 -640,86 -719,92 ΔNWC -59,10 -64,81 -65,58 -70,44 -71,16 -73,12 2015 2016 2017 2018 2019 2020 EBIT 213,88 285,63 319,93 347,77 354,61 347,84 EBIT(1-T) 179,66 239,93 268,74 292,12 297,87 292,18 D&A 150,35 180,42 207,48 238,60 262,46 282,15 Δ NWC -59,10 -64,81 -65,58 -70,44 -71,16 -73,12 CAPEX 262,65 288,91 317,80 341,64 367,26 385,63 FCFF 126,46 196,24 223,99 259,53 264,23 261,82 Discount Rate 6,52% 6,52% 6,52% 6,52% 6,52% 6,52% Discounted CF 126,46 184,23 197,41 214,72 205,22 4305,97
Page | 43
Chart 6 - Projections of EBIT, Depreciation, ΔNWC and CAPEX
The values are in Millions of PLN
Chart 7 - Evolution of FCFF between 2015 and 2020 (Projections)
The values are in Millions of PLN -100 -25 50 125 200 275 350 425 500 2015 2016 2017 2018 2019 2020
EBIT Depreciation Δ NWC CAPEX
126,46 196,24 223,99 259,53 264,23 261,82 2015 2016 2017 2018 2019 2020 FCFF
Page | 44
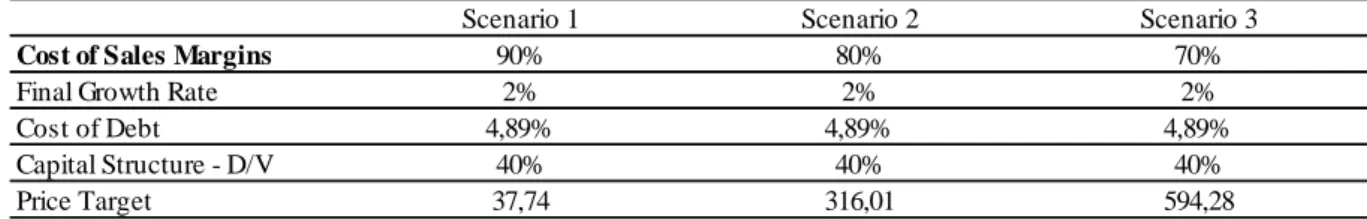
5. Sensitivity Analysis
Sensitivity analysis is a procedure that tests the final outcome by using different scenarios. We will test our valuation by changing some variables like the cost of sales margins, the final growth rate, the cost of debt and the capital structure. The last two variables will have a direct impact in WACC.
The cost of sales margins is a very important item in this valuation: for each zloty sold roundly 90 cents are soaked by the merchandise costs. It is important to notice that, everything else costs, if this margin decrease the target price will increase. If we decrease this margin by 10% the target price will be more than 8 times superior.
Table 19 - Sensitivity Analysis (Variation of Cost of Sales Margins)
On the other side the final growth rate and the target price move in the same direction. A higher final growth rate, with everything else costs, means a higher target price. We are assuming a final growth rate of 2% but variations of 1 pp will have a strong impact on the target price.
Table 20 - Sensitivity Analysis (Variation of Final Growth Rate)
The cost of debt and the capital structure, as we mentioned above, have a direct impact on the WACC. If the cost of debt increases the WACC will increase and consequently the target price will decrease. The capital structure has also a strong impact in the valuation; as the company is more financed by debt the lower is the WACC, so the conclusion is the opposite of the cost of debt.
Scenario 1 Scenario 2 Scenario 3
Cost of Sales Margins 90% 80% 70%
Final Growth Rate 2% 2% 2%
Cost of Debt 4,89% 4,89% 4,89%
Capital Structure - D/V 40% 40% 40%
Price Target 37,74 316,01 594,28
Scenario 1 Scenario 2 Scenario 3
Cost of Sales Margins 90% 90% 90%
Final Growth Rate 2% 3% 4%
Cost of Debt 4,89% 4,89% 4,89%
Capital Structure - D/V 40% 40% 40%
Page | 45
Table 21 - Sensitivity Analysis (Variation of Cost of Debt)
Table 22 - Sensitivity Analysis (Variation of Capital Structure)
Scenario 1 Scenario 2 Scenario 3
Cost of Sales Margins 90% 90% 90%
Final Growth Rate 2% 2% 2%
Cost of Debt 4,89% 5,89% 6,89%
Capital Structure - D/V 40% 40% 40%
Price Target 37,74 35,09 32,79
Scenario 1 Scenario 2 Scenario 3
Cost of Sales Margins 90% 90% 90%
Final Growth Rate 2% 2% 2%
Cost of Debt 4,89% 4,89% 4,89%
Capital Structure - D/V 40% 50% 60%