Joel Ferreira (2), S´ergio Nunes (1,2)
(1) INESC TEC / (2) DEI, Faculdade de Engenharia, Universidade do Porto, Portugal
{joel.filipe.ferreira,sergio.nunes}@fe.up.pt
Abstract. According to the published work, the analysis of DNS query log data is not a very common field of study unlike other types of queries. This may give the impression that this type of data is not a source of relevant information for the companies. In this work, we want to show that this is not true. A dataset composed by DNS queries, made by Por-tuguese users was analysed using statistical and data mining techniques. From this analysis it was possible to characterize the dataset and the users and to discover frequent association rules and sequential patterns from the queries made.
Keywords: Domain Name System, DNS Usage Mining, Association Rules, Sequential Patterns, Dataset Characterization
1
Introduction
The Domain Name System (DNS) is a hierarchical naming system built on dis-tributed databases for computers, services or any resource connected to the Internet or to a private network. DNS provides critical information for the op-eration of most of the Internet applications and services [1], since it transforms queries for domain names into IP addresses and can be seen as a bridge be-tween users and network applications [2]. A typical analogy to explain the DNS is comparing it to a phone book, that relates names of people to its correspond-ing telephone number. However, unlike the phone book, the update of the DNS can be done quickly without drawbacks for the users. As a distributed system, the DNS delegates the responsibility of assigning and mapping a set of domain names to IP addresses to authoritative name servers, which can do the same with a subset. Each record has a type, and a correspondent syntax, which reflects the intentions of the user. Besides the discovery of the IP address of a domain, it is also possible to discover the domain related with an IP address, to send requests related with the e-mail exchange and many other operations.
The goal of this study is to characterize a collection of DNS queries made by Portuguese clients of the SAPO Internet service and apply data mining tech-niques to discover association rules and sequential patterns of the domains re-quested by the clients.
2
Related Work
Although there are not many publications about the subject, Wu et al. [2] used DNS queries to create a recommendation system and detect domains with ma-licious activities. Clustering techniques were used to identify groups of users that have similar preferences and from that provide dynamic recommendations on DNS applications. Those clusters, by themselves, are not enough to capture the aggregated view of common user patterns. Hence, the goal is to transform transaction clusters into weighted collections of domain names, named aggre-gate usage profiles. Domains with a normalized value below µ are excluded from the profiles, in order to avoid domains visited a few times to interfere with the pattern extraction. Recommendations are made according to the similarity of the transaction to a profile and the weight of the domain in the profile. Each recommendation has an associated score than can be used to classify it.
The second application of the same paper is about the detection of domains with malicious network activities like zombie network or phishing, that are dif-ficult to identify. In the context of DNS query behaviour, each query is assumed to be created based on a set of hidden variables, also known as purposes, that are responsible to the page seen by the user. The PLSA model can generate the probability of choosing a certain purpose, P (zk), the probability of observing a
transaction given a certain purpose, P (ti| zk), and the probability of a domain
name being queried given a certain purpose, P (tj| zk). Applying Bayes’ rule to
these probabilities it is possible to compute the probability of a purpose given an observer transaction, P (zk | ti), or domain, P (zk | dj). For a domain name d, the
purposes zk with highest P (zk | d) values are assigned as its primary purposes.
Then, a Bayesian clustering algorithm is applied to the dataset and the domains are grouped according their dominant purpose.
Snyder et al. [3] proposed an approach to characterize a dataset collected from many servers, which may not have data relative to the complete period of the collection. Since the missing data may lead to biased results it is important to fill the holes and ensure that the main features of the traffic are preserved. This is done by comparing the periods of time when a server has missing data with traffic on that day and similar periods, either on that server and on other servers. After the completion of the data it is possible to characterize the users.
3
Methodology
At the beginning of this project some measures and types of analysis were already defined, either adapted from the Query log Analysis context or chosen due to the particularities of the available dataset. However, the analysis of a large dataset involves, often, an exploratory stage where the researcher looks at the dataset from different perspectives and, it is common the appearance of new types of analysis. Considering this, it is important to ensure that the way how the analysis is performed is easily adapted in case of need. Due to this reason the dataset was stored in a text file and the analysis was made through the use of UNIX
commands and scripts, instead of databases and SQL queries used in other works [4–6]. Perl [7] is the scripting language chosen due to its flexibility and efficiency when it comes to use regular expressions.
The analysis of the dataset also includes the creation of graphics and the calculation of some statistics to understand the information more easily. To do this, the R [8] programming language is used, due to its features on these areas. To draw the graphics the R package ggplot2 [9] is used, instead of the default graphics.
3.1 Dataset
The dataset provided has information recorded about the DNS queries made to SAPO’s DNS servers, covering approximately a period of one month in 2013 (from March 14 to April 15). This information is stored on a text file composed by approximately 14 million queries. However, some queries are not considered for the analysis as it will be explained on the next section. Each line (or record) of the dataset is as a request made by a client. A record is a set of fields, separated by the pipe character and is composed by 8 fields: Timestamp, Query ID (id of the DNS packet, used to distinct queries from different users), IP Hash, Query Name, Time To Live (TTL), Query Type (DNS operation requested), Answer Type and Location.
The Time To Live of a record is used as a caching mechanism of the DNS resolution process. If a user requires a domain that was previously requested by someone, before the expiration of the TTL, the server gives the same answer instead of performing the lookup process again. Despite the existence of many types of DNS records, each query made by the user has only one type and it determines how the DNS name server should answer to it. A query may have more than one answer, from one or more types. This happens for the user have alternative addresses in case of failure.
3.2 Dataset Preparation
Given that the analysis is based on the use of UNIX commands and regular expressions on text files, the first concern before starting any type of analysis is to ensure that each record has the same, and expected, structure and that each field contains the expected type of data. The fulfilment of these two assumptions is essential to have an homogeneous dataset, in which is possible to ensure that the regular expressions will match all the time. Due to the size of the dataset, it is impracticable to verify each record individually, which made this a process that was iteratively refined with the discovery of errors.
For the analysis purposes each IP is considered as a single client. This option is based on the fact that each IP has only requests on a single location and the IP addresses’ recycling policy adopted by SAPO. A client keeps the same IP along time, unless he reboots the router. However, even if the router is rebooted, he has a preference on its previous IP address, which means that if the IP address is not yet reassigned to another client he will have it back. Given that the dataset
only covers a period of a month and that, it is expected that the vast majority of the clients keep the same IP during the collection stage.
The preparation of the dataset can be grouped into five stages:
1. Removal of Undesired Records: Records with more fields than expected and/or empty fields were excluded from the analysis together with repeated requests. In order to make the analysis uniform, the first and the last days of the dataset were also excluded because of their incomplete data.
2. Removal of Undesired Characters: In some records the domain was preceded, or followed, by some special characters (’ and #) which are, re-spectively, the delimiter of a string and the comment sign on the Perl and R languages. These characters, without any escape character, were responsible for the referred programming languages not considering some records and led to wrong results. Since it is not common for the domains to have these characters they were removed instead of adding an escape character. 3. Selection of the Relevant Features: Although all fields of the dataset are
relevant in some aspects, not all of them are relevant to the characterization of users (Query ID, TTL, Answer Type), while others were used just a cou-ple times (Request Type). Processing the comcou-plete dataset would make the analysis process more costly, in time and resources, and considering that the dataset must be processed several times during the process it was necessary to optimize it. Hence, the most relevant features were selected to be part on a lighter dataset: Timestamp, IP Hash, Query Name and Location.
4. Preparation for the Sequential Patterns Discovery: The SPADE algorithm, implemented in the R package arulsesSequences [10], is the chosen one to discover sequential patterns in the log. Besides the adaptation of the dataset structure it is also necessary to select and prepare the data that is worthy of analysis. The first step is the removal of requests that are not relevant for the mining purposes, both requests of types that are not related with the resolution of a domain name into the correspondent IP address (PTR, SRV, UNKNOWN, SOA, TXT and NS) and some requests for addresses that were also seen as unnecessary (i.e. requests related with the DNS lookup process). IPs that only had one request on the log are also removed because they would make the discovery of patterns more costly. It was also noticed that some domains, despite having a different name, refer to the same Web site. Two different situations were detected: when a do-main is called with and without the prefix www. and when the dodo-mains are different (i.e. mail.google.com and gmail.com). While the first type of incon-sistency was solved with the addition of the ’www.’ prefix to some domains the latter was not addressed because it would require a manual analysis to the dataset which was not worthy, considering the number of queries for the ”alternative” names of a domain (i.e. while mail.google.com has almost 30,000 requests, the sum of www.gmail.com and gmail.com corresponds to only 1,000 requests).
For this study the time between requests was not considered for the creation of sessions. This option was taken because it is not clear yet how long is a
typical DNS usage session, unlike the Query Log Analysis where it is common to define that two consecutive requests made within a period of 30 minutes belong to the same session [4, 11, 12]. For this study, a 30-minute session would be too short because it would create too many sessions with only one request that, as stated above, are a barrier for the discovery of rules.
After the preparation, the complete dataset was composed by almost 2,000,000 sessions, which was not possible to process completely due to computational limitations. To solve this problem some thematic samples (Media, SAPO and Social Networks) of the dataset were created, using filters of domains. While the Media filter is composed by the most popular Portuguese newspapers, radios and televisions, the selection criteria used to create the sample related with SAPO was composed by the subdomains of sapo.pt (around 3,000 dif-ferent elements). Finally, Social Networks filter is composed by the domains of the three social networks with more users: Facebook, Twitter and Google Plus [13].
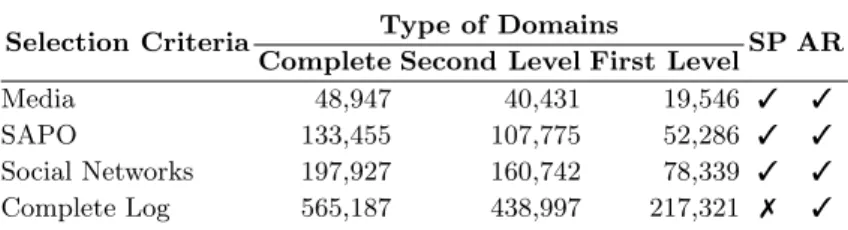
Besides the study on the Fully Qualified Domain Names (FQDN), such as ’www.test.foo.bar’, a similar analysis is made to the First Level Domains (FLD), which are composed by two elements (i.e. ’foo.bar’), and Second Level Domains (SLD), composed by three elements, (i.e. ’test.foo.bar’). The decision of including the last type of domains aims to have the best of the other two approaches. It does not have a string aggregation like the FLD, so it is possible to have patterns about the different services of companies. In Table 1 it is possible to see the number of different domains that exist on each sample. As expected, the number of different elements is higher for longer domains. Similarly to the study made by Soares et al. [6], for each scenario there is a high number of different domains, therefore not many sequences are expected to achieve the minimum support, considering the size of the log.
In order to have a better knowledge about the evolution of the results differ-ent minimum values of support and confidence are used. While the chosen values for the support are 100 persons, 0.1%, 1% and 5% of the clients, the values used for the confidence are 10%, 20%, 40%, 60% and 80%. Besides this, the experiments were also repeated with the additional restriction of only considering consecutive requests for the sequential patterns, to compare the number of patterns found on a latter stage.
Table 1. Number of different domains for each selection criteria.
Selection Criteria Type of Domains SP AR
Complete Second Level First Level
Media 48,947 40,431 19,546 3 3
SAPO 133,455 107,775 52,286 3 3
Social Networks 197,927 160,742 78,339 3 3
Complete Log 565,187 438,997 217,321 7 3
5. Preparation for the Association Rules Discovery: For this stage it was possible to use some of the previous preparatory work made for the sequential
pattern discovery stage, namely the thematic samples of the dataset. Since the algorithm only looks for co-occurrences of domains, having repeated do-mains on the sessions is not relevant. Due to this fact the existent repetitions of domains in the same session were excluded. Unlike on the sequential pat-terns discovery, it is possible to use the complete log for the association rule mining process. This allows to have a broader view on the most common associations of the complete set of clients instead of a sample, that may not represent a considerable piece of them. In Table 1 it is possible to see the number of different domains considered for this task. Similarly to the ap-proach taken for the discovery of sequential patterns, for this task different values of confidence and support are used. To discover the association rules on the dataset, the Apriori algorithm from the R library arules [14] was used.
4
Results
4.1 Characterization
The prepared dataset used for the characterization is composed by 13,365,090 requests, which gives an average number of 431,132 queries per day and a median value of 446,250. In Figure 1 is represented the average variation in the number of requests made on each day of the week from the average number of requests made on each day. As expected the volume of requests decreases on the weekends however, the observed drop is not as sharp as expected before the analysis. A similar approach was taken to study the variation on the volume of requests made on each hour of the day, whose results can be seen in Figure 2. The hour of the day with a higher number of requests is from 00:00 to 01:00, but after that time the number of requests decreases until 6:00 (which has 50% of the average number of requests). After 6:00 the number of requests increases again until 12:00, inclusive. The afternoon period is very unstable and, after the lunch time break, it is also possible to see 4 more changes on the client’s behaviour, that is not very common on other works. After 21:00 it is possible to verify another increase in the number of requests that continues until the end of the day.
As expected most of the requests are to get the IP address of domains (types A or AAAA). Together they represent 97.986% of the whole dataset. Although IPv6 was made to replace IPv4 due to the anticipated address exhaustion of the latter protocol, it is curious to verify that the traffic originated by IPv4 is around 32 times bigger than the one created by its successor. PTR records, which transform an IP address into its correspondent domain name are also popular on a much smaller scale, with 1.542% of the requests, due to their use by VPN and SSH connections and anti-spam policies [15].
From a superficial analysis on the locations of the requests it is possible to verify that there are 340 different locations, from which 338 are Portuguese cities. The other two locations are Praia, on Green Cape, and ”N/A”, or un-known location. Almost 5% of the records have the value ”N/A” on the location field, which, if it was a city, would correspond to the third location with more
● ● ● ● ● ● ● −8% −4% 0% 4%
Monday Tuesday Wednesday Thursday Friday Saturday Sunday
Day Of The Week
Diff
erence From the Daily Mean Quer
y Frequency
Fig. 1. Difference between the number of requests per day of the week and the aver-age number of daily requests.
● ● ● ● ● ● ● ● ● ● ● ● ● ● ● ● ● ● ● ● ● ● ● ● −50% −25% 0% 25% 0 5 10 15 20 Hour Diff
erence From the Daily Mean Quer
y Frequency
Fig. 2. Difference between the number of requests per hour and the average number of hourly requests.
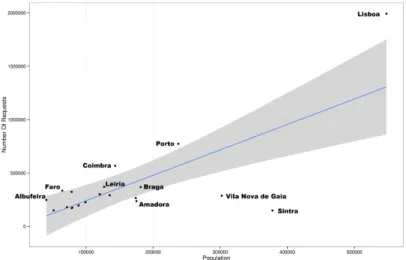
requests. The unavailability of the user’s locations may be caused by the use of proxies, which can hide the real location of the users. From the number of requests of each location its population (from CENSUS 2011 [16]) it is possible to create a correlation for the 20 location with more requests. Locations with more requests are more likely to have a higher population however, this relation is not linear. The correlation suggests that each inhabitant of a location has around 2.3 requests however, it is possible to see that there are cities like Sintra (0.40), Albufeira (6.07), Lisboa (3.64), Porto (2.26) or Vila Nova de Gaia (0.95) that are far from the correlation. These deviations of can be explained with the displacement of people from their residence to their workplace.
Fig. 3. Correlation Between Requests and Population of the 20 Cities With More Requests.
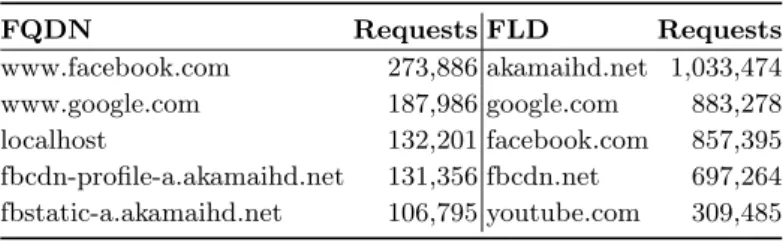
Table 2 contains some information about the distribution of requests per IP, FLD and FQDN. Although not all IPs have requests on every day of the data collection, the average number of requests is lower value than expected before the analysis, considering that the collection stage covers a period of one month. On the other hand there is an IP with 14,881, however 14,873 of those requests are to the same domain (localhost ) and were made during a 36-hour period, around 413 requests per hour. IPs with a number of requests of this magnitude can be flagged as possible bots, however it is not possible to be sure about that, once the log has no further information about the entity that created the request, unlike other works on Query Log Analysis [12]. In relation to the Fully Qualified Domain Names (FQDN), more than 70% of them is only queried once. On the other hand, there are domains like www.facebook.com and www.google.com with almost 275,000 and 190,000 requests, respectively, as it is possible to see in Table 3. The considerable amount of domains with only one request can be explained by four reasons: some of those requests are inadvertently mistyped, they result from brute force attempts to discover domains, they are made by applications and are very specific for the time and user, or also because they are only known to some people. On the left side of Table 3 it is possible to consult the 5 domains with more requests. The biggest surprise of this rank is the inclusion of the domain localhost, which refers to the client’s computer and has always the same address. When it comes to the FLD the amount of domains with only one request slightly decreases to 66.5%. On the right side of Table 3, it is possible to see the 5 FLD with more requests. Unlike the FQDN rank, the first place is hold by akamaihd.net, that is a content delivery network from Akamai1used by
companies like Twitter or Facebook to speed up their services.
Table 2. Quartiles, Number of Elements Average for the Requests Per FLD, FQDN and IP. FQDN FLD IP 0% 1 1 1 25% 1 1 3 50% 1 1 5 75% 2 2 8 100% 273,886 1,033,474 14,881 Number Of Elements 668,994 218,943 2,010,248 Average 19.98 61.04 6.65
The fact that a domain has a high number of requests does not imply that it is very popular among the community, since it may be required by a small group of clients. Considering this, a way to verify which are the most popular domains is to see the amount of different users, on this case IPs, who made requests for them. From this analysis it is possible to conclude that with the exception of the localhost domain, queries by only 769 different IPs, the other domains of the Table 3 are also the most popular.
1
Table 3. Top 5 requests for FQDN and FLD. FQDN Requests FLD Requests www.facebook.com 273,886 akamaihd.net 1,033,474 www.google.com 187,986 google.com 883,278 localhost 132,201 facebook.com 857,395 fbcdn-profile-a.akamaihd.net 131,356 fbcdn.net 697,264 fbstatic-a.akamaihd.net 106,795 youtube.com 309,485
The analysis made to the time between consecutive requests shown that 16% of the requests are made within one minute after the last one and in almost 25% of the time two consecutive requests occur in less than one hour. On the other hand, almost 15% of the users spend more than one week without using their Internet service.
4.2 Association Rules
From the different analysis scenarios it is possible to state that besides the support and confidence values, the levels of the analysis considered (FQDN, FLD and SLD) also affect the number of rules discovered. When less levels are considered the number of different elements is lower and more rules are discov-ered. However, the rules discovered are quite similar. It is common that rules of FLD or SLD are ”contained” on rules discovered on the FQDN dataset (i.e. google.com → youtube.com is contained in code.google.com → www.youtube.com).
From a first analysis to the whole set of discovered rules it is possible to draw some conclusions about their nature. The more popular a domain is, the higher is the number of rules on which it is present. This is particularly evi-dent for www.facebook.com and www.google.com. If a domain has the minimum support there is strong possibility of the rules X → www.f acebook.com and/or X → www.google.com exist. It is common that rules are composed by related domains: they are services provided from the same company, they have a com-mon termination or they have a similar subject.
On a deeper analysis of the results it is also possible to find some interesting rules. On the complete log, it is possible to find rules with very high confidence and support values very close from the minimum threshold (100 persons), which means that the involved domains are requested by a small group of people. Since some of these rules contain Chinese domains like www.tplink.com (a manufac-turer of network products), or domains that provide services over the Internet, like www.qq.com, www.sohu.com, www.baidu.com and www.163.com, it is possi-ble to conclude that these rules depict the behaviour of the Chinese community in Portugal.
Two interesting rules involve the domains of two governments. The first one is between APCER (www.apcer.pt ), a private Portuguese organization dedicated to the certification of management systems, services, products or people and the Portuguese Government (www.portugal.gov.pt ). The other rule is between
the government of the Isle of Man2 (www.gov.im) and Gamblers Anonymous
(www.gamblersanonymous.org). This is a very surprising rule in relation to the popularity of the Isle of Man government’s (it is the only foreign government that appears on the results) and in relation to the relation of domains with completely unrelated subjects.
Despite its low confidence, imap.sapo.pt → imap.google.com is another in-teresting rule. This means that some clients, despite having email addresses from Google and SAPO, use software that aggregates all of their accounts in a single place. Having rules composed by different language versions of the same Web page is also relatively common. This happens the most with SAPO but also with Wikipedia domains.
From the analysis made to the users with requests for Social Networks, Media and SAPO’s domains, it is possible to state that most of the discovered rules are related with the subject of the log, as expected. Despite of these results are from samples of the log, the nature of the results is similar to the ones obtained from the complete log.
From the analysis of the FLDs, from the users with requests for Social Net-works there are some rules worth of mention, since they are unexpected. Russian domains like mail.ru, odnoklassniki.ru, a Russian social network for classmates and old friends, and vk.me, also a social network created in Russia, called VKon-takte, are present in some rules. These domains are also popular among users who required domains related with SAPO.
4.3 Sequential Patterns
Since sequential patterns are seen as an evolution of association rules with the inclusion of the element of time, it is possible to say that the discovered sequen-tial patterns are a subset of the association rules from the same dataset, with similar support and confidence values. For this reason the global analysis made on the association rules on the previous Section, remains true for the discovered sequential patterns.
In relation to the results of the analysis, on each scenario it is possible to verify that most of the sequential patterns discovered are not interesting. Se-quences composed by a single domain repeated several times, automatic requests originated by applications, advertisement or plugins to discover metrics about Websites (like Google Analytics) are not analysed in detail.
For the users with requests for media domains, the results of the three levels of domain analysis (FQDN, FLD and SLD) are quite similar. Most of the se-quential patterns are composed uniquely by media domains, usually of the same group of companies, or have a common domain. Curiously, the patterns that are considered relevant for analysis have only two elements and only on a few there is not a direct link from the first domain, to the latter one. The first pattern that is worth to mention is {pesquisa.sapo.pt} → {www.rr.sapo.pt}, from SAPO’s
2 A self-governing British Crown Dependency, located between Ireland and Great
search engine to a radio station called Renascen¸ca, which has a support o 0.4% and a confidence of 70.5%. At first sight this may suggest that people who visit the latter domain of the sequence does not know the correct address. However, the rule does imply that the client went to the radio Website from the search engine. Some other pages may be visited between those. To verify if it is com-mon to go directly from the first element of the sequence to the next one, the same experiment was made with the additional restriction of only considering consecutive elements from the log to support the patterns and the pattern still exists, which reinforces the idea that people do not know the correct address of the radio. Another possibility is that SAPO’s search engine is the homepage of some users, and the Website of the radio station is the first one that is visited by them. Another interesting result, from the analysis on the complete domains, is the pattern {www.rr.sapo.pt} → {www.sicnoticias.sapo.pt}. Although this pattern has the highest support, it has the lowest value of confidence, 10.4%. This means that although being the pattern that reflects the behaviour of a higher number of clients, after visiting the first domain, only a small amount of them requires the second domain of the sequence.
In relation to the SAPO sample the results are similar for the analysis on the complete domains and on the SLDs. On the other hand, the analysis of the FLDs did not brought any interesting result. Likewise to the results of the analysis on clients with media requests, most of the elements of a se-quential pattern have a common domain. The domain kids.sapo.pt, whose tar-get audience are the youngsters, is present in two sequential patterns. While the first one, {jogos.sapo.pt} → {kids.sapo.pt} is not surprising since it sug-gests that the people more interested in games are the youngsters, the second, {kids.sapo.pt} → {www.leiloes.sapo.pt3}, is unexpected since it is not expected
that a kid has money or the required information to buy items on the Internet, and there is no link from one page to another. This sequence is also present when the the restriction of the consecutive domains is active.
5
Conclusions
Despite the collection of DNS queries by some entities, like ISPs, there is a little published work over this type of data analysis. This may happen because logs with other types of data have more information and, consequently, have potential to extract more detailed and complex information. Another potential reason for the lack of published work is the privacy of this type of the clients. For this study only a few features of the log were made available and the IP of the clients was encrypted to ensure the privacy of the users.
The potentialities of this type of log data are not limited to the presented work and it is possible to further investigate it and apply other techniques. The utilization of periods of time for the creation of sessions, the real time analysis and the detection of new trends are three interesting subjects that may be explored in future works.
3
References
1. Jaeyeon Jung, Emil Sit, Hari Balakrishnan, and Robert Morris. DNS
perfor-mance and the effectiveness of caching. IEEE/ACM Transactions on Networking, 10(5):589–603, 2002.
2. Jun Wu, Xiadong Li, Xin Wang, and Baopin Yan. DNS Usage Mining and Its Two Applications. In Sixth International Conference on Digital Information Manage-ment, number 2, pages 54–60, Melbourn, QLD, 2011.
3. Mark E Snyder, Ravi Sundaram, and Mayur Thakur. Preprocessing DNS log data for effective data mining. In Proceedings of the 2009 IEEE international conference on Communications, ICC’09, pages 1366–1370, Piscataway, NJ, USA, 2009. IEEE Press.
4. Anand Sharma. Web Usage Mining: Data Preprocessing, Pattern Discovery and Pattern Analysis on the RIT Web Data. PhD thesis, Rochester Institute of Tech-nology, 2008.
5. Rakesh Agrawal and Ramakrishnan Srikant. Fast Algorithms for Mining Associa-tion Rules in Large Databases. In Proceedings of the 20th InternaAssocia-tional Conference on Very Large Data Bases, VLDB ’94, pages 487–499, San Francisco, CA, USA, 1994. Morgan Kaufmann Publishers Inc.
6. Carlos Soares, Edgar de Graaf, Joost N. Kok, and Walter A. Kosters. Sequence mining on web access logs: A case study. In Belgian/Netherlands Artificial Intel-ligence Conference, Namur, 2006.
7. perl.org. The Perl Programming Language. Available at http://www.perl.org/, last access on June 16, 2013.
8. R Development Core Team. The R Project for Statistical Computing. Available at http://www.r-project.org/, last access on June 16, 2013.
9. Hadley Wickham and Winston Chang. ggplot2: An implementation of the
Grammar of Graphics. Available at http://cran.r-project.org/web/packages/ ggplot2/index.html, last access on June 13, 2013.
10. Christian Buchta, Michael Hahsler, and Daniel Diaz. arulesSequences: Mining
frequent sequences. Available at http://cran.r-project.org/web/packages/
arulesSequences/index.html, last access on June 13, 2013.
11. Robert Cooley, Bamshad Mobasher, and Jaideep Srivastava. Data preparation for mining World Wide Web browsing patterns. Knowledge and Information Systems, 1(1):5–32, 1999.
12. Rui Ribeiro. Characterization of Portuguese Web Searches. Master’s thesis, Fac-uldade de Engenharia da Universidade do Porto, Portugal, 2011.
13. Lauren Dugan. Facebook, Twitter, Google+, Pinterest: The Users Of Social
Media. Available at http://www.mediabistro.com/alltwitter/social-media-users\_b22556, last access on June 13, 2013.
14. Michael Hahsler, Christian Buchta, Bettina Gruen, and Kurt Hornik. arules:
Mining Association Rules and Frequent Itemsets. Available at http://cran.r-project.org/web/packages/arules/index.html, last access on June 13, 2013. 15. Jon Oberheide, Manish Karir, and Z Morley Mao. Characterizing Dark DNS
Be-havior. In Proceedings of the 4th international conference on Detection of Intru-sions and Malware, and Vulnerability Assessment, DIMVA ’07, pages 140–156, Berlin, Heidelberg, 2007. Springer-Verlag.
16. Instituto Nacional de Estat´ıstica. Censos 2011 - Resultados Definitivos. Available at http://www.ine.pt/scripts/flex\_definitivos/Main.htm, accessed on May 15, 2013.