Universidade de Lisboa
Faculdade de Ciências
Departamento de Biologia Animal
The role of inflammation in the coupling of
atherosclerosis and osteoporosis
Natacha Pombinho Leonardo
Orientado por:
Professora Doutora Maria Teresa Rebelo (FCUL)
Professora Doutora Maria José Santos (IMM)
Dissertação
Mestrado em Biologia Humana e Ambiente
i
“One, remember to look up at the stars and not down at your feet. Two, never give up
work. Work gives you meaning and purpose and life is empty without it. Three, if you
are lucky enough to find love, remember it is there and don't throw it away.”
ii
Agradecimentos
Gostaria de agradecer ao Professor João Eurico Fonseca e à Professora Helena Canhão por me aceitarem no seu laboratório para desenvolver o meu projeto e a todos no laboratório por me fazerem sentir bem-vinda e por tudo o que fui aprendendo com cada um.
À Professora Maria José Santos por ter aceite a orientação do meu projeto e por estar sempre presente e disposta a resolver qualquer questão e à Professora Maria Teresa Rebelo, também pela sua disponibilidade e dedicação.
Aos serviços de cirurgia vascular, de transplantação e de reumatologia do Hospital de Santa Maria pela disponibilidade e prontidão na recolha das amostras biológicas.
Um grande obrigado à minha companheira de laboratório, Renata Casimiro, sem a qual não teria sido possível fazer metade do projeto e também por tudo o que ao longo deste ano aprendemos uma com a outra. Que os nossos caminhos se voltem a cruzar e que consigamos conquistar o mundo inteiro, mas acima de tudo que sejamos felizes.
O mais importante de todos, um gigante obrigado à Diana Carmona-Fernandes por tudo o que me ensinou, por todo o apoio, por todos os desafios e estímulos, por nunca deixar de acreditar nas minhas capacidades e por me fazer crescer um pouco mais, tanto no mundo da ciência como a nível pessoal. Sem ti não teria conseguido chegar até aqui. Espero que isto não seja o fim e que muitos outros desafios nos surjam.
Aos meus pais por me apoiarem sempre ao longo deste percurso e nunca me deixarem desistir nos momentos de fraqueza e a todos os meus familiares e amigos que de uma forma ou de outra fizeram parte desta jornada.
E ao André Pelixo, por todo o apoio emocional, por toda a força nos momentos mais difíceis e exigentes, por estar presente em todas as insónias e em todas as lágrimas e por acreditar sempre quando eu própria já duvidava. Obrigada por fazeres parte desta etapa!
iii
Index
List of abbreviations ... 1 Abstract ... 3 Resumo ... 4 Introduction ... 7 Aims ... 14Materials and Methods ... 15
Cadaver donors ... 15
Patients... 15
Biologic samples collection and storage ... 16
Gene expression ... 16
RNA extraction ... 16
cDNA synthesis ... 17
Real time-quantitative polymerase chain reaction (RT-qPCR) ... 17
Cytokine quantification ... 18
Statistical analysis ... 18
Results ... 19
Cadaver donors ... 19
Population description ... 19
Relative gene expression in bone and aorta samples ... 19
Cytokines quantification ... 21
Relative gene expression vs cytokines quantification ... 22
Patients... 22
Population description ... 22
Relative gene expression in the atherosclerotic plaque ... 24
Relationship of relative gene expression in the atherosclerotic plaques and bone fragility factors... 25
Cytokines quantification ... 32
Relationship of inflammatory and bone remodelling markers in serum with bone fragility factors... 32
Relative gene expression vs cytokines quantification ... 36
Discussion ... 37
Conclusions ... 43
Bibliography ... 44
iv
Figures Index
Figure 1 – Correlation between RANKL relative gene expression in bone and aorta ... 20
Figure 2 - Correlation between CTSK relative gene expression in bone and aorta ... 20
Figure 3 - Correlation between CBFA-1 relative gene expression in bone and aorta ... 20
Figure 4 - Correlation between IL-1 relative gene expression in bone and aorta ... 21
Figure 5 - Correlation between IL-6 relative gene expression in bone and aorta ... 21
Figure 6 - Correlation between OCL relative gene expression in bone and P1NP serum quantification ... 22
Figure 7 - Correlation between CTSK relative gene expression in bone and CTX serum quantification ... 22
Figure 8 - Correlation between IL-6 relative gene expression and FRAX1 ... 25
Figure 9 - Correlation between IL-6 relative gene expression and FRAX2 ... 25
Figure 10 - Correlation between IL-17A relative gene expression and vitamin D ... 25
Figure 11 - Correlation between RANKL relative gene expression and total cholesterol ... 26
Figure 12 - Correlation between RANKL relative gene expression and LDL cholesterol ... 26
Figure 13 - Correlation between RANKL relative gene expression and calcium ... 26
Figure 14 - Correlation between RANKL relative gene expression and calcium intake ... 26
Figure 15 - Correlation between RANKL relative gene expression and CRP ... 27
Figure 16 - Correlation between RANKL relative gene expression and T-score ... 27
Figure 17 - Correlation between OPG relative gene expression and calcium ... 27
Figure 18 - Correlation between CBFA-1 relative gene expression and age ... 28
Figure 19 - Correlation between CBFA-1 relative gene expression and LDL cholesterol ... 28
Figure 20 - Correlation between CBFA-1 relative gene expression and CRP ... 28
Figure 21 - Correlation between CBFA-1 relative gene expression and calcium ... 28
Figure 22 - Correlation between CBFA-1 relative gene expression and BMD ... 29
Figure 23 - Correlation between CBFA-q relative gene expression and T-score ... 29
Figure 24 - Correlation between CBFA-1 relative gene expression and FRAX1 ... 29
Figure 25 - Correlation between CBFA.1 relative gene expression and FRAX2 ... 29
Figure 26 - Correlation between OCL relative gene expression and age ... 30
Figure 27 - Correlation between OCL relative gene expression and calcium ... 30
Figure 28 - Correlation between OCL relative gene expression and CRP ... 30
Figure 29 - Correlation between COL-1 relative gene expression and FRAX1 ... 31
Figure 30 - Correlation between COL-1 relative gene expression and FRAX2 ... 31
Figure 31 - Correlation between CTSK relative gene expression and age ... 31
Figure 32 - Correlation between CTSK relative gene expression and CRP ... 31
Figure 33 - Correlation between CRP and IL-6 serum quantification ... 32
Figure 34 - Correlation between vitamin D and IL-6 serum quantification ... 32
Figure 35 - Correlation between calcium and RANKL serum quantification ... 33
Figure 36 - Correlation between calcium and RANKL serum quantification, excluding samples below the limit of detection ... 33
Figure 37 - Correlation between vitamin D and RANKL serum quantification ... 33
Figure 38 - Correlation between vitamin D and RANKL serum quantification, excluding samples below the limit of detection ... 33
Figure 39 - Correlation between vitamin D and RANKL/OPG ratio serum quantification ... 34
Figure 40 - Correlation between vitamin D and RANKL/OPG ration serum quantification, excluding samples below the limit of detection ... 34
v
Figure 41 - Correlation between FRAX1 and RANKL/OPG ration serum quantification ... 34
Figure 42 - Correlation between FRAX1 and RANKL/OPG ration serum quantification, excluding samples below the limit of detection... 34
Figure 43 - Correlation between calcium intake and CTX serum quantification ... 35
Figure 44 - Correlation between calcium intake and P1NP serum quantification ... 35
Figure 45 - Correlation between vitamin D and P1NP serum quantification ... 35
Figure 46 - Correlation between CRP and P1NP serum quantification... 35
Figure 47 - Correlation between OPG relative gene expression and serum quantification ... 36 Figure 48 - Correlation between CTSK relative gene expression and CTX serum quantification 36
vi
Tables Index
Table 1 - Population description ... 19
Table 2 - Relative gene expression in bone and aorta ... 19
Table 3 - Cytokines quantification of cadaver donor’s serum ... 21
Table 4 - Population description ... 23
Table 5 –Relative gene expression in the atherosclerotic plaques ... 24
1
List of abbreviations
BMD - Bone Mineral Density BMI - Body Mass Index CBA - Cytometric Bead Array
CBFA-1 - Core-Binding Factor Alpha 1 cDNA - Complementary DNA
COL-1 - Collagen type 1 Ct - Cycle threshold CTSK - Cathepsin K
CTX - C-terminal Telopeptide of type 1 collagen CV - Cardiovascular
Dkk-1 - Dickkopf Wnt signalling pathway inhibitor 1
DXA - Dual X-ray Absorptiometry
ELISA - Enzyme-Linked Immunosorbent Assay
FRAX 1 - 10-year probability of major osteoporotic fracture FRAX 2 - 10-year probability of hip fracture
HSM - Hospital de Santa Maria
ICAM-1 - Intercellular Adhesion Molecule 1 IL- Interleukin
LDL - Low-Density Lipoprotein
MCSF - Macrophage Colony Stimulating Factor N - Normal NF-kB - Nuclear Factor-kappa B O - Obese OCL - Osteocalcin OP - Osteoporosis OPG - Osteoprotegerin OTP - Osteopenia
2
Ow - Overweight
P1NP - Procollagen type 1 N Propeptide RANKL - Receptor Activator of NF-kB Ligand rRNA18S - ribosomal RNA 18S
RT-qPCR - Real Time-quantitative Polymerase Chain Reaction SCORE - 10-year probability of CVD death
SD - Standard Deviation SMCs - Smooth Muscle Cells SOST - Sclerostin
TNF - Tumor Necrosis Factor
TRAP - Tartrate-Resistant Acid Phosphatase Uw - Underweight
3
Abstract
Atherosclerosis is an inflammatory disease characterized by plaque formation, progressive diminishing of the calibre of arteries and increased risk of cardiovascular events. Osteoporosis (OP) is a bone disorder characterized by decreased bone mineral density and microarchitecture deterioration that leads to increased fracture risk. These two diseases are responsible for a high mortality and morbidity and usually coexist in the same individual. The existence of inflammatory mechanisms underlying both pathologies, evidenced by the presence of pro-inflammatory cytokines (such as IL-1, IL-6 or TNF) both locally and at systemic level, corroborates the hypothesis of a linkage between the two diseases. Additionally, dysregulation of RANK/RANKL/OPG system, fundamental in osteoclastogenesis, can contribute to the increased risk of cardiovascular disease and simultaneously of OP.
With this project we intend to determine pathophysiological processes common to both diseases that co-substantiate their relationship. Thus, gene expression of pro-inflammatory and bone metabolism related proteins were analysed both in artery and bone samples from cadaver donors and posteriorly, the relation between gene expression and protein seric levels were explored in patients with evolved atherosclerosis.
Our results showed a relationship between gene expression in bone and aorta for both bone remodelling markers (RANKL, CTSK and CBFA-1) and inflammation markers (IL-1β and IL-6) in samples from cadaver donors. Further studies are needed to evaluate a larger number of samples and also to understand if these relations are specific of this tissues or if is extended to other tissues.
In samples from patients with atherosclerosis, we found serum calcium levels to be associated with the presence of bone metabolism markers in plaques (RANKL, OPG and CBFA-1) and IL-6. The relationship between serum vitamin D levels and IL-6, IL-17A, RANKL and P1NP highlights its possible role in the regulation of these cytokines. Also, there was a relation between the expression of bone remodelling markers in plaques and the bone mineral density (BMD) and femoral neck T-score and markers for osteogenic cells were influenced by age.
With our work we unveil a possible relation between the expression in bone and aorta of markers of bone remodelling and inflammation. In a context of evolved atherosclerosis, frequently associated with low BMD and consequent osteoporosis (although not always diagnosed), calcium and vitamin D influence inflammation and bone remodelling markers in the plaques and these bone remodelling markers determined in plaques are also associated with alterations in BMD.
4
Resumo
A aterosclerose é uma doença crónica inflamatória que afecta as paredes dos vasos onde ocorre a formação de placas de ateroma. Estas placas de ateroma são o resultado da acumulação de lípidos, células inflamatórias, resíduos celulares e cálcio e, consequentemente há um aumento do risco para a ocorrência de eventos cardiovasculares. A aterosclerose inicia-se com a disfunção das células endoteliais e expressão de VCAM-1 (Vascular Cell-Adhesion Molecule 1) ao qual se ligam monócitos e células T que migram para o tecido arterial, aumentando a produção de citocinas, factores de crescimento, acumulação de lípidos, proliferação de células do músculo liso e aumento da secreção de moléculas de adesão. Estes eventos todos reunidos levam à formação de células espumosas pró-inflamatórias e culmina na formação das placas de aterosclerose.
Os factores de risco para a ocorrência desta doença são vários, entre os quais destacam- -se o aumento da idade, o sexo masculino, hábitos tabágicos, problemas de hipertensão, dislipidémia, outras doenças como a diabetes mellitus e também alterações genéticas próprias de cada indivíduo.
O processo inflamatório está na base desta doença que é mediada por várias citocinas pró-inflamatórias, como a interleucina (IL-)1β, a IL-6, TNF (tumor necrosis factor) e a IL-17A, que vão desempenhar vários papéis no desenvolvimento da placa e também na deposição de cristais de cálcio na mesma. Todos estes factores levam a uma ossificação das placas, por processos ainda pouco esclarecidos e controversos: por um lado crê-se que esta ossificação possa ocorrer pela proliferação de células do tipo dos osteoblastos, por outro poderá ocorrer por um mecanismo semelhante à ossificação endocondral que ocorre na formação dos ossos, com expressão de um fenótipo semelhante ao dos condrócitos por parte das VSMCs (Vascular Smooth Muscle Cells).
A Osteoporose (OP), importante causa de morbilidade e mortalidade, deriva da perturbação óssea esquelética. Revela-se na diminuição da resistência óssea, elevando assim o risco de fractura.
Podemos encontrar dois tipos de osteoporose, a primária e a secundária. A primária é causada sobretudo pela perda de massa óssea derivada do aumento da idade e a secundária surge como consequência de outras patologias ou do uso de determinada medicação. A progressão e agravamento da doença dá-se não só derivado a fatores genéticos e hormonais, bem como a determinados estilos de vida ou doenças concomitantes.
O osso é um tecido em constante remodelação ao longo da vida. Quando sofre danos, como no caso das fracturas, estes são reparados preservando a homeostase de cálcio e fósforo. O processo resulta da acção coordenada entre as células responsáveis pela reabsorção óssea, os
5 osteoclastos e as células formadoras de osso, os osteoblastos, pelo que se torna essencial uma comunicação sincronizada entre os dois tipos de células. Para além da síntese e deposição proteica da matriz extracelular, os osteoblastos são também responsáveis pela síntese e secreção de moléculas que iniciam e controlam a diferenciação dos osteoclastos.
A diferenciação de precursores de osteoclastos em osteoclastos multinucleados ativados ocorre num processo denominado osteoclastogénese, que é regulado pelos osteoblastos e modulado por duas citocinas, o MCSF (Macrophage Colony Stimulating Factor) e o RANKL (Receptor Activator of NF-kB Ligand), membro da família TNF que se liga ao seu recetor RANK (Receptor Activator of NF-kB). Outra citocina importante neste sistema é a osteoprotegerina (OPG), uma glicoproteína solúvel que pertence à família do TNF.
Para que ocorra um correcto desenvolvimento do osso, o sistema RANK/RANKL/OPG tem de estar em homeostase. Contudo, apesar de caraterísticas do metabolismo ósseo estas moléculas foram já identificadas nos processos de desenvolvimento da aterosclerose.
A nossa hipótese é que existem mecanismos comuns adjacentes às duas doenças que levarão ao desenvolvimento simultâneo e frequente das duas patologias no mesmo indivíduo.
No sentido de dar resposta às nossas questões foi realizada a avaliação da expressão génica, no osso e na aorta de dadores cadáver, de moléculas inflamatórias ou envolvidas no metabolismo ósseo no sentido de perceber a possível relação entre estes dois tecidos, usando uma população representativa da heterogeneidade da população. As mesmas proteínas foram também doseadas no soro dos mesmos indivíduos com o intuito de compreender a existência de uma relação entre o que se passa ao nível dos tecidos com o que ocorre de forma sistémica. Como segundo objetivo deste trabalho pretendemos compreender a relação dos marcadores de inflamação e do metabolismo ósseo em placas de aterosclerose de doentes com aterosclerose avançada que foram submetidos a endarterectomia carotídea e tentar entender a relação com a densidade mineral óssea e outros dados clínicos dos mesmos indivíduos. Para além disso, também nestes doentes foram doseadas proteínas séricas, por ELISA (Enzyme-Linked Immunosorbent Assay), no sentido de perceber os efeitos sistémicos no organismo.
Os nossos resultados mostraram que existe alguma relação entre a expressão génica no osso e na aorta dos dadores cadáver para alguns marcadores do metabolismo ósseo, como o RANKL, a CTSK e o CBFA-1 e para os marcadores de inflamação IL-1β e IL-6. No entanto, estes resultados necessitam ser confirmados aumentando o número de amostras e deve ainda ser determinada a expressão génica destes mesmos marcadores noutro tecido, no sentido de confirmar se será específico destes dois tecidos ou se a mesma relação é encontrada também noutros tecidos independentes das patologias em estudo.
6 Quanto aos doentes com aterosclerose, os níveis de cálcio sérico parecem estar relacionados com a presença de marcadores do metabolismo ósseo nas placas (RANKL, OPG e CBFA-1) e também com a citocina inflamatória IL-6. Também a relação entre níveis séricos de vitamina D e citocinas inflamatórias como a IL-6 e a IL-17A, e remodeladoras do osso, como o RANKL e P1NP sugerem o seu papel na regulação destes mediadores.
Como era de esperar, a expressão de alguns dos marcadores de remodelação do osso revelou uma associação com a densidade mineral óssea e o T-score medido pelas densitometrias ósseas. Por fim, também os marcadores dos osteoblastos e osteoclastos apresentaram uma relação inversa com a idade, apoiado pelas mudanças que ocorrem nos percursores destas células com o avançar da idade.
Apesar de estatisticamente não termos obtido resultados muito robustos, com coeficientes de correlação baixos, encontrámos algumas pistas sobre a relação entre as duas doenças. Primeiro, porque conseguimos determinar expressão génica de moléculas específicas do osso, tanto nos vasos de dadores cadáveres, como nas placas de aterosclerose dos doentes. Segundo, porque muitos destes factores mostraram relação com os níveis séricos de cálcio e vitamina D, conhecidos por terem um forte papel no osso e cuja desregulação pode levar a uma diminuição da densidade mineral óssea. Por último, a expressão de factores importantes na remodelação óssea (RANKL) e de marcadores de osteoblastos (CBFA-1 e COL-1) nas placas de aterosclerose, associados a alterações da densidade mineral óssea e ao aumento do risco de futuras fraturas, indicam que estes mecanismos poderão ser muito importantes na compreensão da relação entre as duas doenças, a aterosclerose e a osteoporose.
7
Introduction
Atherosclerosis and osteoporosis are among the most prevalent diseases and frequently occur in the same individual.
The higher impact of atherosclerotic disease occurs in adults over 45 years old [1] and it emphases one of the top death causes in industrialized nations [2], having reached the first place in the world in the current year [3]. Atherosclerosis is a multifactorial disease dependent on environment, lifestyle, nutrition and other specific individual characteristics, more than just genetics and age. For example, in western societies it represents half of deaths in relation to myocardial infarction, cerebral ischemia, aortic aneurysms and stroke; in contrast, in the eastern ones this disease presents a lower rate [1].
Atherosclerosis is a chronic inflammatory disease that appears as a result of development of atheroma plaques and progressive stenosis of large and medium-sized arteries [3], [4], [5]. The establishment of these plaques is a consequence of accumulation of lipids, inflammatory cells, fibrous elements, cellular waste products and calcium [6] that are placed in arteries walls, initiating its thickening [1]. As a consequence, the risk for cardiovascular events, like ischemia of the heart, brain or extremities [7] increases, particularly in the presence of instability of the atherosclerotic plaque and subsequently infarction [8]. There are some agents that act like a key to perform this action, for instance the recruitment of circulating monocytes into the vascular intima and their differentiation into macrophages or foam cells [9]. The most affected arteries are the aorta, the coronary arteries and cerebral arteries, but all arteries can develop atherosclerotic plaques [1].
The increased connection of low-density lipoprotein (LDL) to endothelium and smooth muscle cells (SMCs) raises the transcription of the LDL-receptor gene, which is activated by pro-inflammatory cytokines like tumor necrosis factor (TNF) and interleukin (IL-) 1 [10]. Oxidative modification of LDL is believed to have an important role in atherogenesis. Even slightly changed LDL may induce the expression of adhesion molecules and cytokines by endothelial cells. Increased formation of oxidized LDL in the vascular intima might lead to monocyte recruitment [9]. The initial sign of atherosclerosis is endothelial cell dysfunction/activation in response to oxidized lipids in the subendothelium, and expression of vascular cell adhesion molecule 1 (VCAM-1). This will start both the adhesion leukocytes and migration of activated platelets into the endothelium. Monocytes and T cells bind to endothelial cells expressing VCAM-1 and migrate into the arterial tissue [11]. Consequently there is an increase in the production of cytokines and growth factors, lipid accumulation, SMCs proliferation [1] and up-regulation of adhesion molecules with subsequent infiltration and diapedesis of monocytes through the
8 arterial intima, leading to the formation of pro-inflammatory foam cells and atherosclerotic plaque [3]. In turn, recruited monocytes then differentiate into macrophages and enhanced the expression of many pattern-recognition receptors. These macrophages collect cholesterol trough scavenger receptors and convert into foam cells, leading to intimal fatty-streak lesions [11]. Recruitment, activation and differentiation of monocytes are induced by the initial vascular activation into macrophages and dendritic cells, which is quickly followed by an adaptive immune response on recruitment of T cells [12].
Several risk factors for atherosclerosis have been identified. In addition to high plasma concentrations of LDL, there are other causes, such as free radicals caused by cigarette smoking, hypertension, diabetes mellitus and genetic alterations that lead to endothelial dysfunction which is the initial step of the atherosclerotic process [5], [13]. This will cause the development of pores in inter-endothelial junctions and reveal signs of injury. Then, the injured or dysfunctional endothelium develops a surface that is conducive to inflammatory cells adhesion, rolling and migration to subendothelial region [10]. Even though LDL appears to be a significant factor, some patients may develop cardiovascular (CV) diseases without changes in lipid profile [1].
The key mechanism in atherosclerotic disease is inflammation [14], comprising a complex interaction with various types of cells and cytokines systems that relate CV risk factors with immune-inflammatory activation of the vascular wall [12]. Inflammation is present and affects the progression of the disease during all phases [2], from fatty streaks and plaque formation to an acute episode caused by plaque erosion/rupture and subsequent thrombosis [3], [10]. As an inflammatory disease, endothelial dysfunction and inflammatory lesions are mediated by a number of pro-inflammatory cytokines. There is evidence of an increase of IL-1β, IL-6 and TNF [4] that are associated with an intensification of vascular risk, as demonstrated by epidemiological studies [15].
Innate and adaptive immunity operates in the development of atherosclerosis since immune cells and their mediators lead to the chronic arterial inflammation and macrophages, T lymphocytes and mast cells are responsible to the latent inflammatory response in the vessel wall [11]. Pro-inflammatory cytokines present in atherosclerotic plaques are produced by monocytes and macrophages [16].
Among the cytokines released there is IL-17, more specifically IL-17A, which activate several downstream pathways, such as induction of adhesion molecules, like intercellular adhesion molecule 1 (ICAM-1) , and induction of nuclear factor-kappa B (NF-kB), which in turn induces the expression of other pro-inflammatory cytokines, namely IL-1β, IL-6 and TNF. However, some authors defend that IL-17 has also a protective effect by downregulating the expression of
9 endothelial VCAM-1 and that IL-17 may vary its implication in cardiovascular disease depending on the cell type that produce it and the environment where it acts, showing that IL-17 could have both pro- and anti-atherogenic roles [11], [12].
The pro-inflammatory cytokine IL-1β, produced by monocytes and macrophages, is responsible for activation and up-regulation of endothelial cells and leukocyte adhesion molecules, proliferation of VSMCs and secretion of other cytokines associated with the progression of atherosclerosis and, in some human studies, high expression of IL-1β was found in arteries with atherosclerotic lesions [3].
IL-6 is another essential cytokine in the progress of atherosclerotic lesions and its rupture, triggering inflammation and expansion of inflammatory response in atherosclerosis and other chronic systemic inflammatory diseases. It is secreted into the lesions by macrophages, endothelial cells, fibroblasts and adipose tissues. Its actions lead to endothelial dysfunction, VSMCs migration and transition of macrophages into foam cells [3].
TNF is also involved in the pathogenesis of systemic inflammatory diseases and there is evidence of involvement in atherogenesis and vascular inflammation. The main producers of this cytokine are macrophages, monocytes, endothelial cells, VSMCs and fibroblasts. It binds to its two receptors, TNF receptor I (TNFR1) and TNF receptor II (TNFR2) and this process induces the activation of NF-kB. Its role in atherosclerotic disease is mediated by an increase in the expression of vascular endothelial adhesion molecules, recruitment of macrophages and leaking of microvasculature. Moreover, it regulates nitric oxide synthesis and reactive oxygen species formation that cause endothelial dysfunction. In fact, some studies reveal that TNF administration leads to an increased expression of ICAM-1, VCAM-1 and E-selectin and production of reactive oxygen species [3].
As the plaque develops deposition of calcium will also occur. This can happen in two ways: some authors defend that the increase of inflammatory cytokines will provide a VSMCs reaction, which will migrate, proliferate and turn into osteoblasts-like cells and will cause instability and calcification of the atherosclerotic plaque [5]. Other authors believe that this mechanism is more like an endochondral bone formation due to chondrocyte-like phenotype expressed by VSMCs. This endochondral bone formation consists into an intermediate cartilage deposition, which is posteriorly invaded by osteoblasts and replaced by mineralized bone [17].
Osteoporosis (OP) is a skeletal bone disorder that occurs typical in older individuals and is more frequent in women. It is characterized by decrease in bone mineral density and microarchitectural deterioration of bone tissue that cause a reduction in bone strength and consequently increases the risk of bone fracture [18], [19], [20].
10 OP and consequent fractures are a serious public health problem and a significant cause of morbidity and mortality with a tendency to become worse due to the increase of life expectancy. Accordingly, in the European Union the annual incidence of femoral neck fractures will increase from 125,000 nowadays to 1 million in 2020. The risk of death can be amplified by 15% to 25% during the first year after a hip fracture and the majority of those who survive can turn into bedridden. This disease is more common in the North European countries but its prevalence increased in developing countries, like those of the Asia and Latin America continents [21]. Low bone mineral density (BMD) is a major risk factor for fractures.
BMD determination for OP diagnosis is possible by performing a dual x-ray absorptiometry (DXA). The result is evaluated in T-score values which is the number of standard deviations of the comparison between BMD measured and the BMD of a young population. According to the WHO, OP is diagnosed if Tscore < 2.5, ostepenia if Tscore ≥ 2.5 and ≤ -1.0, and normal if T-score > -1.0 [22].
There are two types of osteoporosis. Primary OP is mainly caused by age-related bone mass loss. On the other hand, secondary OP is a result from other diseases or medications. Changes in bone density due to aging are mainly caused by genetic and hormonal factors. However, there are also lifestyle factors influencing this disease, such as nutrition (calcium, vitamin D and alcohol consumption), low physical activities, coexisting diseases, smoking, illnesses (endocrine and metabolic disorders and other chronic inflammatory diseases with release of inflammatory cytokines), and some medications, which will affect bone metabolism [18]. An important clinical risk factor is hereditarily related, and previous studies shown that the alterations in BMD are 50% to 85% genetically determined [19]. Several studies shown a decrease in bone mass in patients with chronic articular inflammatory diseases like rheumatoid arthritis, systemic lupus erythematosus, ankylosing spondylitis, psoriatic arthritis and chronic juvenile arthritis [23].
The bone is an active tissue, which is self-remodelled during life course. This occurs to restore damages, adjust the skeleton and keep calcium and phosphorus homeostasis. This process appears in result of a coupled action of resorbing cells, osteoclasts, and bone-forming cells, osteoblasts. The procedure begins with the action of osteoclasts by destruction of old bone and then, osteoblasts takes action by synthesizing organic extracellular bone matrix, the osteoid, and coordinate its mineralization. The osteoid formed will be transformed into osteocytes as soon as osteoblasts fill the resorption lacunae formed by osteoclasts [21]. It is essential, in order to preserve bone homeostasis, a well synchronized communication between this two types of cells [18].
11 The key cells of bone formation, osteoblasts, are originated in mesenchymal progenitor cells from bone marrow. These same cells also produce condroblasts, fibroblasts, adipocytes and myocytes. Osteoblasts precursors differentiate into non-functional pre-osteoblastic cells and ultimately into mature osteoblasts capable of bone formation. Collagen type I, alkaline phosphatase and osteocalcin are specific phenotypic markers of osteoblasts expressed during its differentiation [21].
The type I collagen is the principal protein of bone, a heterotrimer comprising α1 and α2 protein chains encoded by the COL1A1 and COL1A2 genes. COL1A1 Sp1 polymorphism, according to previous studies, is considerably associated with osteoporotic fractures and the density of bones [19].
There are some requirements for the osteoblastic differentiation. One of the most important is the core binding factor alpha 1 (CBFA-1) which is a specific transcription factor. Osteoblasts encode two specific genes, CBFA-1 and osteocalcin, a primary transcription factor acting in osteogenesis. CBFA-1 is responsible for osteoblasts differentiation, regulation of osteoblasts bone formation and osteocalcin expression. According to previous studies, the absence of CBFA-1 is vital for this osteoblast differentiation and its overexpression cause a decrease in bone mass [24]. Only differentiated osteoblasts can express the osteocalcin gene [21]. Moreover, the expression of CBFA-1 in osteoblasts declines with age, although alterations in this transcription factor are conditions for age-related changes from osteoblastogenesis to adipogenesis, respectively transition from red to yellow bone marrow [18].
Besides synthesis and deposition of extracellular matrix proteins osteoblasts are also responsible for the synthesis and secretion of molecules responsible for initiate and control osteoclasts differentiation [21].
Osteoclasts are characterized by their particularly shape (jelly-fish-like) and motile cytoskeleton, and possess adhesion molecules that are capable to connect to bone, creating a sealing zone on the bone surface. This will result in a greatly enriched acidic microenvironment. A key cysteine proteinase specific of mature osteoclast, cathepsin K, degrades collagen and breaks down bone in the sealing zone, being a determinant of resorptive activity by osteoclasts. Bones of poor quality with micro-cracks accumulated are removed, occasioning a hole-like lacunae appearance. In these lacunae, osteoblasts deposit an extracellular matrix enriched with collagen type I and other non-collagenous proteins, such as osteocalcin, osteonectin and osteopontin. Vitamin D, calcium, and phosphate are conditions that assist in the mineralize process [25].
Differentiation of osteoclast precursors into activated multinucleated osteoclasts, called osteoclastogenesis, a transmembrane process [21] regulated by the osteoblasts and modulated
12 by two cytokines, the macrophage colony stimulating factor (MCSF) and the receptor activator of NF-kB ligand (RANKL) [21], a cytokine expressed by osteoblasts, bone-marrow stromal cells, and T and B lymphocytes [25]. RANKL is a member of the TNF family [25] that binds to its receptor, RANK, expressed on cell surface of osteoclasts precursors, monocytes and dendritic cells, but not found in vessels without inflammation [19], [21], [26]. RANK-RANKL bound induces numerous regulatory transcription factors and enzymes to promote the differentiation, proliferation, multinucleation, activation, and survival of osteoclasts causing an intense bone resorption [25] and osteoclast apoptosis is prevented. Human studies have shown that with aging, RANKL levels in the serum suffers a decrease corresponding to a simultaneous age-related decrease of expression in the T cells [18].
Another cytokine that plays an important role in this system is osteoprotegerin (OPG), a soluble glycoprotein belonging to the TNF family, produced by stromal cells and osteoblasts [26], expressed in normal VSMCs and downregulated in calcified VSMCs [27]. It acts as a decoy receptor for RANKL, inhibiting its interaction with its main receptor, RANK, preventing the osteoclastogenesis process [21], [28]. It exhibits a protective effect against calcification in cells by reducing alkaline phosphatase [27].
Therefore, in bone development, cytokines like RANK, RANKL and OPG, regulate the osteoclast activity and its differentiation, promoting or diminishing their ability to resorb bone [8], [26]. In the same way, the inflammatory process of atherogenesis also releases RANKL, proving a RANK-dependent activation of NF-kB in macrophages, as seen in bone [8]. As a matter of fact, through the interaction from RANK-RANKL, cytokines as IL-1β, IL-6 and TNF are released and an increase in bone resorption occurs [21]. As shown before, polymorphisms of these cytokines and their receptors have impact in humans bone mass [24].
Despite RANK/RANKL/OPG system and the Wnt pathway being characteristic of bone metabolism, they have been identified in the development of atherosclerosis and could be a contributing pathway in regulation of vascular calcification [29]. There are evidences linking CV diseases, resulting from atherosclerosis, with low bone mass characteristics of patients with OP. These two diseases are responsible for high rates of morbidity and mortality and share common risk factors [6] as well as molecular and pathophysiological mechanisms [8], [17].
Previous studies shown that increased OPG serum levels and its expression are associated with carotid atherosclerosis, myocardial infarction and with low BMD in postmenopausal women [30], [31]. OPG serum levels are also related to atherosclerotic plaque growth, vascular calcification, increased risk of CV disease, peripheral arterial disease and CV mortality [32], [33], [34], [35].
13 Several studies evidenced an association between osteoporosis and atherosclerosis. Although these two diseases share common risk factors and possibly also common genetic bases, there are probably common underlying mechanisms not yet fully understood, and multiple pathways may stay behind this association.
Our hypothesis is that there are common pathophysiological mechanisms between both diseases that might justify the appearance of one disease in the presence of the other.
14
Aims
The first aim of this project is to understand how alterations observed in arteries are related with alterations in bone in the general population, using cadaver donors as representative group of the heterogeneity of the population. To achieve this objective we will:
Compare the gene expression pattern of pro-inflammatory cytokines and bone remodelling markers between bone and vessel;
Evaluate the relation of age and gender in gene expression and serum quantification of these proteins;
Compare gene expression pattern, both in bone and vessel, with bone remodelling and pro-inflammatory markers in serum.
The second objective is to understand how gene expression patterns of pro-inflammatory cytokines and bone turnover biomarkers in atherosclerotic lesion and the corresponding serum levels of these proteins are related to bone mineral density in patients with advanced atherosclerosis. For this we will:
Determine if there are bone remodelling markers expression in atherosclerotic plaques;
Ascertain the relationship between inflammation markers expression in atherosclerotic plaques and bone fragility factors;
Ascertain the relationship between bone remodelling markers expression in atherosclerotic plaques and bone fragility factors;
Verify the relation of inflammation and bone remodelling markers in serum and bone fragility factors;
Compare gene expression pattern of bone remodelling and inflammatory markers in atherosclerotic plaques with bone remodelling and inflammatory markers in serum.
15
Materials and Methods
Cadaver donors
From 35 cadaver donors, at the time of organs collection for transplantation from the Transplantation Department of Hospital de Santa Maria (HSM), a sample of bone from iliac crest and a section of the abdominal aorta artery were collected. A blood sample was also collected from all the donors.
The donors were of both genders with ages raging between 15 and 80 years old. No additional information was available.
Patients
Samples were collected from patients with advanced atherosclerosis submitted to carotid endarterectomy surgery at the Vascular Surgery Department of HSM. At the time of the surgery a fasting blood sample from all patients was also collected for serum biomarkers measurement. A structured protocol was applied to all patients for recording demographic data, CV risk factors, history of previous factures, personal and family history of OP and related diseases, life style and nutritional habits, and past and current medication.
From 183 who signed an appropriated informed consent, 136 performed a dual X-ray absorptiometry (DXA), a non-invasive method to determine BMD for OP diagnosis. BMD is expressed in g/cm2 and is compared with BMD of a young population by determining the number of standard deviations (T-score). According to the WHO [22], OP is diagnosed if T-score <-2.5, ostepenia if T-score ≥ -2.5 and ≤ -1.0, and normal if T-score > -1.0.
The 10-year probability of major osteoporotic fracture (FRAX 1) and the 10-year probability of hip fracture (FRAX 2) were calculated using the FRAX® tool validated for the Portuguese population and the 10-year probability of CV disease death (SCORE) was calculated using the HeartScore® tool adapted for low risk countries.
Calcium intake was calculated according to Cosman F. et al. [36], based on food frequency questionnaire by calculating consumption of milk, yogurt and cheese in mg/day.
This study was approved by Ethics Committees of HSM and written informed consents were signed prior to any protocol-specific procedure and all proceedings were conducted in accordance with the regulations governing clinical trials such as the Declaration of Helsinki, as amended in Fortaleza, Brazil (2013)[37].
16
Biologic samples collection and storage
After samples collection, one section of the whole sample was fragmented in smaller pieces and immediately frozen in liquid nitrogen (snap-frozen) and stored at -80○C until further use for
RNA extraction. The remaining sample was processed for other studies.
All samples (atherosclerotic plaques, bones and aortas) were processed by the same method.
Blood samples (from patients and cadaver donors) were collected in S-Monovette®, Serum Gel with Clotting tubes (Sarstedt), for serum analysis, and S-Monovette®, Haematology with K3 EDTA tubes (Sarstedt) for blood analysis.
Gene expression
RNA extraction and complementary DNA (cDNA) synthesis protocols, were the same for the three types of samples (bone and aorta from cadaver donors and atherosclerotic plaques from patients with advanced atherosclerosis).
RNA extraction
Samples were reduced into a fine powder with a pestle and mortar and using liquid nitrogen to avoid samples to thaw.
RNA was extracted with TRIzol® (Invitrogen™). Briefly, after tissues disruption and cell components dissolved with TRIzol®, samples were incubated with chloroform (VWR®) and centrifuged allowing the formation of three different layers. The upper layer is the one that contains the RNA and it’s recovered to proceed with proteinase K digestion. After digestion, RNA was precipitated with cold isopropanol (VWR®). Supernatant were dispensed and the pellet washed with ethanol 75% (VWR) three times. RNA was resuspended in RNase/DNase free water (Gibco®).
After extraction the RNA was cleaned up to remove excess of enzymes, buffers and chemical inhibitors with the commercial kit, RNA Clean & Concentrator™-5 (Zymo Research), according to the manufacturer’s instructions.
RNA quantification and quality was assessed using NanoDrop® 1000 Spectrophotometer (Thermo Scientific™) by absorbance measure and then RNA was stored at -80ºC until further use.
17
cDNA synthesis
Complementary DNA was synthesized at a final concentration of 3ng/µlwith the DyNamo™ cDNA synthesis kit (Thermo Scientific™), according to the manufacturer’s instructions. This kit includes a reverse transcriptase M-MuLV RNase H+, an enzyme with RNase H activity that
degrades RNA in RNA-cDNA hybrids, and random hexamers for de reverse transcriptase step. cDNA synthesis was performed in a thermocycler, Piko™ Thermal Cycle (Thermo Scientific™), at 37○C for 30 minutes followed by the termination reaction at 85○C for 5 minutes
for inactivation of the reverse transcriptase M-MuLV RNase H+. cDNA was stored at -20○C.
Real time-quantitative polymerase chain reaction (RT-qPCR)
The expression of a panel of genes involved in the inflammatory process and genes of bone metabolism were analyzed in bones and aortas from cadaver donors and in the atherosclerotic plaques of patients with advanced atherosclerosis.
Gene expression analysis was performed for each sample, for IL-1β, IL-6, IL-17A and TNF - pro-inflammatory cytokines -, RANKL and OPG - cytokines involved in bone turnover process -, osteocalcin (OCL) and collagen type I (COL-1) - proteins produced by mature osteoblasts -, cathepsin K (CTSK) - produced by mature osteoclasts -, core-binding factor alpha 1 (CBFA-1) - a protein specific of pre-osteoblasts – and tartrate-resistant acid phosphatase (TRAP) - specific of pre-osteoclasts. It was also performed RT-qPCR for the housekeeping gene ribosomal RNA 18S (rRNA18S) for normalization of values.
The gene expression was performed with the DyNAmo™ Flash SYBR Green qPCR kit (Thermo Scientific™), according to the manufacturer’s instructions.
All RT-qPCR reactions were performed in duplicate to a 20µl final reaction volume with 3ng of cDNA. The reactions start with an initial denaturation at 95○C for 7 minutes, to activate
hot-start DNA polymerase, followed by 50 cycles of denaturation at 95○C for 10 seconds and
annealing and extension at 60○C for 45 seconds.
RT-qPCR was performed in the Rotor Gene 6000 (Corbett Research) for cadaver donor samples and in the 7500 Fast Real-Time PCR System (Applied Biosystems®) for advanced atherosclerosis patients samples.
To analyze the results, a standard curve was performed for each pair of primers. The standard curves were performed using a pool of bone samples from subjects with about 40 years old and without a diagnostic of chronic pathologies. The threshold was defined for each standard curve and used to determine the cycle threshold (Ct) for each sample. Efficiency of 100% means that for each cycle there is the double of the product, and it is acceptable a range between 90
18 and 110%, which correspond to a slope of -3.58 and -3.10). Ct is the time at which fluorescence intensity is greater than the background fluorescence, and for analyzing data the Ct value used is the intersection between the amplification curve and the threshold line defined in the standard curve, giving information about the absolute concentration of the gene [38] Standard curves also gives information about the slope and Y intersection allowing to determine the relative expression through the equation 10(Ct – Y intersection)/slope [39].
All data were normalized with the housekeeping gene rRNA 18S. Primer sequences used can be found in Annex I.
Cytokine quantification
ELISA (Enzyme-Linked Immunosorbent Assay) is a biochemical method based on antibodies and an enzyme-mediated color change to determine the presence of specific antigens [40].
RANKL and OPG seric levels were determined using Biomedica ELISA assay (Cat. No. BI-20462 and BI-20403, respectively), and CTX (C-terminal telopeptide of type 1 collagen) and P1NP (procollagen type 1 N propeptide) with SunRed Biological Technology (Cat. No. 201-12-1350 and 201-12-2130, respectively). Data were acquired in the microplate reader Infinite® M200 (Tecan). CBA (Cytometric Bead Assay) is an ELISA-based method in which the antibodies are coated in microbeads and allows the detection of multiple analytes from a single sample and data is acquired by flow cytometry [41].
CBA determination was performed for pro-inflammatory cytokines, IL-1β, IL-6, IL-17A and TNF and data were collected in the Accuri™ C6 flow cytometer from BD Biosciences.
Statistical analysis
Statistical analysis was performed using IBM SPSS version 20.
Quantitative variables are described as means and standard deviation and qualitative variables as percentages and absolute frequencies.
Statistical significance was considered for a two-tailed p-value < 0.05 and the confidence interval for all statistical analysis was 95%.
The normality of the distribution for continuous variables was evaluated using Kolmogorov-Smirnov test. For non-normal variables were used non-parametric tests (Spearman's test) and for normal variables parametric tests (Pearson's test). Comparisons between groups were performed using Student's T test, Mann-Whitney test or Kruskal-Wallis, as appropriated.
19
Results
Cadaver donors
Population description
We have included in the study 35 cadaver donors of both genders, 48.6% (17) males and 51.4% (18) females. The average age was 54.4 ± 16.3 years old with ages raging between 15 and 80 years (table 1).
Table 1 - Population description
Age is presented as mean ± SD and genders as percentage (absolute numbers).
Relative gene expression in bone and aorta samples
The relative gene expression (normalized to the housekeeping gene 18S rRNA) was evaluated in bone and aorta samples of organ donors for a panel of genes related to inflammation and bone remodeling (table 2).
Table 2 - Relative gene expression in bone and aorta
Genes Bone Aorta
RANKL 1,46E-02 ± 6,18E-03 3,95E-02 ± 1,39E-01 OPG 9,70E-04 ± 4,89E-04 2,20E-03 ± 2,20E-03 RANKL/OPG 1,58E+01 ± 5,03E+00 8,86E+00 ± 3,54E+00 COL1 2,89E-05 ± 1,48E-04 2,71E-05 ± 5,68E-05 CSTK 4,11E-03 ± 7,42E-03 2,47E-02 ± 4,17E-02 OCL 1,47E-04 ± 8,36E-04 1,20E-03 ± 2,50E-03 TRAP 4,30E-04 ± 1,31E-03 1,76E-04 ± 5,95E-04 CBFA-1 1,35E-03 ± 6,72E-04 3,81E-03 ± 1,86E-03 IL-1 5,05E-05 ± 5,62E-05 5,02E-04 ± 1,15E-03 IL-6 2,39E-03 ± 1,53E-03 5,53E-03 ± 4,12E-03
Results
Total N
Age (years)
54.4 ± 16.3 35Gender
Male
Female
48.6% (17) 51.4% (18) 3520 TNF 1,32E-03 ± 2,74E-03 5,48E-03 ± 9,05E-03
Relative gene expression is presented as means ± SD.; RANKL - Receptor Activator of NF-kB Ligand; OPG – Osteoprotegerin; COL-1 – Collagen type I; CTSK – Cathepsin K; OCL – Osteocalcin; TRAP – Acid
phosphatase tartrate resistant; CBFA-1 - Core-Binding Factor Alpha I; IL – Interleukin.
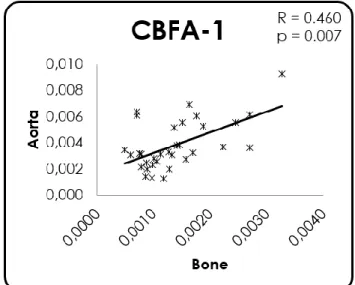
We have found that the relative gene expression between bone and aorta have a significant correlation for RANKL (figure 1; p=0.014, r=0.425), CSTK (figure 2; p=0.026, r=0.388), CBFA-1 (figure 3; p=0.007, r=0.460), IL-1 (figure 4; p<0.001, r=0.615) and IL-6 (figure 5; p<0.001, r=0.582).
Figure 2 - Correlation between CTSK relative gene
expression in bone and aorta
Figure 2 – Correlation between RANKL relative gene
expression in bone and aorta
Figure 3 - Correlation between CBFA-1 relative gene
21 No relations were found with age or differences between genders both in bone and aorta relative gene expression.
Cytokines quantification
Cytokines quantification were performed in cadaver donor’s serum. The results are shown in table 3.
Table 3 - Cytokines quantification of cadaver donor’s serum
Cytokine Concentration Total N OPG (pg/mL) 293.7 ± 139.9 32
CTX (ng/mL) 40.5 ± 26.8 35
P1NP (ng/mL) 145.5 ± 80 35
CTX/P1NP (ng/mL) 0.273 ± 0.067 35 IL-6 (fg/mL) 543026 ± 585794.7 35
Cytokine quantification is presented as means ± SD. OPG – Osteoprotegerin; CTX - C-terminal Telopeptide of type 1 collagen; P1NP - Procollagen type 1 N Propeptide; IL – Interleukin
Cytokine quantification was also performed for other cytokines however the concentration of the majority of samples was below of limits of detection and it was not possible to quantify. For RANKL just 7 samples (20%) were able to quantify, for IL-1β 13 samples (37.14%), IL-17A 6 samples (17.14%) and TNF-α 5 samples (14.29%).
No relations were found between age or gender and any of the protein levels determined in serum.
Figure 5 - Correlation between IL-6 relative gene
expression in bone and aorta
Figure 4 - Correlation between IL-1 relative gene
22
Relative gene expression vs cytokines quantification
We have evaluated the relation between the determined relative gene expression and the serum protein levels. Below are presented the results for the statistically significant correlations that were found (figures 6 and 7).
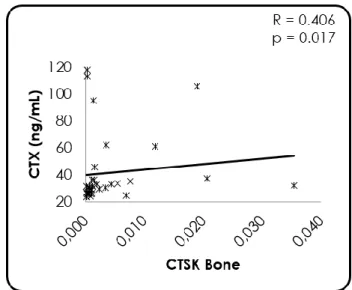
A significant relation was found between OCL relative gene expression in bone and serum levels of P1NP (figure 6; p=0.044, r=0.353), and between CTSK relative gene expression in bone and CTX serum levels (figure 7; p=0.017, r=0.406).
No other relations were found between gene expression in either bone or aorta and cytokines quantification in serum.
Patients
Population description
A total of 183 patients were included in this study. Demographic and clinical characteristics are shown in table 4.
Figure 5 - Correlation between OCL relative gene
expression in bone and P1NP serum quantification
Figure 5 - Correlation between CTSK relative gene
23
Table 4 - Population description
Results Total N Age (years) 70.5 ± 8.7 183 Gender Male Female 66.7% (122) 33.3% (61) 183 Arterial hypertension 86.9% (159) 183 Stroke 58% (105) 181 Total cholesterol (mg/dL) 147.8 ± 42.1 178 HDL cholesterol (mg/dL) 37.3 ± 13.3 177 LDL cholesterol (mg/dL) 90.0 ± 31.5 174 Triglycerides (mg/dL) 102.8 ± 85.5 177 Fasting blood glucose (mg/dL) 124.6 ± 50.9 175
CRP (mg/dL) 1.1 2.8 180 Creatinine (mg/dL) 1.2 1.0 182 Urea (mg/dL) 44.7 ± 19.6 181 Uric acid (mg/dL) 5.7 ± 4.6 179 Homocystein (μmol/L) 15.5 ± 5.0 175 Calcium (mg/dL) 8.7 ± 0.9 176 Calcium intake/day (mg) 915.4 ± 522.0 183 Vitamin D (ng/mL) 16.9 ± 7.5 172 Smoking Current smokers Ex-smokers 13.3% (24) 43.2% (78) 181 Alcohol > 3un/day 27% (48) 178 BMI (Kg/m2) Underweight Normal Overweight Obese 1.7% (3) 32% (57) 43.3% (77) 23% (41) 178 Fragility fractures 10.4% (19) 183 Falls last 3 months 11.7% (21) 179 Falls last 6 months 7.3% (13) 178 Falls last 12 months 9.0% (16) 178
Dyslipidemia 83.6% (148) 177
Diabetes Mellitus II 28.7% (52) 181 BMD femoral neck (g/cm2) 0.9 ± 0.2 136
Z-score femoral neck (g/cm2) 0.0 ± 1.2 136
T-score femoral neck (g/cm2) -1.4 ± 1.2 136
FRAX 1 (%) 7.2 ± 7.8 178
FRAX 2 (%) 3.6 ± 6.6 178
SCORE (%) 3.2 ± 1.7 183
Quantitative variables are presented as means ± SD and qualitative variables as percentage (absolute numbers). HDL – High-Density Lipoprotein; LDL – Low-Density Lipoprotein; CRP – C-Reactive Protein;
BMI – Body Mass Index; BMD – Bone Mineral Density; FRAX 1 – 10-year probability of a major osteoporotic fracture; FRAX 2 – 10-year probability of hip fracture; SCORE – 10-year probability of CVD
24 The population was composed by 67.7% (122) males and 33.3% (61) females with a total average age of 70.5 ± 8.7 years old. Examining patient’s blood samples, the fasting blood glucose had an average of 124.6 ± 50.9 mg/dL, higher than reference values (70 - 110 mg/dL). In the same way, CRP and creatinine presented averages of 1.1 ± 2.8 mg/dL and 1.2 ± 1.0 mg/dL and both are above reference values (< 0.5 mg/dL and 0.5 - 1.1 mg/dL, respectively). Homocystein, with an average of 15.5 ± 5.0 mg/dL, is also out of reference values (3.7 - 13.9 μmol/dL), while vitamin D revealed to be 16.9 ± 7.5 ng/mL, a value considered insufficient, comparing with the recommended values (30 - 80 ng/mL). A mean of 915.4 ± 522.0 mg/day of calcium intake was determined, according to Cosman et al. [36]. In respect to smoking habits, 13.3% (24) and 43.1% (78) of the patients were active smokers or ex-smokers, respectively. According to WHO body mass index (BMI) classification [42] the majority of patients (43.3% (77)) were overweight (Ow), 23% (41) were obese (O), 32% (57) had normal (N) BMI, and 1.7% (3) were underweight (Uw). The average femoral neck BMD, as assessed by DXA, was 0.9 ± 0.2 g/cm2 and the Z-score and
T-score averages were 0.0 ± 1.2 g/cm2 and -1.4 ± 1.2 g/cm2, respectively. According to WHO [22]
BMD classification, 57.4% (78) of patients had osteopenia (OTP) and 15.4% (21) had already established osteoporosis (OP).
Relative gene expression in the atherosclerotic plaque
The relative gene expression (normalized to the housekeeping gene 18S rRNA) was evaluated in atherosclerotic plaques for a panel of genes related to inflammation and bone remodeling (table 5), and the results compared to the variables obtained from the protocol applied to collect the clinical information.
Table 5 –Relative gene expression in the atherosclerotic plaques
Genes
Relative gene expression Total N
IL-6
0.673 ± 0.429 174IL-17A
2.094 ± 2.525 164RANKL
1.323 ± 1.116 181OPG
2.907 ± 3.054 173RANKL/OPG
0.642 ± 0.526 173CBFA-1
0.950 ± 0.914 167OCL
1.436 ± 1.631 149COL-1
0.924 ± 0.730 180TRAP
14.150 ± 61.945 148CTSK
0.855 ± 0.660 181Relative gene expression is presented as means ± SD. IL – Interleukin; RANKL - Receptor Activator of NF-kB Ligand; OPG – Osteoprotegerin; CBFA-1 - Core-Binding Factor Alpha I; OCL – Osteocalcin; COL-1 –
25 We were not able to obtain the relative gene expression values for the genes IL-1β and TNF.
Relationship of relative gene expression in the atherosclerotic plaques and bone fragility
factors
Below are presented the statistically significant correlations between the relative gene expression, both for inflammatory and bone remodelling markers, and clinical and laboratorial parameters available (figures 8 to 32).
Figure 7 - Correlation between IL-6 relative gene
expression and FRAX2
Figure 7 - Correlation between IL-6 relative gene
expression and FRAX1
Figure 8 - Correlation between IL-17A relative gene
26 Figure 9 - Correlation between RANKL relative gene
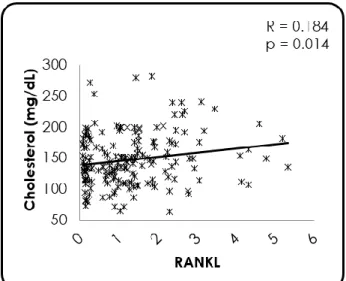
expression and total cholesterol
Figure 12 - Correlation between RANKL relative gene
expression and LDL cholesterol
Figure 11 - Correlation between RANKL relative gene
expression and serum calcium
Figure 11 - Correlation between RANKL relative gene
27 Figure 13 - Correlation between RANKL relative gene
expression and T-score
Figure 13 - Correlation between RANKL relative gene
expression and CRP
Figure 14 - Correlation between OPG relative gene
28 Figure 16 - Correlation between CBFA-1 relative gene
expression and age
Figure 16 - Correlation between CBFA-1 relative gene
expression and LDL cholesterol
Figure 20 - Correlation between CBFA-1 relative gene
expression and CRP
Figure 21 - Correlation between CBFA-1 relative gene
29 Figure 17 - Correlation between CBFA-q relative gene
expression and T-score
Figure 18 - Correlation between CBFA-1 relative gene
expression and BMD
Figure 24 - Correlation between CBFA.1 relative gene
expression and FRAX1
Figure 19 - Correlation between CBFA-1 relative gene
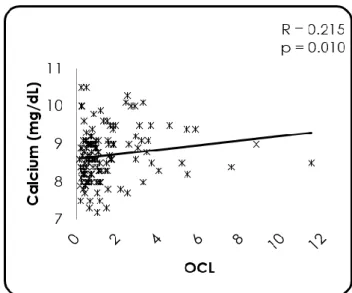
30 Figure 22 - Correlation between OCL relative gene
expression and CRP
Figure 21 - Correlation between OCL relative gene
expression and age
Figure 21 - Correlation between OCL relative gene
31 Figure 24 - Correlation between COL-1 relative gene
expression and FRAX1
Figure 24 - Correlation between COL-1 relative gene
expression and FRAX2
Figure 26 - Correlation between CTSK relative gene
expression and age
Figure 26 - Correlation between CTSK relative gene
32
Cytokines quantification
Cytokines quantification was only performed for those patients who had performed DXA for bone mineral density evaluation (table 6), and the results compared to the variables obtained from the protocol applied to collect the clinical information.
Table 6 - Cytokines quantification of patient’s serum
Cytokines Concentration Total N IL-6 (fg/mL) 2660.588 ± 3032.941 133 RANKL (pg/mL) 1.228 ± 1.374 67 OPG (pg/mL) 181.940 ± 152.377 133 RANKL/OPG (pg/mL) 0.109 ± 0.285 66 CTX (ng/mL) 34.102 ± 18.296 128 P1NP (ng/mL) 152.937 ± 128 128 CTX/P1NP (ng/mL) 1.303 ± 3.725 126
Cytokine quantification is presented as means ± SD. IL – Interleukin; RANKL - Receptor Activator of NF-kB Ligand; OPG – Osteoprotegerin; CTX - C-terminal Telopeptide of type 1 collagen; P1NP - Procollagen type
1 N Propeptide.
Cytokine quantification was also performed for other cytokines however the concentration of the majority of samples was below the limit of detection and it was not possible to quantify. For IL-1β we were only able to quantify 33 samples (24.6%), for IL-17A 34 samples (25.4%), and for TNF 15 samples (11.2%).
Relationship of inflammatory and bone remodelling markers in serum with bone fragility
factors
Below are presented the statistically significant correlations between the quantified cytokines and clinical and laboratorial parameters available (figures 33 to 46).
Figure 28 - Correlation between CRP and IL-6 serum
quantification
Figure 28 - Correlation between vitamin D and IL-6
33 Figure 30 - Correlation between calcium and RANKL
serum quantification, excluding samples below the limit of detection
Figure 30 - Correlation between calcium and RANKL
serum quantification
Figure 32 - Correlation between vitamin D and RANKL
serum quantification
Figure 32 - Correlation between vitamin D and RANKL
serum quantification, excluding samples below the limit of detection
34 Figure 34 - Correlation between vitamin D and
RANKL/OPG ration serum quantification, excluding samples below the limit of detection
Figure 34 - Correlation between vitamin D and
RANKL/OPG ratio serum quantification
Figure 351 - Correlation between FRAX1 and RANKL/OPG
ratio serum quantification
Figure 42 - Correlation between FRAX1 and RANKL/OPG
ration serum quantification, excluding samples below the limit of detection
35 Figure 37 - Correlation between calcium intake and CTX
serum quantification
Figure 37 - Correlation between calcium intake and P1NP
serum quantification
Figure 395 - Correlation between vitamin D and P1NP
serum quantification
Figure 396 - Correlation between CRP and P1NP serum
36
Relative gene expression vs cytokines quantification
Below are presented the results for the statistically significant correlations that were found between relative gene expression and equivalent protein serum quantification (figures 47 and 48).
There was positive relation between OPG expression and its serum levels (figure 47; p=0.005, r=0.249) and between CTSK expression and CTX serum levels (figure 48; p=0.017, r=0.211).
No other associations were found between gene expression in the plaque and serum levels of bone remodelling markers.
No associations were found between gene expression in the plaque and serum levels of inflammatory markers.
Figure 417 - Correlation between OPG relative gene
expression and serum quantification
Figure 418 - Correlation between CTSK relative gene
37
Discussion
In this work, we intended to unveil possible common pathophysiological mechanisms between OP and atherosclerosis by studying the alterations in bone and vessels and understand the genetics that could be linking these two diseases.
In order to try to understand the relation between vessels and bones, we have evaluated the relative gene expression and the serum levels of a panel of proteins related to inflammation and bone remodelling processes in a population constituted by 35 cadaver organ donors.
We have found no association between the relative gene expression neither the serum quantification of all the proteins tested and age or gender.
The relative gene expression in bone and aorta correlated significantly for the inflammatory cytokines IL-1 (figure 4; p<0.001, r=0.615) and IL-6 (figure 5; p<0.001, r=0.582), for the bone remodelling cytokine RANKL (figure 1; p=0.014, r=0.425), and for the osteoblasts and osteoclasts markers CBFA-1 (figure 3; p=0.007, r=0.460) and CTSK (figure 2; p=0.026, r=0.388), respectively.
The relations found for the relative gene expression between the tissues studied, bone and aorta, for the inflammatory cytokines IL-1 and IL-6, and the bone related proteins RANKL, CBFA-1 and CTSK, highlight that there might exist a subjacent relation between these tissues. However, we have only analysed these two specific tissues, as they are the most affected in the diseases that are object of this study. This is one of the limitations of this work. In order to evaluate if the relations found are specific of these tissues or if there is a systemic relation of these proteins in the whole body, we would have to evaluate the relative gene expression of these proteins in other tissues.
Cytokines quantification might give us some clues in order to verify if this relation affects systemically the organisms or if it is limited to bone and aorta.
With this in mind, we have further quantified the levels of several proteins in the serum of these individuals, in order to understand the extension of these relations. However, quantification was not possible for all proteins mentioned above, emphasizing the need for further studies to determine the gene expression of these proteins in other tissues.
A relation between relative gene expression and serum cytokine quantification was observed for serum levels of P1NP with OCL gene expression in bone (figure 6; p=0.04, r=0.353) and for serum levels of CTX with CTSK gene expression in bone (figure 7; p=0.017, r=0.406).