Depression Signs
Detection through
Smartphone Usage
Data Analysis
Nino Rafael da Silva Rocha
Mestrado integrado em Engenharia de Redes e Sistemas Informáticos
Departamento de Ciência de Computadores2014
Orientador
Ana Vasconcelos (MSc), Fraunhofer Portugal
Coorientador
O Presidente do Júri,
Acknowledgements
First of all, i would like to thank to my supervisors, Rita P. Ribeiro (PhD, DCC-FCUP) and Ana Vasconcelos (MSc, Fraunhofer Portugal) for all their kindness and dedication. To Dr. Ana Nobre, for the time spent with guidance in the field of psychology.
To Fraunhofer Portugal for giving me the opportunity to develop this project.
Next, thanks to my dear family, specially my father, mother, and sister, for believing in my skills, and for my education. All I am is because of them.
To my dear friends, specially to André Francisco, Ana Raquel Azevedo, André Gaspar, Filipe Martins, Geno Pereira, Hugo Sousa, Inês Caeiro, José Pedro, and Tiago Melo. A special thanks to my best friend who always believes in me, God.
A depressão é uma das doenças mentais mais comuns entre a população geral. Os sintomas de depressão são diversos: insónias, perda de energia, tristeza e isolamento. A depressão torna-se mais comum em estágios tardios da vida, alimentada principal-mente pela perda de familiares e cessação de actividade. Este trabalho propõem um estudo que utiliza informação colectada a partir de smartphones, como a localização, ou estatísticas de comunicação, entre outros, e conduz uma análise estatística e de machine learning para inferir conclusões sobre o estado depressivo de idosos. A análise estatística provou ser útil para determinar conclusões baseadas nos vários campos, enquanto que o machine learning deriva a suas conclusões a partir de hábitos populacionais. Um serviço web foi construído sobre esta implementação como uma ferramenta de visualização de dados. Este projeto é ainda um estudo preliminar que outros poderão utilizar como base para outros trabalhos.
Abstract
Depression is one of the most common mental disorders among the general population. Depression symptoms are diverse: sleep disorder, energy loss, sadness, or isolation. Depression is most common in late stages of life, mostly fueled by the loss of relatives and retirement. This work proposes a study that uses data collected from smartphones, such as location sensors, communication statistics, among others, and uses statistical analysis and machine learning to infer conclusions on elders’ depression symptoms. The statistical analysis proved useful for determining field-wise conclusions from per-sonal habits, while the machine learning process derives its conclusions from general population standards. A web service was constructed on top of this implementation as an useful data visualization tool. This is a preliminary study which might serve as ground basis for others to build upon.
Acknowledgements 3 Resumo 4 Abstract 5 List of Figures 9 1 Introduction 12 1.1 Goals . . . 13 1.2 Thesis Structure . . . 13
2 Seniors and Depression in Old-age 14 2.1 Age-related Changes . . . 14
2.2 Depression . . . 16
2.2.1 Aging and Depression . . . 17
2.3 Successful Aging . . . 19
3 Knowledge Discovery and Data Mining 23 3.1 Knowledge-discovery . . . 23
3.1.1 Data Mining . . . 24
3.1.2 Machine Learning . . . 25
3.2 Data Mining Process: Cross-Industry Standard Process . . . 27
3.2.1 Phase 1: Business Understanding . . . 28
3.2.2 Phase 2: Data Understanding. . . 28
3.2.3 Phase 3: Data Preparation . . . 29 6
3.2.4 Phase 4: Modeling . . . 29
3.2.5 Phase 5: Evaluation . . . 29
3.2.6 Phase 6: Deployment . . . 30
4 Market analysis and Existing Solutions 31 5 A CRISP-DM approach to DepSigns 34 5.1 Business Understanding . . . 34
5.2 Data Understanding . . . 35
5.2.1 Data Generation . . . 35
5.2.2 Database Model . . . 40
5.2.3 Statistical Analysis . . . 43
5.2.4 Central tendency measures . . . 43
5.3 Data Preparation . . . 47
5.4 Modeling . . . 52
5.5 Evaluation . . . 55
5.6 Deployment . . . 56
6 Technical Aspects and Implementation of DepSigns 57 6.1 Used Technologies . . . 57 6.1.1 Scikit Learn . . . 57 6.1.2 Web Services. . . 58 6.1.3 Model-View-Controller . . . 58 6.1.4 Database . . . 59 6.1.5 Backend. . . 59 6.1.6 Frontend . . . 60 6.1.7 Chart Rendering . . . 61 6.2 System Architecture . . . 61 6.2.1 Structure . . . 62 6.2.2 Database generation. . . 63
6.2.3 Authentication and Authorization . . . 67
6.2.4 Views . . . 68 7
6.2.4.3 Feedback . . . 72 6.2.4.4 Patient . . . 72 6.2.4.5 Analysis . . . 74 6.2.4.6 Patient List . . . 74 6.2.5 Projection . . . 75 6.2.6 Alerts . . . 76
6.2.7 Decision Tree Predictions . . . 78
7 Conclusion 81 7.1 Summary . . . 82 7.2 Challenges . . . 83 7.3 Future Work . . . 83 A Acronyms 86 B Source code 88 References 90 8
List of Figures
3.1 Data Mining Taxonomy. . . 25
3.2 Process diagram showing the relationship between the different phases of CRISP-DM (reprinted from [54]). . . 28
5.1 Probability density function (reprinted from [3]). . . 37
5.2 The database EER model . . . 42
5.3 Sample projection of the data and statistical analysis. . . 44
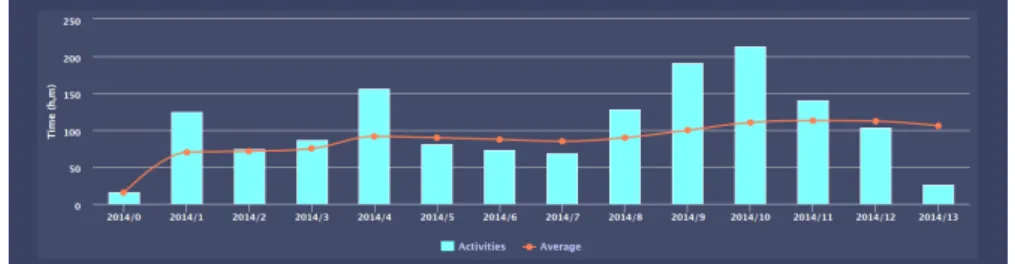
5.4 Example of an individual’s weekly time of activity, as well as its corre-sponding average . . . 45
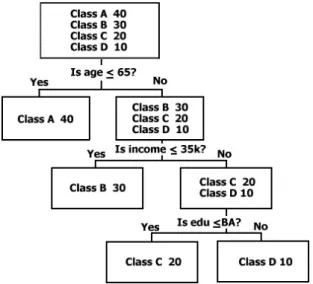
5.5 An example of a Learned Decision Tree, with leafs shown in yellow (reprinted from [52]). . . 53
5.6 Gini rule example(reprinted from [14]) . . . 54
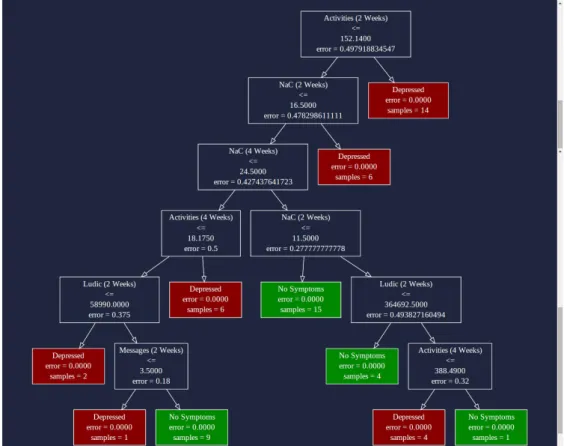
5.7 Visualization of a Learned Decision Tree. . . 55
6.1 DepSigns System Architecture . . . 62
6.2 Login page . . . 70
6.3 Registration form . . . 70
6.4 Psychologist’s main page. . . 71
6.5 Caregiver’s main page.. . . 71
6.6 Logout option. . . 72
6.7 Feedback psychologist option. . . 72
6.8 The patient page. . . 73
6.9 Visualization of the Learned Decision Tree. . . 74
6.10 Page with the list of patients, and a search bar. . . 75
6.11 Example of field-wise alert . . . 77 9
6.14 Decision Tree Predictions chart.. . . 79
Listings
5.1 Algorithm describing the process of collecting spline values using the
generic evaluation function. . . 44
5.2 Query used for Activities. . . 48
5.3 Query used for Ludic Activities. . . 49
5.4 Query used for Moods . . . 50
5.5 Query used for Locations . . . 50
5.6 Query used for Not Answered Calls, although Calls and Messages use a similar query. . . 50
6.1 The UserGenerator class . . . 64
6.2 The MoodGenerator class . . . 64
6.3 The ActivityGenerator class . . . 65
6.4 The remaining generator classes . . . 66
6.5 Normalize chart data function . . . 75
6.6 Check alert function . . . 77
6.7 Inference code . . . 78
6.8 Code for inference depression list . . . 80
6.9 Render Doughnut graphic . . . 80
B.1 Django models used to create the database . . . 88
Introduction
The starting point of this project was the Smart Companion, an Android customiza-tion developed at Fraunhofer Portugal specifically for seniors[41], that already collects specific data through specially developed algorithms enabling the users to receive med-ication reminders, call the emergency line, making calls,messages and among others features. In order to specify the data requirements that should be analysed we inter-viewed two psychologists specialized in dealing with seniors.
Depression is one of the most common mental disorders among the general population and can be manifested from childhood to old age. This is a serious mental health problem that is even considered as the leading cause of disability related to illnesses and health problems. Studies show that one in four people in the world suffers or will suffer from depression [11].
Depression symptoms include, among others: insomnia or excessive sleeping, loss of energy, sadness, or isolation. These can often be ignored or mistaken with normal age-related behaviour, but with proper monitoring, early signs of depression could be detected early making it possible to promptly provide appropriate care.
Currently, smartphones and their integrated sensors provide a set of data that, with the proper analysis, can be used to build a behavioural pattern of its user. By analysing this data we propose an application that uses statistical analysis and Machine Learning to detect depression signs.
CHAPTER 1. INTRODUCTION 13
1.1
Goals
The goal of this project is to implement a web platform which helps in identifying variances in behavioural patterns that might indicate depressive symptoms, by using a Machine Learning algorithm, statistical analysis, and visualization tools. This can aid psychologists and caregivers in detecting depressive symptoms at early stages, allowing for more efficient treatments of depression. We consider important to allow the psychologist to be the one providing the training data sample, which allows comparing methodologies used by different psychologists. We also implement history visualization which also permits comparing results. As such, this application might be useful not only for early detection of depressive signs but also to improve treatment methodologies.
1.2
Thesis Structure
In the present chapter we have described the motivation and the main goals of this thesis. In Chapter 2 is presented the state of the art about depression detection and how to achieve successful aging. In Chapter 3 we explain the concepts about knowledge discovery, Data Mining, Machine Learning and, in particular, the Data Mining process that we implement in our project. In Chapter 4 we detail our research about existing tools that can be similar to our project. Chapter 5 focuses in explaining each step we took in developing our project. In Chapter 6 we introduce the technologies we used and the underlying architecture. Finally, in Chapter 7, we show our conclusions and future work.
Seniors and Depression in Old-age
2.1
Age-related Changes
The development and ageing processes are strictly individual and there are several conditions, happenings and changes in life that influence the whole ageing process [20]. Throughout this text we will focus essentially on changes at the perceptual, cognitive and psychosocial levels which most commonly occur to seniors .
• Perceptual changes: Throughout the ageing process we can witness great per-ceptual changes which may be functional or structural. These changes mostly interfere on the performance of daily tasks and indirectly on seniors participation in society.
The deterioration of the sensory system level - responsible for processing sensory information - may influence and originate some difficulties on a motor level, phys-ical and intellectual activities, and may inclusively jeopardize and compromise seniors quality of life. These sensory changes may directly affect the senses, namely: sight, hearing, touch, palate and smell. When it comes to sight, a significant decrease in the eye’s transition and adaptation capacity might happen, resulting in a decreased perception of a distant object and lack of sensibility towards color interpretation. As for hearing, the reduction in listening high fre-quencies results in a difficulty to distinguish phenomena, in the misinterpretation
CHAPTER 2. SENIORS AND DEPRESSION IN OLD-AGE 15
of hurried verbal speeches or challenges in understanding speech in loud envi-ronments or even in parallel conversations. Touch is the sense responsible for the skin’s perception and also suffers changes throughout the ageing process, namely the loss of perceptive capacities which consequently compromises the balance and motor coordination. In addition, there is a bigger tolerance to extreme pain stimulus, diminished limb positioning and its articulation. Conscience also suffers changes to its structure, since seniors present bigger difficulties in detecting the forms and sizes of objects when in contact with the body [29].
• Cognitive Changes: On the cognitive level, the decrease in cognitive task’s performance (namely in terms of speed of information processing and resolution of more complex/new tasks) occurs on a gradual rate, being therefore seen as a normal aspect of ageing. Associated with this there are also several changes to the mental processes, such as perceptions, memory and intelligence. As such, we may point out that there is a connection and simultaneous operability between the sensory system and the cognitive system and its decline.
Braun and Lalonde cited in [19] associate the cognitive system’s decline only to the natural ageing process, since it is independent of social and health related factors. Salthouse (1989,1999) in [19] adds that the cognitive decline occurs due to the variations of the information propagation rate. For seniors, the changes in the mental processes in this stage in life may be characterized by a profile of cognitive decline, in which one can register several changes: increase in the time required to codify and store information, reduction of learning speed, difficulty in retaining information related to long term memory and difficulty in the interpreta-tion of tridimensional pictures [6].
• Psychosocial Changes: Seniors deal constantly with the big challenge of over-coming adversities, most of which are related to changes at a physical level. The absence or decrease of physical and motor capacities and dexterity are trans-formed in a sensation of inadaptability and frustration against the environment in which the individual is. These self-depressive sensations and feelings on the individual may often cause a social detachment, in order to avoid the perception of these changes so meaningful to one’s everyday life and confrontation with reality. Adding to these psychological changes there are also changes on a social
level, on close social relations. The negative events and particularly the death of important people in a close circle are some of the most frequent situations at this age, which leads almost inevitably to the realization that one "is old". There are other great challenges on a social level in the stage of old-age, such as the fear of eventual isolation and the integration in some institution, or the parting of one’s descendants from home.
The role and status of an individual in society may also be a subject of many im-portant changes for seniors - retirement and widowhood are two of the situations in which this matter is most evident. In the specific matter of retirement, seniors have the impression that one’s contribution on a working level is over, resulting in more free time which needs to be occupied somehow.
In addition, elders go through countless changes in different levels, mostly as consequence of physiological, psychosocial and perceptual changes. Side by side with the decline seniors face on several levels, there is still an increase of social and familiar and even personal pressure on the senior to be able to deal with these factors, adjusting one-self to one’s environment and find a possible and desired balance [39].
2.2
Depression
Depression is one of the most common mental disorders among the general population and can be manifested from childhood to old age. This is a serious mental health problem that is even considered as the leading cause of disability related to illnesses and health problems. According to data from some studies [11], one in four people in the world suffers or will suffer from Depression. In Portugal, one in five Portuguese is depressed and 1200 deaths are a direct result from this illness [23].
This mental illness is essentially characterized by depressive symptoms that can be episodic, recurrent or chronic such as low mood, reduced energy and loss of interest or enjoyment. When these symptoms are detected, they are also usually associated with inactivity, physical pain, poor concentration, reduced self-confidence, pessimism,
CHAPTER 2. SENIORS AND DEPRESSION IN OLD-AGE 17
disturbed sleep and altered appetite [7] leading a person to a substantial decrease in their ability to comply with their daily responsibilities. The causes associated with the manifestation of mental illness differ from person to person. In most cases, depressive episodes result from a variety of biological, psychosocial and family factors that increase the risk of a person developing a depressive disorder.
Biological factors that result in increased risk of depression include: the females has predisposition to the illness, especially in adolescence;people who suffer from physical pain without explanation; chronic diseases such as hypertension, history of thrombosis, asthma, diabetes; or other diseases such as AIDS and Cancer. People with substance abuse such as alcohol or drugs are also prone to developing depressive symptoms [55]. At a family level, individuals who have a family history of depression, those who live with a family member carrying a serious or chronic disease and significant loss of a close relative are among the main factors for depression.
The psychological and social factors have a significant role in the development of depression mainly on the individuals with stress-generating professions, people prone to anxiety and/or panic, loss of employment and loss of social relationships in their midst.
2.2.1 Aging and Depression
Defined by the American Psychiatric Association’s in Diagnostics and Statistical Man-ual (DMS-IV), Depresion in the Elderly is the existence of a depressive syndrome in individuals with over 65 years of age [32].
Since the worldwide trend is that of an increasingly aged population, the importance of diagnosis and treatment of depression in this age group must be highlighted. According to the World Health Organization, in 2025 there will be 1.2 billion people over 60 years of age and, in Portugal, the National Statistics Institute predicts a considerable increase in population percentage over 65 years of age, rising from 17,6% in 2008 to 32.3% in 2060 [12].
According to Melo and Ferruzzi in [34], Zimmerman (2000) stated that the probability of seniors suffering from this disease is greater than during youth or adulthood and this increase is justified by numerous losses and limitations associated with old age having consequences like low self-esteem. There are many risk factors associated with the onset of depression at this stage of life. At the psychosocial level, one of the most sig-nificant events is the end of an occupation. This can be negatively faced by the seniors since it leads to change routines and possible feelings of uselessness (Fernandez-Balesteros and Izal,1993 in [51]). The loss of loved ones and people in their social environment and the sometimes remoteness of family leads the seniors into a new cycle of life which can cause feelings of discouragement and loneliness (Figueiredo,2007 in [51]). Biological factors also pose a high risk of increased probability of depressive disorders. According to Nunes (2008) in [51] the cognitive decline associated with memory loss is one of the main complaints of people with depression. Associated with this are also functional insufficiency and physical illness that prevent seniors from participating in their usual daily activities. These factors combined can trigger feelings of inadequacy and social demotivation that are so often linked to Depression.
According to Fernandes in [26], Marques and Col(1989) summarize the factors of depression in seniors in three major areas: environmental determinants, particularly the isolation and the lack of social interaction and job, death of the spouse, and social and occupational devaluation. The genetics area considers seniors as a group with a genetic predisposition to depression. Finally the organic area refers to the wide variety of organic illnesses that may present symptoms of depressive nature. It should also be noted the importance of concomitant diseases and their respective medications that may results in side effects such as depression.
The branch of Medicine that focuses on the study of depressive symptoms in seniors is Geriatrics, aiming at the prevention and treatment of diseases at late stages of life. The monitoring and diagnosis are always done under the supervision of a doctor, but can be assessed through various evaluative scales available for patients. The most common scales cited in the literature are the Geriatric Depression Scale (GDS) and Center for Epidemiologic Studies Depression(CES-D). The GDS is a self-assessment questionnaire consisting of 30 questions with which the geriatric population can assess depressive symptoms. This same scale is used by professionals in monitoring and
CHAPTER 2. SENIORS AND DEPRESSION IN OLD-AGE 19
comparing the depressed state of the patient [37]. The CES-D has a smaller version of 10 items, characterized by a high specificity and sensitivity in the diagnosis of major depression in the hospital context [25]. Other scales used for screenings are the Hamilton Depression Scale(HAM-D) and the Patient Health Questionnaire-9(PHQ-9). The HAM-D is a standard method used in clinical studies and is not specific to the geriatric population and includes some items related to somatic pain so it may cause some confusion with chronic diseases that may arise [37]. The PHQ-9 is a 9-item ques-tionnaire derived from the DSM-IV for major depressive disorders and it is a instrument that aims to firstly, measure the severity of the depression and on the other hand is an auxiliary diagnostic tool for major depression [37].
2.3
Successful Aging
The concept of Successful Ageing was born in the 60’s and can be defined as a set of mechanisms of adaptation to the specific conditions of old age, looking to establish a balance between the capacity of the individual and the demands of the environment [20].
To study this concept, there is a need to overcome the stereotype commonly asso-ciated with this phase of life that this is a period in which the occurrence of disease is more frequent, the psychological and physical abilities decline and that there are obvious disabilities. To sustain a positive view of old age and the aging process, several studies were developed by The McArthur Foundation, such as "Study of McArthur Foundation"(1984) which is summarized in the book "Successful Ageing"(Rowe and Kahn,1998), which got a huge impact on the scientific community specialized in this area [50]. Rowe and Kahn(1998) argue that successful ageing, is based on "several factors that allow individuals to continue to work effectively, physically and mentally in old age [20]."
However, there is no specific pattern of successful ageing as this is a complex construct. Baltes and Cartensen (1996) in [20] state that there is no theory or standard criteria to defining success in old age but there are two related processes. On the one hand, the
ability to adapt to losses that occur in old age, and on the other hand, the selection of certain lifestyles in order to maintain a good physical and mental activity. According to this authors, we can say that there is not a single path to reach the success in ageing, but a variety of factors that have a huge importance.
Margoshes (1995) states that seniors should make the management of the available time in a more conscious and balanced way, transforming their lifestyle. In this con-scious and balanced way are included a positive mental attitude, continuous challenges, cognitive exercises and preservation of healthy habits, thus ensuring the success of aging [20]. To Rowe and Kahn (1998), the low risk and disability related to diseases, mental and physical functioning/active engagement with life are the 3 components able to provide successful aging, concluding that successful ageing is dependent on choices and on the social behaviors that can be obtained through individual effort [20].
All theories of successful ageing see the individuals as pro-actives and able to regulate their quality of life by setting goals and work to achieve them. For seniors to maintain a successful ageing, they must adjust to age-related changes and involve themselves actively to preserve their well-being. Active ageing or successful ageing, corresponds to the adoption of appropriate strategies to deal with the inherent challenge of the ageing process. Considering that there is no single path to grow old, it is inevitable to state the absence of a similar way to all people, because the pathways of aging are all different and it is possible to reach satisfaction and success in life through different routes. Noting the complexity to outline a pattern in this personal success in aging, it is of most importance to evaluate several criteria:
The Competence reveals itself of high importance because it is possible to predict
the psychological state of individuals through this criterion. Each individual adapts in a dynamic way to the biological aging and all changes in social network and may say that aging is successful as greater is the adaption to changes. Paúl (2001), affirms that it is necessary to pay attention to the bio-psychosocial and behavioral complexity of seniors, properly valuing individual responses which are most appropriate to counter hypotheti-cal losses of competence that jeopardize the autonomy of the subject. The integrity of autonomy in elderly life is implicit for successful aging, it is extremely necessary and required to have physical exercise and a constant existence of social relationships [20].
CHAPTER 2. SENIORS AND DEPRESSION IN OLD-AGE 21
Health Promotion is one of the aspects that have influence on successful ageing.
Ac-cording to Rowe and Kahn (1998), there should be prevention in adulthood emphasizing the influence of healthy lifestyle and health self-rated and how they reveal themselves in general well-being during aging [42].
Cognitive Activity is another criterion present to obtain a good aging. The adoption
of compensatory measures to cope with an expected unfavorable evolution of biolog-ical variables such as sensory loss and decreased speed of information processing, emerges as an essential combat factor to the fatalist view that old age corresponds to the loss of capacity to understanding and learning, highlighting as preventive mea-sures the physical exercise and cognitive training. Finally is it noted the importance of adopting strategy selections, compensation and optimization in relation to cognitive decline. Baltes and Cartensen (1999) in [20], describe this strategy in a distribution of available cognitive resources for the needs and goals to which the senior assigns more importance.
Psychological Well-being is one of the central aspects of aging successfully. The
competence, socioeconomic status and social integration emerge as the most impor-tant factors in measuring satisfaction and well-being. On the other hand, losses in areas such as retirement, widowhood and health issues, result in a negative impact on life satisfaction and psychological well-being [30].
The Context of Residence plays an equally important role to understanding the
differ-ent patterns of aging and explain why some people achieve successful aging. This satisfaction is explained by the theory of person-environment fit (Kahana and Law-ton,1992) in [20], which provides a satisfactory adaptation when in the transactions between the person and the environment, the individual characteristics of a person are congruent with the demands of the environment. The notion of aging-in-place is central to understanding the relationship between the context of residence and successful aging. Therefore, it is necessary to provide opportunities for older people to get a relationship with other people and find someone that they can trust, this being the best antidote against loneliness.
The Quality of Life, is one of the criteria of the success formula at this age. The
(physical, material, social and emotional). Autonomy, activity, material indexes, eco-nomic resources, health, living conditions, intimacy, safety, place in community and personal relationships are also key indicators in assessing the quality of life of an elder. Fernandez-Ballesteros (1998) in [17], gives an insight into the measurement of quality of life by the context and circumstances in which the elderly lives, such as social status, age or gender, although corroborating the position of several authors, stating that the generalized standard patterns of quality of life can not be established. In sum, it seems generally agreeable that seniors quality of life is directly related to biological, psychological, social and behavioral factors, and only through mediation of all these factors we can think in standards patterns of quality of life for seniors.
Chapter3
Knowledge Discovery and
Data Mining
Nowadays companies and institutions from various areas, such as science, business, or health care around the world have a huge amount of data stored with varied information, where the increase in the degree of complexity in their structures have a exponential tendency. The emergence of differentiated technologies for storage and retrieval of data, allow the user or analyst to obtain strategic information that can be transformed into useful knowledge from a collection of a logical structured data.
3.1
Knowledge-discovery
Worldwide companies and organizations have big databases aggregated to their com-puter systems. The analysis of such voluminous amount of data is not humanly possible without the assistance of computational tools. In this context, it is important to under-stand all the terms and the differences between Knowledge Discovery (KD), Knowledge Discovery in Databases (KDD), Knowledge Discovery and Data Mining (KDDM) and the specific step of Data Mining (DM).
Knowledge Discovery (KD) is a process through wich new knowledge or important information about the study domain is acquired. It involves many steps and each step
consists of a particular discovery task [28].
Knowledge Discovery in Databases (KDD) regards the application of the KD process to databases [28].
Fayyad et al. [16] defines it further as the non-trivial process of identifying valid, novel, potentially useful and ultimately understandable patterns in data. These result from the intersection of several areas, such as Machine Learning, Pattern Recognition, Databases, Statistics, Artificial Intelligence, Knowledge Acquisition for Expert Systems, Data Visu-alization and High-performance Computing.
The Knowledge Discovery and Data Mining (KDDM) process regards to the KD process applied to any data source. It is considered the entire knowledge extraction process, which, according to [28], addresses issues like data storage and access, algorithms efficiency, results interpretation and visualization and, human-machine interaction. Data Mining and Machine Learning are part of all these processes. In the following subsections, we contextualize them in the knowledge discovery process.
3.1.1 Data Mining
Data-Mining is a particular step of the KDD or KDDM processes. It consists on the application of specific algorithms and a variety of analysis tools to extract patterns and relationships from data that can be used to make valid predictions. It component of KDD currently strongly depends on known techniques such as Machine Learning, Pattern Recognition and Statistics to find patterns in data. However, it has become better known than the KDD and KDDM process themselves mostly due to it being the step where the search of knowledge techniques are applied. According to [28] and depending on the goal this knowledge discovery is distinguished into two types: Verification and Discovery. Verification only verifies the user’s hypothesis. Discovery is related to automatically finding new patterns. It can be subdivided into Prediction, where the found patterns are used to predict the future behavior of some entity; and Description, where the found patterns describe some entity in a way which is comprehensible to humans. The algorithms or methods in this task are supervised by an external source
CHAPTER 3. KNOWLEDGE DISCOVERY AND DATA MINING 25
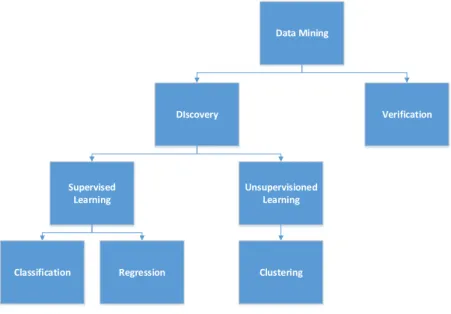
who knows the associated output values for each set of input attributes. According to the target variable type, numeric or categorical, we have Regression or Classification techniques. The algorithms used in Description assume the inexistence of a target variable, following here the system find patterns for presentation to a user in a way which is comprehensible to humans. The algorithms used in the this task ignore the output attribute following the unsupervised learning paradigm where is the Clustering and among others techniques. Figure3.1shows the taxonomy we have just described. However, we must stress that this a very elementary and over-simplistic view of Data Mining. Data Mining DIscovery Verification Supervised Learning Unsupervisioned Learning
Classification Regression Clustering
Figure 3.1: Data Mining Taxonomy.
3.1.2 Machine Learning
Along with research fields, such as statistics and pattern recognition, Machine Learning is one of the research field on which Data Mining relies on. It concerns the design and development of learning algorithms that allow computers to automatically learn patterns
or make decision based on data. To analyze the data is necessary an algorithm, which is a sequence of instructions that must carry out the processing of an input as an output. Although in some cases there is no algorithm to perform the desired task, it is only known the input and the output as it should be, not knowing how to do the transformation of the input in the output. This lack of algorithmic knowledge is compensated in the amount of data stored where the automatic extraction of knowledge from this data is the key to achieve the desired output by the analyst.
In 1959, Arthur Samuel defined the area of Machine Learning as a field of study that gives computers the ability to learn without being explicitly programmed[48]. This learning is achieved through the collection of data, direct experience or instructions that may be helpful in completing a task or make predictions. It is a subfield of Artificial Intel-ligence that consists of learning how to better perform given tasks in the future, based on past experience, always looking for automated methods without human intervention or assistance. In [35], Tom Mitchell states that a computer program is said to learn from experience E with respect to some class of tasks T and performance measure P , if its performance at tasks T as measured by P improves with experience E.
For there to be complementarity between learning and experience, Machine Learning intersects the area of Computer Science with the field of Statistics [36]. On one hand, Computer Science seeks the algorithmic efficiency for solving the optimization problem, processing, and storage of data, and on the other hand, Statistics focuses mainly on conclusions that can be inferred from data by constructing mathematical models. In certain applications, the efficiency of inference (like space complexity and time) can be as important as the accuracy of prognosis.
Much of the progress in Machine Learning is due to the high compatibility of its ap-plications in various areas in the real world. Web page ranking is used in search
engines when a query is submitted with the desired search, by returning the number of answers in order of their degree of relevance. Speech Recognition is a program that
is currently available in all commercial systems. The accuracy of this system is higher since the beginning of the automatic learning system instead of the manual system [36]. Robot Control methods have been successfully implemented in robotic systems, such as in learning precision aerial maneuvers of airplanes [36]. Computer Vision such as
CHAPTER 3. KNOWLEDGE DISCOVERY AND DATA MINING 27
for recognition [36]. Medical Diagnosis algorithms, such as Decision Tree Learning,
Naive Bayesian Classifier, and Neural Networks, are currently used for diagnosis of patients suffering from a disease [27].
3.2
Data Mining Process: Cross-Industry Standard Process
The Cross-Industry Standard Process for Data Mining (CRISP-DM) is an industry-proven way that offers a well-defined structure for the knowledge discovery process. The goal of proposed structure is to achieve better and faster results in Data Mining projects. This process was proposed in 1996 by a consortium of four companies, SPSS (a provider of commercial Data Mining solutions), NCR (a database provider), Daimler Chrysler, and OHRA (an insurance company)[28]. This consortium, formed with the goal of developing CRISP-DM, requested several Data Mining practitioners to develop a standard model to serve the Data Mining community. After several improvements and reviews, CRISP-DM was proposed by Cios et al in 2000, resulting in a process with six phases and intended to be a comprehensive Data Mining methodology and process model that provides a complete model for conducting a Data Mining project[28]. This process has been used in several projects from distinct areas such as, analysis of thrombosis data, text mining, analysis of retail store data, among others[28]. The phases that constitute this process are Business Understanding, Data Understanding, Data Preparation, Modeling, Evaluation and Deployment, as shown in Figure3.2.
Figure 3.2: Process diagram showing the relationship between the different phases of
CRISP-DM (reprinted from [54]).
In the following subsections we present each of these six phases [54]:
3.2.1 Phase 1: Business Understanding
Probably the most important phase of any Data Mining project, is focusing on un-derstanding the projects objectives, transforming into a formal Data Mining definition, consequently developing a primary plan designed to achieve the projects goals. It is necessary to determine the business’s objective, and all the clients goals need to be clear and describe all the resources available to reach these goals.
3.2.2 Phase 2: Data Understanding
This step starts with an initial data collection, where the analyst has to explore the data to clarify all the complexity, identifying data quality problems or detecting interesting information, such as data subsets, to form hypotheses about hidden knowledge and build the final data from the original data.
CHAPTER 3. KNOWLEDGE DISCOVERY AND DATA MINING 29
3.2.3 Phase 3: Data Preparation
This phase has the purpose of building the final data from the original data to use with modeling tools, where are included tasks such as, records, tables, format data, cleaning of data and construct new data.
3.2.4 Phase 4: Modeling
Several modeling techniques are selected to calibrate and apply Data Mining methods to the prepared data, but some techniques have specific requirements on the data format. In this phase it will be probably necessary to step back to the Data Preparation phase. Modeling steps include selecting the modeling technique, choosing the right algorithm, such as, for example, decision trees or neural networks. The next step is to generate a test design to determine the reliability of the model. For supervised learning the test is usual made by quality measure, developing a model based on the set of existing data and test the validity using a separate set of data. For unsupervised learning, such as the clustering technique, measurements may include criteria such as ease of interpretation, deployment, or required processing time.
3.2.5 Phase 5: Evaluation
It is necessary to evaluate the generated knowledge from a business perspective after the final deployment of the model is built by the data analyst. At this stage it is critical to determine if any important business issue has not been sufficiently analysed.
3.2.6 Phase 6: Deployment
The obtained knowledge must be organized and projected in a customer-oriented way, which often involves applying real-time personalization’s, such as web pages. It is necessary to implement a strategy to deploy all the Data Mining results in the best way, produce a monitorization plan to avoid incorrect usage of Data Mining results and produce a product final report.
Chapter4
Market analysis and
Existing Solutions
In the recent years there has been a significant growth in applications related to the health sector, in which the user has at its disposal several solutions for analysis and control over health-related behaviors, such as diabetes, physical exercise and medica-tion control. Surprisingly, little attenmedica-tion is still given to depression as there are few tools to support detection and treatment of mental disorders such as depression.
Most of the developed systems with the aim of predicting depressive problems have a failure in the specification, because they are based on general risk factors in the pre-diction of depression in the life of an individual. The lack of using personal data, which is critical for the specificity and reliability of the study of depression of the individual, such as physical activity, the analysis of the trend in the social community and its usual location, are used by few systems on the market and its availability for a personal use is still limited. These same applications present low realization of their main goals, that is, they are slightly explanatory about causes and factors influencing the onset of depression. It is important to notice that as far as we know through the specifications of this tools, only uses Domain Knowledge instead of Machine Learning or Data Mining techniques.
Next, we examine some of the solutions created in order to monitor and prevent some depressive symptoms:
Mobilyze application was developed by researchers at Northwestern University (USA)
and the main goal is monitoring behavioral patterns and mood states by identifying states that trigger depression, thus preventing it. The strategy consists of a combination between the sensors of personal phone (such as GPS, accelerometer, and Wi-Fi), with the data provided by users (such as the state of mind and social context). The main advantage of this application focuses on the possibility of anticipating depressive moments of the individual being monitored. Still, there are some barriers that have not been exceeded, for example, the differentiation of a calm day to a sign of depressive disorder[33].
Xpression is a mood analyzer, developed by the British company Ei Technologies,
that enables monitoring the state of mind of the individual using only the voice, more specifically, through the attribution of emotions during calls made by the user in their day-to-day, thus analysing the state of anxiety, stress and depression. This application is not available in the distribution market , although it is recognized it is importance in studies conducted in this field[46].
Menthal was developed by researchers at the University of Boon, in Germany, for the
Android operating system. The main purpose of this application is to monitor the use of the personal phone, recording the time that the user spends on the phone, analysing which applications are used more often. This data is sent to an anonymous server where the information and statistics of each user are collected, and then analyzed by experts. Studies are being made using this application, with the aim of developing a component which allows for detecting depression[47].
Another type of existing solutions aim to guide or help the user with a tutorial to prevent depressive disorders, based on general risk factors of depression. In most of these applications, the user is required to answer the inquiry based on established scales for monitoring this disorder, so there are not any specificity of data on the user’s phone to monitor depression.
We now list some solutions in the market following these guidelines:
CBT Depression Self-Help Guide was developed by the Limited Liability Company,
Excel at Life (USA). It is a guide support to detect depression, providing therapeutic arti-cles, diary of cognitive thoughts to learn to challenge thoughts causing stress, providing
CHAPTER 4. MARKET ANALYSIS AND EXISTING SOLUTIONS 33
positive thoughts, suggestions for helping track the concentration through motivation and screening tests with graphic support to monitor the severity of depression[15].
MyM3 is an application developed by collaborators at the University of Georgetown,
Washington (USA) that, in collaboration with cognitive behavior therapists have created a list for self-evaluation of primary care to monitor potential symptoms of anxiety, indicat-ing the relative risk of depressive symptoms or traumatic disorders. Such evaluation is made by the user and the data is then sent to a designated health care professional that analyzes the questionnaire and obtains relevant information helping the psychologist on getting a better diagnosis at the first visit with the patient[38].
Depression Calculator is an application developed by Egton Medical Information
Sys-tem Limited (UK), based on Patient Health Questionnaire Scale (PHQ-9), through which the user responds to this standard questionnaire trying to obtain a diagnosis of the de-pressive state. It is also provided a digital informative leaflet with important information and advices about Depression and antidepressants previously analyzed by experienced authorities in the field[40].
DepSigns: A CRISP-DM approach
to Depression Signs Detection through
Smartphone Usage Data
Throughout this chapter are presented the six phases of the DepSigns project, following the CRISP-DM process.
5.1
Business Understanding
Probably one of the most important phases of any Data Mining project is focusing on understanding the project’s objectives, transforming into a formal Data Mining definition, consequently developing a primary plan designed to achieve the project’s goals. It is necessary to determine the business’ objective, and the client’s goals and needs to be clear and describe all the resources available to reach these goals.
Our project specification required the use Machine Learning to infer depressive symp-toms in elders. Psychologists gave us the information that depression detection is mostly related to changes in habits. Therefore, we decided to also conduct a statistical analysis on elder’s data to cover this issue. However, the statistical analysis soon proved to have issues, such as when the elder is already depressed when we first
CHAPTER 5. A CRISP-DM APPROACH TO DEPSIGNS 35
start collecting data.
The Machine Learning process is based upon the psychologist’s manual process, which is described in Section5.2. It specifies which data should be analysed and how we de-cided on the structure, layout, and organization for our project, and chose an algorithm which would suit those requirements. We believe our method is closely related with the psychologist’s manual process and, therefore, results should be similar, but only further experiments will tell.
Most of this process consisted of a set of requirements from our project specification and, therefore, a deep analysis on the business understanding for this project is outside the scope of this thesis.
5.2
Data Understanding
This project handles sensitive data, which is personal to seniors. Therefore, there are some restrictions regarding how data can be disseminated. For this reason, we have created a data generator which simulates the physical and psychological states of abstract individuals. Next, we describe how this data is stored, organized, and how we have preprocessed it to build our dataset.
5.2.1 Data Generation
At this stage, it is important to mention that no data source whatsoever was provided for this project. Originally, all the data was intended to be originated from the Smart Companion project of Fraunhofer Portugal, which is an android customization that was designed to address senior’s goals and needs, with the goal to support seniors in their daily activities[41]. However, the database did not fulfil the requirements for this project and there was not enough data collected to support a study of this kind. For these reasons, we decided to create a generator which simulates the necessary data. This has imposed a great challenge on the replication of real-life situations. Using computer
generated data makes it impossible to guarantee that the database represents actual real-life situations, as there is no way of matching this data to real-life everyday cases. As such, the generator was created under psychologist guidance, which have provided feedback on common cases on which data would be useful, as well as its relevance in this study. The generator uses a probabilistic approach to this problem. Instead of having data from real patients, we have generated a list of patients, as well as their behavioural patterns for the duration of several weeks. This was achieved by using a Beta distribution on the moods of the patients, from which the rest of the data is inferred. Beta distribution is a family of continuous probability distributions defined on the interval [0, 1]configured by α and β shape parameters, which are the exponents of the random variable, and control the shape of the distribution. This distribution assumes the modu-lation of the behaviour of random variables limited to intervals of finite length. There are several areas of statistical description that use this distribution, such as genetic popula-tion or genetic heterogeneity in the probability of HIV transmission, among others. The standard Beta distribution gives the probability density of a value x on the interval [0, 1], as shown in Equation5.1.
P (x) = (1 − x)
β−1xα−1
B(α, β) (5.1)
where:
P (x)is the probability function α, β are the distribution parameters B(α,β) is the beta function
CHAPTER 5. A CRISP-DM APPROACH TO DEPSIGNS 37
Figure 5.1: Probability density function (reprinted from [3]).
From the beginning, this was intended to be a preliminary study. It is not known to us that any previous study of this kind exists, which limits to a large degree the basis we had as a starting point. Having no background on how to automatically detect depressive symptoms using our methodology, we chose our methods based on psychologist feedback and guidance, providing that our methods would closely relate to the methods used by the psychologist. For the psychologist analysis, it is important to know:
• how did the elder perform, activity wise? • how did the elder perform, location wise?
• how did the elder perform, communication wise? • and so on.
The order in which these fields are evaluated is relevant. This means that the data concerned with elder’s activities is considered the most relevant by the psychologist, under which a failure would indicate immediate depressive symptoms. The order of relevance given by the psychologist for each field is the following:
1. Activities 2. Locations
1. Calls
2. Not Answered Calls 3. Messages
4. Moods
5. Ludic Activities
The statistical study shows as a complement to the Machine Learning process in two distinct ways:
• it complements the study by giving more relevance to personal habits; • it allows for a much better data visualization tool.
We decided on using a generic central tendency metric which would allow future work to extend the set of available methods. On top of that, the application is also able to adapt to different methods used by different psychologists, provided that a suitable evaluation function exists and is implemented. However, we did focus on analysing the last two weeks of data, as previous studies exist that indicate that two weeks are sufficiently relevant to provide reliable results, as defined by the American Psychiatric Association [5]. One last thing to consider, related to the statistical process, consists in defining how the data is first evaluated. As an example, we consider the number of calls and not the time spent talking on the phone. The following lists how we evaluated each field as well as the reason that justifies our approach:
• Activities - total time spent performing a given activity. The amount of time is considered relevant as it yields a better indicator of daily physical activity then a count of the number of activities performed. We consider nightly activities to be prejudicial to the individual, as it indicates poor sleeping habits.
• Locations - total time spent away from home. Just leaving the house is not indicative of a positive activity, as there is no indication of the kind of activity. For instance, several activities could be performed, out of the house, like buying bread, which is not as relevant as leaving the household for several hours. Even so, we have no way of identifying the quality of the absence from home. That is, leaving the house, for how long as it might be, does not indicate whether the
CHAPTER 5. A CRISP-DM APPROACH TO DEPSIGNS 39
visited place contributes positively to the elder’s state of mind, and there is no automatic process, that we are aware of, that does so. As such, we consider all locations to have equal relevance, and make no attempts on identifying the location whatsoever.
• Communications - number of calls or messages sent and/or received. The amount of time spent using the phone was considered irrelevant by the psycholo-gist, as the amount of time does not vouch for the quality of what is being talked; instead, we only count the number of actions taken using the phone. Take as an example a situation in which an elder spends several hours talking to the same person. This could either indicate a very active social life or a very strong need for attention.
• Moods - count of the weekly mood self-evaluation. Seniors have four options to self-evaluate: Bad, Not Well, Fine, and Very Good. Each mood symbol is given a value by assigning to it a position in an array. Three is then subtracted from this position, making sure that bad moods yield negative values and good moods positive ones. The sum of these values is used as the the weight factor for each weekly mood.
• Ludic Activities - amount of time spent performing the activity weighted by the achieved score. The reason for this relates to elderly cognitive changes, as detailed in Chapter2, Section2.1.
For each name from a list of hand-given names the generator creates a patient entry. Each patient is then given a mood which we generate by assigning random integer values between 1 and 5 for the α and β parameters of the Beta distribution function, respectively. The reason these values are random is mainly because it is unknown to us what the correct distribution would be, thus allowing us to conduct several studies and getting to some final result which would seem reasonable. Again, the psycholo-gist feedback was essential at this point, which has later confirmed reasonability after inspecting several cases. Once again, this is only justifiable from the absence of any real-life data source.
As the probabilistic function generates real values between 0 and 1, we then assigned thresholds for mood values. According to psychologist advice, the moods can be
divided in four categories. Each category was given a 25 percentile of the range provided by the distribution function. As such, any mood value below 0.25 would be considered Bad, between 0.25 and 0.50 as Not Well, between 0.50 and 0.75 as Fine, and above 0.75 Very Good. These categories are then used as thresholds in the generation of all other data referring to the same patient, in the same week. One mood value was generated per week for the entire period of 12 weeks.
Every other field is generated by using the same Beta distribution parameters; that is, the α and β values that were randomly generated for the mood. However, the mood plays an important role in the generation of these fields, as it is used as a threshold for whether the patient complies or not with some obligations. Because the Beta distribution generate good habits for bad moods, and vice-versa, the worst the patient’s mood the more we would require of him/her. That is, for values generated between 0 and 1, indicating how willingly the patient would comply with his/hers obligations.By obligations we mean any average person’s daily duties, like answering phone calls, going out, waking up in the morning, among others. We assume that a patient having a Bad mood would require a willingness threshold of 0.90; however, we would require just 0.70 for patients with a Not Well mood; 0.50 for Fine; and 0.25 for Very Good. Again, these thresholds are merely experimental and no sustainable data will ever be available unless provided from real-life situations.
5.2.2 Database Model
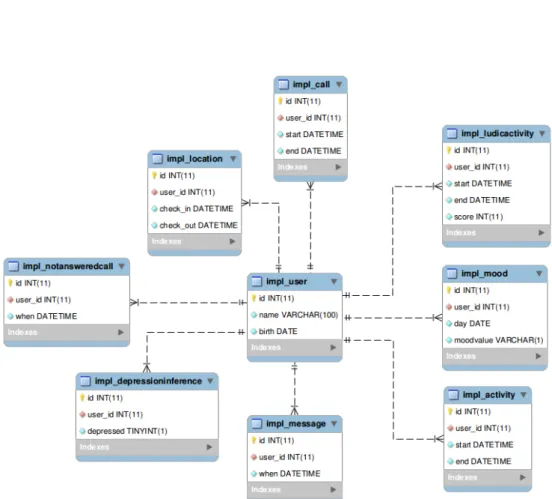
The database was modeled to represent a set of constraints that were agreed with psychologist guidance. The goal, however, was to match, as closely as possible, the structure of the Smart Companion database, without compromising the physiolo-gist’s requirements on elder data. To achieve this, the number of fields present in the database was kept at a minimum, allowing for improvement when trying to match it with the Smart Companion database.
Several entities were listed by the psychologist as essential for this study (see Figure
CHAPTER 5. A CRISP-DM APPROACH TO DEPSIGNS 41
• Users are a presentation of a studied entity, which, in the context of the current application, means an elder. This field is central to the database and is used to relate all other fields by means of foreign keys. The data stored in this table encompasses the name and date of birth for each elder.
• Activities represent daily physical activities separated by three different periods of the day: morning, afternoon, and night. The time at which the activity takes place indicates the period to which it belongs. These periods are later used to influence the relevance of the activity in the elder’s schedule. Each entry consists of a start and end timestamps indicating the period of the activity.
• Locations indicate places that seniors visit when they leave home. The place itself is not stored, instead just the period in which the person was absent from their place of residence. This decision was justified by the computer’s inability to decide whether any place was a good or a bad influence on any one given person. As such, just the timestamps for when the elder leaves and later arrives at home were stored.
• Phone calls are a registry of the elder’s voice communications over the tele-phone. Again, because the concrete context of the call cannot be determined as being positive or negative for the person under study, the only fields that were stored where the timestamps for the beginning and end of each phone call. This also allow us to compute the amount of time spent on the telephone.
• Not Answered Phone Calls consist of a registry of missed phone calls, not answered by the peer under study. Because of our inability to know the relevance of the other peer for the elder’s mood, we only store timestamps. In this case, however, and because missed phone calls do not have a duration period, we only register one timestamp, indicating the time at which the call was missed.
• Messages could be text messages or messages of other kinds of media. Again, the inability to infer whether the other peer is either a positive or negative influence to the person under study, forced us to discard any information about that peer, keeping the database structure minimal. For this field only one timestamp is stored, indicating when the message was first received.
him-self/herself would provide daily feedback on how good his/hers mood is. However, because a generator was used, this field is randomized as described in Section
5.3. Therefore, ideally, this field would be an introspective representatition of the elder’s mood in a daily basis. This field stores one of four possible different mood values (Very Good, Fine, Not Well, or Bad ) as well as a date indicating when the feedback was given.
• Ludic Activities are a registry of conginitive activities performed by the senior which hold a score. The context or content of the activity is not known, but the score is considered relevant (that is, seniors with no depression symptoms are expected to achieve better scores). For these reasons, only the start and end timestamps for the activity, as well as the performance score are saved in the database.
CHAPTER 5. A CRISP-DM APPROACH TO DEPSIGNS 43
5.2.3 Statistical Analysis
We conduct a statistical analysis on this data and use it to infer depression symptoms from personal habits. The goal of this statistical analysis is to find deviations from the elder’s usual behaviour, by detecting standard patterns in the elder’s daily activities, and causing field-wise alerts to be shown to the psychologist or caregiver. It is not clear to us - or to anyone, as far as we know - which kind of analysis would best detect the mentioned deviations. For this reason, we use an abstract evaluation function which can be configured by the psychologist using this software. Also, we provide a few samples which we consider to be descriptive of the application’s capabilities, although these routines are in no way intended to be used as a final product. Using such an abstraction allows the psychologist to further study which kind of analysis would be best, by changing the central tendency metric and watching the application respond, in real time, by changing conclusions on the elder’s conditions. The set of evaluation functions is further expandable, meaning that it was our intent from the beginning not to create a closure on the set of provided methods. However, as of the moment of this writing, adding evaluation functions requires making changes to the source code.
5.2.4 Central tendency measures
The evaluation function is considered to yield a measure of centrality of some sort. There are no restrictions on this measure, although it is highly recommended that the routine relates to the data as closely as possible. As input, we provide at each iteration an array with the data that has been processed by the previous iterations, plus one entry which has not yet been processed. To achieve this effect, while we iterate through the data samples, ordered by week, we keep an array containing all previous data entries, as shown in Listing 5.1. The output will later be used as a threshold for the weeks to come; we project this concept in the graph using splines, as shown in Figure 5.3. The result of the evaluation function is kept in a second array, which holds values for spline lines. Later, these lines are compared to the elder’s weekly results, providing a
threshold on how well the elder is doing. This threshold is considered to be the minimum requirement for us to consider the individual’s week as fulfilled. In case this mark has not been met for the last two weeks in a row, then an alert is raised for the given field. The decision to consider the last two weeks alone was achieved under psychologist guidance. Past weeks are used to infer personal habits, so we can make conclusions on the elder’s current state.
1 splinevalues = [] 2 previous = [] 3 for week in data:
4 spline = Evaluate(week,previous) 5 splinevalues.append(spline) 6 previous.append(week)
Listing 5.1: Algorithm describing the process of collecting spline values using the generic
evaluation function.
Figure 5.3shows a sample projection of the data and statistical analysis. Weeks are listed in the abscissa axis, and the ordinate axis lists compliance. Each vertical bar indicates how well a elder as performed during the matching week. The spline indicates a measure of centrality, according to the chosen evaluation function. Bars below the spline indicate a poor performance for the given week, which could indicate depressive symptoms.
Figure 5.3: Sample projection of the data and statistical analysis.
Nevertheless, an individual analysis such as the one given by any of the centrality metrics may be misleading as it heavily dependent on the senior’s initial condition. Elders that already performed poorly when we first started sampling data will accuse as being in their normal condition if they continue performing the same way, as shown in Figure5.4.
CHAPTER 5. A CRISP-DM APPROACH TO DEPSIGNS 45
Therefore, we will not be able to identify any depression symptoms whatsoever. This is why we also conduct a study using Machine Learning, which tries to solve this problem.
Figure 5.4: Example of an individual’s weekly time of activity, as well as its corresponding
average
This kind of data analysis is therefore used only to find deviances from personal habits, whatever those habits might be. Because we are well aware that conclusions achieved this way are provisional, we project the data history and allow the psychologist to further study each case individually. This history (shown previously in Figures 5.3 and 5.4) projects the data comparing it to the threshold generated by the generic evaluation function, providing a visualization tool for what is happening in the background . Later, we will see how this can also be used as a mechanism to provide feedback to the server, so we can infer conclusions from the general population.
The central tendency measure, therefore, plays a central role in the process of finding deviances to the typical behaviour. Because this routine provides the threshold for comparing against the data, it consists of an important backbone of this application. However, and because it is not known what the best measure would be, we have defined four different centrality measures that allow studying how well the application would perform under different conditions. These routines were suggested by the psychologist, having both parts agreed that they would in no way be final:
• average;
• simple moving average using 3 week intervals; • simple moving average using 5 week intervals; • standard deviation.
Each of these methods generates a threshold value that relates to the data in some way. Also, each will yield different results. It is now up to the psychologist to understand how well these results relate to each individual’s condition and, possibly, try to infer a general case.
Although average may refer to several different concepts of centrality (such as geo-metric mean, or harmonic mean), throughout this text we will always refer to arithmetic mean unless otherwise specified. As such, we define average as being a measure of central tendency. The average, usually represented by X, is defined as the sum of all the values in a data set divided by the number of values in the sample [49], as described by the following arithmetic formula:
X = 1 n n X i=1 Xi (5.2) where:
nis the number of observations Xi is the i-th observation of sample X
In Statistics, the standard deviation, usually represented by the Greek letter σ, is the most common measure of statistical dispersion, indicating how much variation or dis-persion there is from the average. A small standard deviation indicates that the data tends to be tightly related to the average. Data sets with large standard deviation indicate that the data is spread over a wider range of values[2]. The following formula represents the mathematical standard calculation:
σ = s
P(Xi− X)2
n (5.3)
CHAPTER 5. A CRISP-DM APPROACH TO DEPSIGNS 47
Xi is the i-th observation of sample X
Xis the average of all values of sample X. nis the number of observations
Weighted moving average is a statistical method for smoothing time series by averaging with weights to a fixed number of consecutive terms. This method is commonly used with time series data to smooth out short-therm fluctuations and highlight longer-term trends. Given a series of numbers and a fixed subset size, the first element of the moving average is obtained by taking off the initial fixed subset. Then the subset is modified by shifting forward, excluding the first number of the series and including the next number, creating a new subset of numbers, which is averaged[13]. This is represented by the following formula:
Xw= Pn t=1Wt∗ Vt Pn t=1Wt (5.4) where:
tis the index of the entries of an ordered set of samples Vtis the sample with index t from the set of samples V
Wtis the weight factor for the sample Vt
nis the number of periods in the weighting group
5.3
Data Preparation
Our generator and the Smart Companion database are interchangeable. This does not mean that they are the same thing, but rather that one is to be used in replacement of the other. In this case, the generator was created with the sole purpose of serving as a temporary replacement of the Smart Companion database, due to its unavailability (see Chapter5, Section5.2for more details).
data, and even abstract the process. These queries have the following two purposes: 1. Data Reduction - The raw data is stored in a daily basis. However, for the purpose
of this study, and under psychologist guidance, it was considered irrelevant to go as deep as analysing daily data. According to the psychologist’s opinion, the conclusions become more sustainable when analysing weekly periods, and therefore the first step consists in aggregating the data in that way.
2. Data Transformation - After being aggregated, we create weighted resumes
of the data. How each resume is computed depends on the actual field being weighted. We next proceed to explain this process.
As far as Data Transformation is concerned, the set of fields in the database can be divided in 5 different groups.
• Compute three summations of the time spent performing an activity divided by periods of the day (morning, afternoon, and night, depending on the time of the day). Each summation is then multiplied by a constant weight factor which as been specifically assigned to its matching period. In this case we used a multiplier of 2.0 for the morning period, 1.0 for the afternoon, and -2.0 for the night period. These values, however, are not justified and should be considered future work. For this reason, we left the constants out of the query allowing for easy customization. Then all values are added up. This way we give more or less relevance to each period of the day, while still ending up with a single, descriptive, value. Only the field for Activities fit into this category.
1 SELECT id, SUM(period * duration) as weight, week
2 FROM(
3 SELECT id, TRUNCATE(SEC_TO_TIME(SUM(TIME_TO_SEC(TIMEDIFF(end, start)))) /60,0) AS duration,
4 (CASE
5 WHEN TIME(start) BETWEEN ’06:00:00’ AND ’14:59:59’ THEN %f 6 WHEN TIME(start) BETWEEN ’15:00:00’ AND ’23:59:59’ THEN %f 7 WHEN TIME(start) BETWEEN ’00:00:00’ AND ’05:59:59’ THEN %f
8 END) AS period,
9 CONCAT(YEAR(start),’/’,WEEK(start)) AS week
10 FROM impl_activity
![Figure 3.2: Process diagram showing the relationship between the different phases of CRISP- CRISP-DM (reprinted from [54]).](https://thumb-eu.123doks.com/thumbv2/123dok_br/15601783.1052174/28.892.291.602.119.421/figure-process-diagram-showing-relationship-different-phases-reprinted.webp)
![Figure 5.1: Probability density function (reprinted from [3]).](https://thumb-eu.123doks.com/thumbv2/123dok_br/15601783.1052174/37.892.266.627.124.391/figure-probability-density-function-reprinted-from.webp)
![Figure 5.5: An example of a Learned Decision Tree, with leafs shown in yellow (reprinted from [52]).](https://thumb-eu.123doks.com/thumbv2/123dok_br/15601783.1052174/53.892.265.628.702.1038/figure-example-learned-decision-tree-leafs-yellow-reprinted.webp)