2015
UNIVERSIDADE DE LISBOA
FACULDADE DE CIÊNCIAS
Tracking Evolutionary Paths in Colonizing Events
Temporal changes in life-history traits, microsatellites and
inversions in Drosophila subobscura
Doutoramento em Biologia
Biologia Evolutiva
Josiane Miranda Sales Santos
Tese orientada por:
Professora Doutora Margarida Matos
Professora Doutora Marta Pascual
Table of Contents
List Of Tables ...I
List Of Figures ... V
List Of Publications ...VII
Acknowledgments ... IX
Abstract ... XIII
Resumo... XV
Resumo Alargado ...XVII
1.
Chapter 1
... 1
Introduction ... 3
1.1. Founder effects and adaptation ... 4
1.1.1. Impact of founder effects on genetic variability of colonizing populations ... 4
1.1.2. Association between non-codifying genetic variability and phenotypes related
to fitness ... 7
1.2. Impact of chromosomal inversions on adaptation ... 9
1.3. General aims ... 15
1.4 Outline of the thesis and specific goals ...16
1.5 References ...19
2.
Chapter 2
... 27
FISH mapping of microsatellite loci from Drosophila subobscura and its comparison
to related species ... 29
3.
Chapter 3
... 45
Fast evolutionary genetic differentiation during experimental colonizations ... 47
Supplementary Information ...61
4.
Chapter 4
...71
From nature to the laboratory: the impact of founder effects on adaptation ... 73
Supplementary Information ...91
5.
Chapter 5
... 105
Tracking changes in chromosomal arrangements and their genetic content
during adaptation ...107
6.
Chapter 6
... 159
Discussion ...161
6.1. Microsatellite cytological localization - a tool for further studies ...161
6.2. How fast do populations differentiate genetically after a colonizing event? ...162
6.3. Is there an association between genetic variability for neutral markers and phenotypes
related to fitness? ...164
6.4. Do chromosomal inversions foster adaptation in a new environment? ...167
6.5. Final remarks ...170
6.6. Future studies ...171
List of Tables
Chapter 2
Table 1. Localization of the 72 microsatellite markers on the polytene chromosomes of
D.subobscura,
and on the genomes of
D. pseudoobscura and D. melanogaster ...34
Table 2. Percentage, relative density, and Kolmogorov–Smirnov
D test for uniformity distribution of
microsatellite loci in each
D. subobscura chromosome... 38
Chapter 3
Table 1. Variability estimates for foundations at generation three and the respective founders ...54
Table 2. Pairwise differentiation between the founders and populations at generation three....55
Table 3. Genetic differentiation between the 2005 foundations at generation three... 55
Supplementary Information
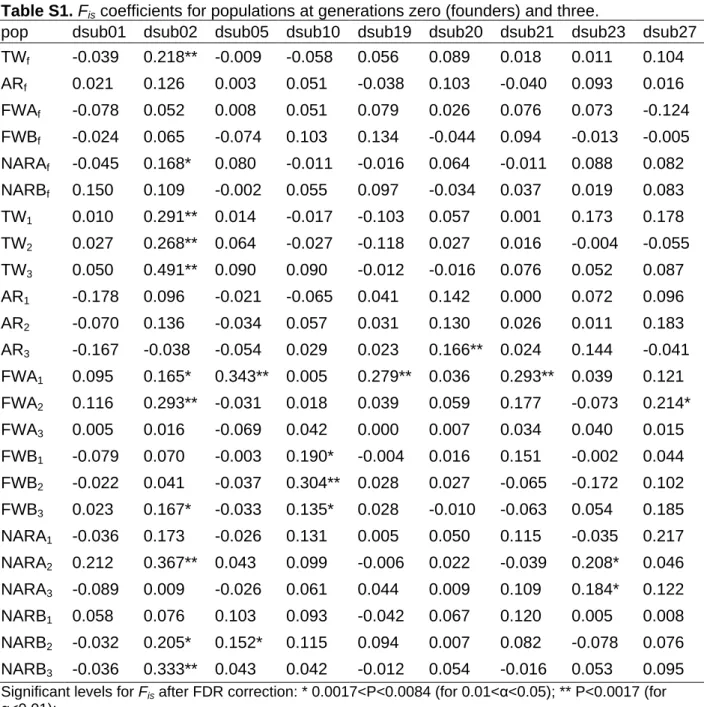
Table S1.
F
iscoefficients for populations at generations zero (founders) and three ... ...61
Table S2. Genetic differentiation between founder populations... ...62
Table S2. A. estimated by
F
ST...62
Table S2. B. estimated by
D
est...62
Table S3. Pairwise differentiation between the 2005 populations at generation three ...63
Table S4. Pairwise differentiation between the 2001 and the 2005 populations at generation three ..64
Table S5. Pairwise differentiation estimated by
D
estbetween founders and populations at generation
three ...65
Table S6. Pairwise differentiation estimated by
D
estbetween the 2005 populations at generation three ...66
Table S7. Pairwise differentiation (
D
est) between the 2001 and the 2005 populations at generation
three ...67
Table S8. Effective population size for foundations at generation 3 and the respective founders ...68
Table S9. Expected founder effects since foundation from
n founder individuals at generations one,
two and three ...69
Chapter 4
Table 1. Decline
per generation in allelic richness (dA) and in gene diversity (dH
E) after a founding
event ...80
Table 2. Effective population size of six foundations at different generations after a founding event
with
n female founders ...81
Table 3. Correlations between pairwise differences (for the six foundations) in life-history
param-eters and pairwise differences in microsatellite paramparam-eters ...83
Table 4. Correlations between pairwise differences in slopes of life-history traits and variability
de-cline in three generation ranges over six foundations ...83
Supplementary Information
Table S1. Census size across generations since introduction in the laboratory ...91
Table S1. A. Sintra and Arrábida, 2001 ...91
Table S1. B. Sintra, 2005 ...92
Table S1. C. Arrábida, 2005 ...93
Table S2. Allelic richness and gene diversity estimates at generations zero, three and 15 ...94
Table S2.A.
per generation, for six foundations ...94
Table S2.B.
per microsatellite, for six foundations ...95
Table S3. Simple Pearson correlation test and signed Mantel test between the variability decline
per generation and both the number of founders and the effective population size at generation
three...96
Table S4. Simple Pearson correlation coefficient between early differentiation or slopes of life
history traits and microsatellite parameters, number of founders and effective population size at
generation three and between generations three and 15...97
Table S5. Simple Pearson correlation coefficient between slopes of life history traits and
microsatel-lite variability decline
per generation in both allelic richness and gene diversity ...98
Table S6. ANOVA results ...99
Table S6. A. Friedman ANOVA testing differences in variability between the 6 foundations
across the 9 microsatellites, at generation zero ...99
Table S6. B. ANOVA testing the differences in variability between foundations at
genera-tions three and 15 ...99
Table S6. C. ANOVA testing the differences in the decline of variability between
founda-tions at each generation range ...99
Table S6. D. ANOVA testing the differences in the decline of variability across generation
ranges and foundations ...99
Table S7. Correlation coefficients between variability estimates at different generations ...100
Table S8. Correlations for the five foundations excluding AR, between pairwise differences in
life-history parameters and pairwise differences in microsatellite parameters ...101
Table S9. Correlations for the five foundations excluding AR, between pairwise differences in slopes
of life-history traits and variability decline
per generation in three generation ranges ...102
Chapter 5
Table 1. Cochran–Mantel–Haenszel statistic and probability of obtaining the observed frequency for
each inversion at generation 28 under the effect of genetic drift alone, considering its frequency at
gen-eration four ...124
Table 2. Cochran–Mantel–Haenszel statistic and probability of obtaining the observed frequency for
specific alleles at generation 28, at a given inversion, under the effect of genetic drift alone considering
its frequency at generation four... ...128
Table 3. Alleles in linkage disequilibrium with specific chromosomal arrangements at generation
four and generation 28 for SW populations, measured by
D’...129
Supplementary Information
Table S1. Multiplexing and Primers used for PCR amplification of the 22 microsatellites ...143
Table S2. Effective population size and 95% confidence interval considering changes in microsatellite
allele frequencies between generations four and 28 ...144
.
Table S3. Effective population size and 95% confidence interval considering changes in
microsatel-lite allele frequencies between generations 4 and 28 for the targeted inversions A
2, E
1+2+9+12, E
STand
O
3+4...144
Table S4. Number of larvae analyzed and number of arrangements detected at each population and
generation ...145
Table S5. Mixed-ANOVA testing several factors and their interactions on the variability estimates for
chromosomal arrangements ... ...146
Table S6. Mean chromosomal arrangement variability
per chromosome and generation and
percent-age of decline of each estimate between generations four and 28 ...147
Table S7. ANOVA testing the effect of Generation, Population, Locus and their interactions on the
linkage disequilibrium estimate (
D’m) between chromosomal inversions and microsatellite loci for
each chromosome ...148
Table S8. Differentiation in genetic content between generations four and 28 assessed by a locus by
locus hierarchical AMOVA for chromosomal arrangements whose changes cannot be explained by
drift alone ...149
List of Figures
Chapter 2
Figure 1. Localization of microsatellite probes by fluorescence in situ hybridization to
D. subobscura
polytene chromosomes...37
Figure 2. Cytological location of 72 microsatellite markers of
D. subobscura using Kunze-Mühl
chromosomal maps...38
Figure 3. Microsatellites’ location comparison across the homologous chromosomes of
D.
subob-scura, D. melanogaster, and D. pseudoobscura...40
Chapter 3
Figure 1. Founding scheme from the natural locations of Sintra and Arrábida used to derive
D. subobscura laboratory populations...51
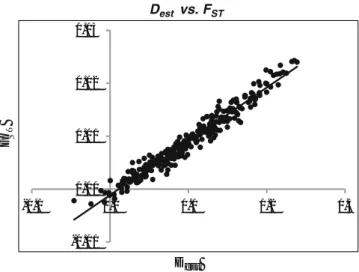
Figure 2. Plot of estimates of genetic differentiation by
D
estversus F
STacross all pairs of populations....54
Figure 3. Principal coordinates analysis of the 2005 populations at generations zero and three...56
Chapter 4
Figure 1. Mean genetic variability estimates for the six foundations after introduction in the
laboratory...80
Figure 2. Genetic differentiation (
F
CT) between pairs of foundations, each consisting of three
replicated populations, at generations three and 15, with 95% confidence interval...81
Figure 3. Principal coordinate analysis (PCoA) using
F
STvalues as distance across populations
and generations, including founders and generations three and 15...82
Figure 4. Evolutionary trajectories of several life-history traits during the first 20/21 generations
in the laboratory...84
Supplementary Information
Figure S1.
F
STbetween pairs of foundations ... 10 3
Chapter 5
Figure 1. Microsatellite chromosomal locations relative to inversion breakpoints ... 116
Figure 2. Evolutionary response of SW populations in five life-history traits during 33 generations
of laboratory adaptation ...1 2 2
Figure 3. Mean chromosomal inversion frequencies in SW populations at generations 4, 14 and 28
since establishment in the laboratory ...1 2 3
Figure 4. Ohta’s ratio between each of the five chromosomes and each locus located in it,
both at generation four and 28 ... 1 2 7
Supplementary Information
Figure S1. Linkage disequilibrium estimate (
D’m) in SW populations between each locus and
chromosome at generation four and 28 ... 1 5 0
Figure S2. Linkage disequilibrium estimate (
D’m) between chromosome O and its loci, both at
generation four and 28 ... 1 51
Figure S3. Linkage disequilibrium estimate (
D’m) between pairs of loci located in the same
chromosome, both at generation four and 28 ... 1 5 2
Figure S4. Ohta’s ratio between loci at each chromosome, both at generation four and 28 ... 1 5 3
Figure S5. Allele frequency changes between generations four and 28 at arrangements A
2, E
1+2+9+12,
E
STand O
3+4in the three SW populations ... 1 5 4
A minha tese foi dedicada ao estudo da dinâmica evolutiva de populações colonizadoras de
Drosophila subobscura
em adaptação a um novo ambiente, o laboratório. Para tal, desenvolvi estudos de
evolução em tempo real, seguindo um design de evolução experimental onde os percursos evolutivos de
populações replicadas foram monitorizados ao nível de características da história da vida, polimorfismo
cromossómico e variabilidade genética molecular, desde que colonizaram o novo ambiente. O objectivo deste
projecto foi clarificar questões relacionadas com a base genética da adaptação, explorando as consequências
evolutivas da colonização para as populações. Fiz a localização citológica de 72 microssatélites com eficiência,
revelando que os microssatélites localizados são marcadores genéticos adequados para futuros estudos
evolutivos, nomeadamente para estimar a variabilidade genética de populações e para estudar alterações no
conteúdo genético de cromossomas ou em regiões específicas, como as inversões cromossómicas. Através do
estudo de marcadores não-codificantes, do polimorfismo cromossómico e de características da história da
vida, verifiquei que a deriva genética teve um papel importante na evolução das populações após a
colonização. Além disso, através do estudo de múltiplas colonizações, verifiquei que efeitos estocásticos
iniciais durante a colonização podem causar alterações rápidas da variabilidade genética e rápida
diferenciação genética entre populações, em muito poucas gerações, mesmo quando a origem é comum e
quando se adaptam ao mesmo regime seletivo. Consegui destrinçar a diferenciação devida a diferentes origens
da diferenciação causada por efeito fundador em populações colonizadoras. Além disso, detectei o impacto
desses efeitos estocásticos iniciais durante o estabelecimento num novo ambiente na evolução adaptativa
subsequente, tanto de marcadores genéticos moleculares como de características relacionadas com a fitness, o
que me permitiu constatar que a evolução de populações colonizadoras deve ser monitorizada e não inferida,
já que é um processo altamente contingente. Pude, também, confirmar o valor adaptativo de diversas
inversões cromossómicas. Encontrei indicações de seleção natural nas alterações temporais das frequências das
inversões cromossómicas e/ou do conteúdo genético associado a elas. Estas alterações foram concomitantes
com a adaptação a nível fenotípico. A seleção epistática não esteve envolvida no processo. Através da
monitorização do percurso evolutivo de populações colonizadoras, com este trabalho tencionei complementar
o estudo da adaptação local levado a cabo ao longo de anos pela equipa que me ajudou a desenvolver este
projecto e espero ter contribuído para a compreensão da base genética da adaptação.
Palavras-chave: Evolução Experimental; Colonização; Inversões cromossómicas; Características da história da
vida; Conteúdo genético.
2
1.
3
4
5
6
7
8
9
10
11
12
13
14
15
16
17
18
19
20
'
21
22
23
24
25
26
28
29
30
FISH mapping of microsatellite loci from
Drosophila
subobscura and its comparison to related species
Josiane Santos&Lluis Serra&Elisabet Solé& Marta Pascual
Received: 9 October 2009 / Revised: 6 January 2010 / Accepted: 8 January 2010 / Published online: 3 March 2010 # Springer Science+Business Media B.V. 2010
Abstract Microsatellites are highly polymorphic markers that are distributed through all the genome being more abundant in non-coding regions. Whether they are neutral or under selection, these markers if localized can be used as co-dominant molecular markers to explore the dynamics of the evolutionary processes. Their cytological localization can allow identifying genes under selection, inferring recombination from a genomic point of view, or screening for the genomic reorganizations occurring during the evolution of a lineage, among others. In this paper, we report for the first time the localization of microsatellite loci by fluorescent in situ hybridization on Drosophila polytene chromosomes. In Drosophila subobscura, 72 dinucleo-tide microsatellite loci were localized by fluorescent in situ hybridization yielding unique hybridization signals. In the sex chromosome, microsatellite distribution was not uniform and its density was higher than in autosomes. We identified homologous segments to the sequence flanking the microsatellite loci by browsing the genome sequence of Drosophila pseudoobscura and Drosophila melanogaster. Their localization sup-ports the conservation of Muller’s chromosomal
ele-ments among Drosophila species and the existence of multiple intrachromosomal rearrangements within each evolutionary lineage. Finally, the lack of microsatellite repeats in the homologous D. melanogaster sequences suggests convergent evolution for high microsatellite density in the distal part of the X chromosome. Keywords cytogenetic map . Drosophila . fluorescent in situ hybridization . genome rearrangement .
microsatellite loci . repetitive DNA . genome comparison Abbreviations
DAPI 4'-6-Diamidino-2-phenylindole dsub ID names of the clones
FISH fluorescent in-situ hybridization HP1 Heterochromatin Protein 1 NTP nucleotides triphosphate PCR polymerase chain reaction rDNA ribosomal DNA
SSC Sodium Chloride-Sodium Citrate buffer SSR simple sequence repeats
UCSC University of California Santa Cruz
Introduction
Microsatellites are highly polymorphic markers consti-tuted by simple sequence tandem repeats (SSR) of one to six nucleotides per unit (Bachtrog et al.1999). They are ubiquitous among eukaryotes and have been described from a great variety of taxa (Wilder et al. 2002), being generally considered neutral unless linked to loci under strong selection. Although SSRs typically
Chromosome Research (2010) 18:213–226 DOI 10.1007/s10577-010-9112-4
Responsible Editor: Pat Heslop-Harrison. J. Santos
:
L. Serra:
E. Solé:
M. Pascual (*) Departament de Genètica, Facultat de Biologia, Universitat de Barcelona,08028 Barcelona, Spain e-mail: martapascual@ub.edu J. Santos
CBA, Departamento de Biologia, Faculdade de Ciências, Universidade de Lisboa,
1749-016 Lisbon, Portugal
31
represent selectively neutral DNA markers, random expansions or contractions appear to be selected against for at least part of SSR loci, presumably because of their effect on chromatin organization, regulation of gene activity, recombination, DNA replication, cell cycle, mismatch repair system, etc. (Li et al.2002). Some satellite and microsatellite DNA are organized in clusters of 100–10,000 tandem repeats and have been mainly associated with constitutive heterochromatin (Lohe et al.1993; Cuadrado and Jouve 2007a). However, some dinucleotide and trinucleotide repeats are also distributed through most euchromatic regions (Pardue et al. 1987; Cuadrado and Jouve 2007b). Furthermore, these two microsatellite classes are the most frequent repeats and have been widely used in forensics, population and conservation genetics, and for inferring selection in a wide range of species due to their high polymorphism and easy amplification. Some of those studies use microsatellite loci isolated from the same species from genomic libraries with clone inserts ranging from 200 to 800 bp depending on the methodology used (Pascual et al. 2000; Carreras-Carbonell et al.2004); however, others involve micro-satellite cross-species amplification (Carreras et al. 2006). It has been shown that amplification success is correlated with divergence between the source and the focal species in birds and fish (Primmer et al. 2005; Carreras-Carbonell et al. 2008), and 50% of loci are polymorphic between species presenting around 6% divergence for the 16S rDNA (Carreras-Carbonell et al. 2008). However, the conservation of flanking sequences for particular microsatellite motifs can span to 470 million years, suggesting that these sequences, although generally considered neutral, may play an important role in eukaryotic genomes and could be under strong selective constraints (Rico et al. 1996). Whether they are neutral or under selection, these markers if localized could be used for exploring the dynamics of the evolutionary process. Although the chromosomal dis-tribution of different repeat types has been assessed in several species (Cuadrado and Jouve2007b; Chang et al. 2008), only a few microsatellite loci have been physically localized until now by fluorescent in situ hybridization using as hybridization probes bacterial artificial chromosome inserts containing the loci of interest (Samollow et al. 2007; Di Meo et al. 2008) Furthermore, the physical localization of microsatellites and its comparison to other related species can give insight on the speciation process, on the genomic
reorganization during the evolution of a lineage, or the microsatellite conservation through time. Drosophila is a very interesting genus for studies addressing genome evolution because there are 12 different species that have been fully sequenced (Drosophila 12 Genomes Consortium 2007). The ancestral karyotype within the Drosophila genus consists of one dot and five acrocentric chromosome pairs. It is well known that the gene content of these six different elements is highly conserved, although there is extensive gene reshuffling within elements, referred to as Muller’s elements (Muller 1940; Drosophila 12 Genomes Consortium2007). Unfortunately, there is still a great gap of information on most Drosophila species, but comparative studies with available genomic sequences can be a very useful evolutionary tool for screening homologies and evaluating chromosomal synteny.
Drosophila subobscura is a Palearctic species with a vast distribution area that in the last decades has invaded the west coast of South and North America (Prevosti et al.1988; Ayala et al. 1989). This species has the ancestral Drosophila karyotype presenting five major acrocentric chromosomes denominated A, the sexual one, and J, U, E, and O, the autosomes, as well as one punctiform called the dot chromosome. There is high polymorphism of paracentric inversions in this species which has been shown to be adaptive and respond to environmental factors such as global warming (Balanyà et al. 2006). It has been suggested that inversions are conserving allelic combinations which have been favored by selection (Dobzhansky 1950). However, since this species has not been sequenced yet, markers with wide distribution along the genome can be very useful to track the basis of chromosomal inversion adaptation. Microsatellites are good candidate markers since they are expected to be evenly distributed along chromosomes. Furthermore, in D. subobscura, microsatellite markers have been shown to be a good tool for inferring colonization processes (Pascual et al.2001,2007) and for studying the evolutionary dynamics of local adaptation (Simões et al. 2008). Nevertheless, their localization is funda-mental to analyze the dynamics of inversion polymor-phism and track the genetic basis of genome-wide recombination and adaptation.
In the present study, we report the localization on polytene chromosomes of 72 dinucleotide microsatel-lites previously isolated from a D. subobscura DNA library (Pascual et al.2000). As localization technique,
214 J. Santos et al.
32
we used fluorescent in situ hybridization (FISH) since previous essays with non-fluorescence probes failed in the detection. Moreover, we analyzed microsatellite loci distribution and density throughout the genome, con-trasting results among the sex chromosome and auto-somes with implications on microsatellite function and generation. Finally, we searched in silico the complete genomes of Drosophila melanogaster and Drosophila pseudoobscura for the presence of the D. subobscura 72 microsatellite loci to assess the conservation of this repetitive, presumably non-coding DNA and the synteny between and within chromosomal elements.
Materials and methods
Fly stock and preparation of polytene chromosome slides A stock of the homokaryotypic strain cherry-curled (chcu) of D. subobscura was used to obtain polytene chromosomes slides to which the microsatellite probes were hybridized. The chcu strain is standard for all chromosomes (Ast, Est, Jst, Ust) except for
chromosome O which is O3+4. Third-instar larvae had
to be grown under density-controlled conditions to obtain readable slides. Approximately 150 eggs were collected periodically, transferred to 150-ml bottles with Drosophila medium, and grown at 18°C. Polytene chromosome slides were obtained as described in Lim (1993) with some modifications. Briefly, third-instar larvae were dissected on 45% acetic acid. Their clean salivary glands were transferred to a non-siliconized coverslip, fixed for 4 min on 1:2:3 solution (1 volume 86% lactic acid/2 volumes water/3 volumes glacial acetic acid), and gently squashed. The slides were kept at 4°C between 6 and 24 h, dived in liquid nitrogen to pry off the coverslip with a razor blade, and submerged in a 95% ethanol bath chilled at−80°C. The bath was kept at room temperature for about 3 h until slides slowly reached this temperature, after which they were air-dried, scored on a contrast phase microscope, and stored until used for hybridization for <2 weeks at 4°C. Microsatellite probes
A total of 72 previously isolated microsatellite loci were used as probes (Pascual et al.2000). The mean length of the perfect repeat was14.48±7.09 bp, and the mean size of their flanking region was 475.83±98.90 bp (see
Table 1). The amplifications of the probes for 64 loci were carried out using the forward (M13F) and reverse (M13Rmut) primers present in the pUC18 plasmid in which the loci were cloned. The probes for the other eight loci, since clones were not available, were amplified from chcu genomic DNA with primers designed to maximize probe length using the sequence of the clones of the microsatellite library (Genbank accession numbers GU732209-80). The amplified probes ranged between 300 and 700 bp and were labeled by PCR with a dNTP mix including 0.35 mM digoxigenin-11-dUTP, 1 mM dATP, 1 mM dCTP, 1 mM dGTP, and 0.65 mM dTTP. Amplification was conducted in a 25-µL reaction volume with 10× buffer, 3µL dNTP mix, 0.2µM of each primer, 1 U Taq polymerase (Amersham Pharmacia Biotech), and 1µL of clone or genomic DNA. The amplification reaction was carried out using an Applied Biosystems 2700 machine, beginning with an initial denaturation of 5 min at 94°C, followed by 30 cycles of denaturation for 30 s at 92°C, primer annealing for 30 s at 50°C and extension for 1.5 min at 65°C, and a final step of 5.5 min at 65°C. PCR product precipitation was carried out as in Lim (1993) with some modifications. In a final volume of 100µL, about 600–800 ng of amplified DNA was mixed with 6µg of salmon sperm. Precipitation was accomplished by adding 0.1 volume of 2.5 M sodium acetate and 2 volumes of 100% ethanol, mixed by inversion and incubated at−70°C for 20 min. DNA was recovered by centrifugation, air-dried, and frozen until used. The pellet was resuspended in 10µL of hybrid-ization solution containing 5µL of deionized formam-ide, 2µL of 50% dextran sulfate, and 1µL of 20X SSC. Hybridization and detection
In situ hybridizations were carried out following the fluorescent hybridization protocol for mitotic chro-mosomes (Pimpinelli et al. 2000). Probes were detected with an anti-digoxigenin-rhodamine antibody (Roche) adding 200µL of a detection solution (40µL of 20× SSC, 2 mg of bovine serum albumin, and 2µL of 10% Tween20) containing 260 ng of the antibody and incubating the slides in an opaque container humidified with 2× SSC for 45 min at 37°C. To eliminate excess of fluorescence, slides were dipped at 42°C in three consecutive baths of 4× SSC with 0.1% Tween20, for 5 min each; afterwards, they were rinsed first with 2× SSC and secondly with distilled
FISH microsatellite loci 215
33
Table 1 Localization of the 72 microsatellite markers by in situ fluorescent hybridization on the polytene chromosomes of D. subobscura, ordered by chromosome and cytological band, and localized by BLAST on the genomes of D. pseudoobscura and D. melanogaster
Drosophila subobscura D. pseudoobscura D. melanogaster
Marker Repeat motif Flanking Band Chr Id(bp) Banda) Chr Id(bp) Band
Chromosome A (Muller element A)
dsub11 (CA)13 423 03B XL 183 15A X 39 03D3
dsub17 (GT)18 472 03D XL 66 07A X 30 12D2
dsub37 (TG)17T(TG)4TG(TG)4 565 06C XL 116 12C X 72 02B1
dsub76 (GT)3GC(GT)4GC(GT)4GCC(GT)4CC(GT)9 343 08B XL 185 05B X 22 10B3b
dsub05 (AC)26TCAC 393 08E XL 126 11A X 52 18B6
dsub45 (CA)2TG(CA)15 398 08E XL 91 10C X 82 18A4
dsub66 (GT)18 637 09B XL 46 08B X/2Lc 19 _b
dsub52 (GT)14 535 09C XL 287 06A X 32 12F5
dsub30 (CA)11 368 10C XL 158 08A X 43 08A2
dsub21 (AG)18 504 11A XL 103 16B X 93 09A3
dsub78 (CA)2CT(CA)21 391 11A XL 53 16B X 35 09A3
dsub40 (TG)18 567 11A XL 123 16B X 54 09A2
dsub54 (GA)3GG(GA)13 610 11B XL 227 04C X 65 16A5
dsub33 (GT)17 457 11D XL 323 07D X 242 03B3
dsub32 (TG)20CC(GT)4 592 12A XL 55 01C X 32 20A4
dsub39 (CA)15 597 12B XL 185 06B X 169 05E1
dsub70 (TG)14 375 13A XL 64 16A X 50 11E1
dsub58 (CA)31 391 13B-C XL 111 16A X 36 16B7
dsub44 (GA)14 775 13C XL 84 08B X 62 03F2
dsub43 (CA)19 362 13E XL 103 03B X 76 01C3
dsub50 (CA)17 343 15A-B XL 61 07C X 52 19B1
dsub67 (TG)4TC(TG)TC(TG)2AG(TG)13 456 15B XL 50 07C 3L 22 77B2b
dsub19 (GA)27 329 15B-C XL 61 07D 3L 22 64A3b
dsub77 (CA)13 533 15D-E XL 104 14A X 33 09F5
dsub61 (GT)14 414 16C XL 72 05A 3R 23 92B2b
dsub57 (CA)13(CAGA)3 487 16D XL 91 02B 3L 20 64F5b
Chromosome U (Muller element B)
dsub10 (TG)27GG(TG)8 469 36A 4 114 89A 2L 86 40D2
dsub03 (CA)5TACAA(CA)13 482 37B 4 249 89B 2L 197 37B13
dsub31 (GT)12 485 42B 4 195 86E 2L 129 25E2
dsub42 (CT)20TG(CT) 531 44B 4 114 86D 2L 67 35A3
dsub64 (GA)28GG(GA)3 381 48B 4 85 98A 2L 51 21D2
dsub15 (AC)4AA(AC)11 531 52A 4 250 96D-E 2L 193 33D2
marker repeat motif flanking Loc Chr Id(bp) Loca Chr Id(bp) Loc
Chromosome E (Muller element C)
dsub46 (GA)21 527 54D-E 3 373 73C 2R 71 55E10
dsub68 (AC)18 477 54D-E 3 144 73C 2R 88 55E10
dsub35 (TG)19TT(TG)4 496 55D 3 183 72C 2R 72 44B1
dsub79 (GA)19 339 58A 3 161 77A 2R 114 58B1
dsub36 (AC)23 366 59B 3 132 69C 3R 25 92C3b
dsub20 (GA)24 499 62B 3 38 79D 2R 76 51B11
216 J. Santos et al.
34
Table 1 (continued)
Drosophila subobscura D. pseudoobscura D. melanogaster
dsub53 (GT)11TG(GT)5 744 70A-B 3 87 65D 2R 75 53D1
dsub80 (TG)24 268 70B-C 3 38 65D 2R 23 60C5b
dsub55 (CA)16 760 70D 3 72 68A 2R 23 55C4b
dsub28 (TG)9 463 73C 3 76 81B 2R 77 54A2
dsub48 (CA)19 357 74A 3 130 81C 2R 98 58A2
dsub41 (TA)4(GT)8ATG(TA)4 452 74C 3 176 81D 2R 120 56E1
dsub13 (GT)6TG(GT)8 453 74D 3 120 75B 2R 59 60F5
Chromosome J (Muller element D)
dsub23 (CT)18 591 19D XR 120 38D 3L 111 79C1
dsub16 (GA)32 429 21C XR 182 29C 3L 90 67E3
dsub18 (GT)21GC(GT)3 382 21C XR 70 30A 3L 42 67E5
dsub59 (CA)33 376 23D XR 66 28A 3L 45 67D5
dsub69 (TG)6G(TG)9 543 24D XR 134 23A 3L 91 66A1
dsub74 (GA)13GC(GA)3 662 25B XR 382 32B 3L 59 76D4
dsub62 (GA)19 513 29C-D XR 183 27B 3L 53 63E5
dsub60 (CA)15 384 31B XR 161 33A 3R 26 92C1
dsub07 (GA)11 456 32B XR 116 32C 3L 80 62C2
dsub27 (TG)15TG(TG)4 583 33A XR 113 42A 3L 59 78C2
dsub65 (AG)2AC(AG)14 553 34C-D XR 172 24B 3L 68 69D3
dsub08 (GA)2GG(GA)7GTGA 647 35C XR 81 36A 3L 29 73A3
dsub81 (GT)5 531 35C XR 35 36B 3R/3Lc _ _b
Chromosome O (Muller element E)
dsub26 (GA)4CA(GA)18AT(GA)4 412 75B 2 137 50C 3R 74 96F10
dsub02 (GA)14GCGA 512 78A 2 164 45D X 23 07B2b
dsub25 (CT)4CG(CT)26TG(CT)3 464 78C 2 88 43C 3R 44 92A2
dsub51 (AG)2ACAGAT(AG)36 404 79A 2 66 46D 3L/2L/2Rc _ _b
dsub14 (AG)8 480 82C 2 198 47C 3R 75 87B4
dsub47 (CA)13 370 82D-83A 2 154 47E 3R 132 82E1
dsub38 (TG)13AA(TG)3 577 86E 2 80 52B 3R 82 87E12
dsub34 (GT)14 324 88B 2 106 52D 3R 68 92E8
dsub71 (CA)9 412 88C 2 223 53C 3R 130 95D10
dsub01 (TG)14 483 90A 2 109 58C 3R 46 93F7
dsub73 (GA)14GC(GA)3 461 90A 2 177 58C 3R 70 93F10
dsub04 (GT)15 550 92D 2 131 59C 3R 45 100B5
dsub29 (GT)15CGA(GT)3 512 96A-B 2 198 59D 3R 176 98B3
dsub12 (CA)19 484 98B 2 49 56B 3L 30 69D2
mean ± SD 475.83±98.90 130±72 70±46
The repeat motif of the largest microsatellite and the size of the non-repeat flanking region are given for each D. subobscura clone. BLAST identity (Id) is given in base pairs.aChromosome bands for Drosophila pseudoobscura were inferred from Flybase;bBLAST expected value≥0.0001;cBLAST gave more than one possible location with the same expected value
FISH microsatellite loci 217
35
water, both at room temperature. Chromosomes were finally stained with 30µL of a solution containing 1 µg of DAPI (Roche) in 50 µL of Vectashield mounting medium (Vector Lab Inc.). The probes were localized using a vertical fluorescence microscope Leica DMRB from the Serveis Científico-Tècnics of the University of Barcelona equipped with a cooled digital camera CCD Micromax of RTE 782-Y format. Hybridization signals were photographed twice, first using a blue filter for DAPI and second using a red filter for rhodamine. Thus, chromosome bands showed up in blue after approximately 300-ms exposure, and probes showed up in red and were exposed for approximately 10 s. For each micro-satellite, three to ten nuclei were photographed and images overlapped using Adobe Photoshop program (Fig. 1a–e). To better assign the position of each microsatellite loci to each cytological band, chromo-some images were saved in black and white and, subsequently, colors inverted to better fit the banding pattern of polytene chromosomes maps (Fig.1f). The probes were localized by comparison to the banding pattern of the standard chromosomal inversions of D. subobscura established by Kunze-Mühl and Müller (1958) and modified as in Krimbas (1993). For the O chromosome, the bands were reorganized to match the O3+4arrangement present in the chcu strain (Fig.2).
Localization comparison between Drosophila species Orthologous sequences of our microsatellite loci were searched in the genome of D. melanogaster (Adams et al. 2000) and D. pseudoobscura (Richards et al. 2005) using the UCSC genome browser (http://genome. ucsc.edu/) and Flybase (http://www.flybase.org) for information of the alignments of the D. pseudoobscura sequence scaffolds with their polytene chromosome maps (Schaeffer et al. 2008). Homologous sequences with expected values higher than 0.0001 were not considered for comparison between species since they could be artifactual results due to the small identity encountered. Only searches including microsatellite flanking region were considered reliable.
Data analysis
Microsatellite density was inferred by dividing the number of microsatellites located to each chromo-some by the relative length of the chromochromo-some of the
Kunze-Mühl and Müller (1958) map as measured in Krimbas and Loukas (1980). A chi-square test was carried out in order to assess whether microsatellite density was the same among chromosomes, as well as between the A chromosome (sexual) and the autosomes. To evaluate the differences on the number of repeats in the clones among the five chromosomes, we used the non-parametric Kruskal–Wallis test. The number of repeats used corresponded to the largest perfect repeat given in Pascual et al. (2000). Differences in repeat length between autosomes and the sex chromosome were assessed by the Mann–Whitney U test. To test for differences in the proportion of AC and AG repeats between chromosomes, chi-square tests were carried out. For clones presenting more than one microsatellite loci, only one dinucleotide repeat was considered for the analysis corresponding to that having the larger number of repeats (Pascual et al. 2000). The Kolmogorov– Smirnov test was used to test whether microsatellite were uniformly distributed along each chromosome.
Results
Microsatellites localization and distribution on D. subobscura chromosomes
The overlapping of DAPI-stained banding pattern of chromosomes with the FISH signals of rhodamine-labeled probes enabled an accurate assignment of each probe to its specific cytological location (Fig.1). Multiple nuclei for each locus were scored giving the same precise band location on the Kunze-Mühl and Müller (1958) D. subobscura map reorganized to match the O3+4arrangement present in the chcu strain
(Fig. 2). All 72 microsatellite loci were unambigu-ously assigned to a chromosome and precisely located in a given band (Table 1).
The relative length of each chromosome was used to compute microsatellite density (Table2). Since no microsatellite probes were detected in the dot chro-mosome, we will only refer to the other five chromo-somal elements. Although microsatellites appeared on all five chromosomes, their density significantly varied among them (χ2
= 22.57, P<0.0002). There were no differences in density between autosomes (χ2
= 3.22, P < 0.359); however, there were clear differences between autosomes and chromosome A, the sexual chromosome, with a significantly higher density in the
218 J. Santos et al.
36
latter (χ2
= 8.92, P<0.003). Chromosome A, though the smallest one, presented 36% of the analyzed microsatellites. For all autosomes, the localized micro-satellites fitted a uniform distribution, as assessed by the
Kolmogorov–Smirnov test (Table2). On the contrary, microsatellites located in chromosome A significantly deviated from that distribution (Kolmogorov–Smirnov, D=0.297, P=0.016). No differences in the repeat
10
µ
10
µ
10
µ
10
µ
10
µ
10
µ
a
b
c
d
e
f
Fig. 1 Localization of microsatellite probes by fluorescence in situ hybridization to D. subobscura polytene chromosomes. a dsub54 probe hybridized to chromosome A (Muller element A). b dsub15 probe hybridized to chromosome U (Muller element B).
c dsub79 probe hybridized to chromosome E (Muller element C). d dsub22 probe hybridized to chromosome J (Muller element D). e dsub12 probe hybridized to chromosome O (Muller element E). f The same figure as e treated to facilitate probe localization
FISH microsatellite loci 219
37
Fig. 2 Cytological location of 72 microsatellite markers of D. subobscura using Kunze-Mühl chromosomal maps. All chro-mosomes represent the standard inversion with the exception of
the O chromosome rearranged to match the O3+4arrangement present in the chcu strain. Numbers represent each micro-satellite loci
Chromosome Relative length No. of microsatellites Microsatellite density D P value
A 0.17 26 0.081 0.297 0.016 E 0.19 13 0.036 0.318 0.114 J 0.20 13 0.031 0.168 0.768 O 0.24 14 0.030 0.144 0.896 U 0.20 6 0.015 0.264 0.712 Table 2 Percentage, relative density, and Kolmogorov–Smirnov D test for uniformity distribu-tion of microsatellite loci in each D. subobscura chromosome
220 J. Santos et al.
38
length of the clone were observed among the five chromosomes as computed by the Kruskal–Wallis test (H=1.05, P=0.902) or between autosomes and the sexual chromosome as given by the Mann–Whitney test (U=544.5, P=0.629).
The frequency of microsatellites with AC repeats was significantly higher than the frequency of microsatellites with AG repeats (χ2
= 5.62, P=0.017). Nevertheless, not all chromosomes presented the same proportion, the frequency of AC repeats being higher than AG repeats in chromosomes A, E, and U (85%, 77%, and 67%, respectively) and similar in chromosomes J and O (57% and 46%, respectively). However, significant pairwise differences, regarding the proportion of AC repeats, were only obtained when comparing the A and the J chromosome, being those showing the more extreme AC proportions (χ2
= 6.33, P=0.012).
Microsatellite homologies in related Drosophila genome projects
The orthologous sequences of the D. subobscura 72 microsatellite loci including their flanking regions were searched in the genomes of D. pseudoobscura and D. melanogaster using the UCSC and Flybase genome browsers. The aligned segments were gener-ally larger when compared to the D. pseudoobscura genome (mean = 130±72 bp) than with D. melanogaster (mean = 70±46 bp; see Table1). In D. melanogaster, only the flanking regions were detected. On the contrary, in D. pseudoobscura, not only the orthologous flanking regions were larger but also the same micro-satellite repeat was detected in 88.9% of the loci. Overall, 50% of the loci could be located within introns in D. melanogaster and 68% of the loci in D. pseudoobscura, the difference being due to predicted genes. All D. subobscura microsatellite loci were located in the same chromosomal element in D. pseudoobscura (Table 1 and Fig. 3). However, when searching our sequences in the D. melanogaster genome, nine loci were located in a different element. Nevertheless, these results were generally associated with a high expected value between the aligned sequences having thus a low probability of being true homologous sequences. Only two loci, dsub60 and dsub12, presenting low expected value and thus with a higher probability of being orthologous were localized in a different chromosomal element in D. melanogaster; nevertheless, the homologous detected sequence was
small and the number of the aligned base pairs smaller than 30 bp (Table1).
Discussion
Microsatellite localization and distribution
The results of the present study reveal the adequacy of FISH for localizing individual microsatellite loci on polytene chromosomes. All hybridization signals were unique, indicating high specificity and repro-ducibility of the technique used and at the same time proving that these microsatellite loci are suitable markers for accurate identification of individual chromosomes or specific regions within them.
In a preliminary study, a few probes had been labeled with biotin as described in Segarra and Aguadé (1992), and while single copy genes were perfectly localized, no signals were observed for microsatellite loci probes with the same length (Pascual, personal communication). Fluorescent in situ hybridization using digoxigenin-labeled DNA probes is more suitable since it comprises no danger and can be similarly efficient to radioactivity in localizing small DNA fragments or less accessible regions. Hybridizations are hard to detect in DNA regions densely packed and under-replicated as observed in intercalary heterochromatin (Belyaeva et al. 2008). Thus, high DNA packaging or under-replication of microsatellite-rich regions seems a plausible explanation for the unsuccessful hybridiza-tion with biotin.
The lack of hybridized microsatellites on the dot chromosome of D. subobscura is in agreement with the lower frequency of dinucleotide repeats found in that chromosomal element in relation to the other chromosomes in other Drosophila species (Lowenhaupt et al.1989). However, differences among species have been reported since the dot chromosome of Drosophila virilis has approximately 20-fold higher level of AC repeats than that of D. melanogaster (Slawson et al. 2006). Immunofluorescent staining of the dot chromo-some using HP1 antibody showed a banded pattern in D. pseudoobscura and D. melanogaster, indicating that this element is mostly constituted by heterochromatin, while negative hybridization in D. virilis supported the inference of being euchromatic (Riddle and Elgin 2006). Thus, it is more plausible that D. subobscura
FISH microsatellite loci 221
39
dsub21/ dsub78/dsub40 dsub11 dsub17 dsub37 dsub76 dsub05/ dsub45 dsub66 dsub52 dsub30 dsub54 dsub33 dsub32 dsub39 dsub70 dsub58 dsub44 dsub43 dsub50 dsub67 dsub19 dsub77 dsub61 dsub57 A sub dsub32 X mel dsub50 dsub05 dsub45 dsub58 dsub54 dsub52 dsub17 dsub70 dsub77 dsub21/ dsub78 dsub30 dsub39 dsub44 dsub11 dsub33 dsub37 dsub43 dsub40 XL pse dsub32 dsub57 dsub43 dsub54 dsub61 dsub76 dsub52 dsub39 dsub17 dsub6/dsub50 dsub33 dsub19 dsub30 dsub66 dsub44 dsub45 dsub05 dsub37 dsub77 dsub11 dsub58 dsub21/dsub78 /dsub40 dsub70 dsub21/ dsub78/dsub40 dsub11 dsub17 dsub37 dsub76 dsub05/ dsub45 dsub66 dsub52 dsub30 dsub54 dsub33 dsub32 dsub39 dsub70 dsub58 dsub44 dsub43 dsub50 dsub67 dsub19 dsub77 dsub61 dsub57 A sub dsub32 X mel dsub50 dsub05 dsub45 dsub58 dsub54 dsub52 dsub17 dsub70 dsub77 dsub21/ dsub78 dsub30 dsub39 dsub44 dsub11 dsub33 dsub37 dsub43 dsub40 XL pse dsub32 dsub57 dsub43 dsub54 dsub61 dsub76 dsub52 dsub39 dsub17 dsub6/dsub50 dsub33 dsub19 dsub30 dsub66 dsub44 dsub45 dsub05 dsub37 dsub77 dsub11 dsub58 dsub21/dsub78 /dsub40 dsub70 dsub80 dsub53 dsub55 dsub36 dsub13 dsub46/ dsub68 dsub35 dsub79 dsub20 dsub28 dsub48 dsub41 E 3 pse dsub13 dsub79 dsub48 dsub41 dsub46/ dsub68 dsub28 dsub53 dsub20 dsub35 sub 2R mel dsub13 dsub41 dsub48 dsub28 dsub55 dsub80 dsub53 dsub20 dsub36 dsub79 dsub35 dsub46/ dsub68 dsub80 dsub53 dsub55 dsub36 dsub13 dsub46/ dsub68 dsub35 dsub79 dsub20 dsub28 dsub48 dsub41 E 3 pse dsub13 dsub79 dsub48 dsub41 dsub46/ dsub68 dsub28 dsub53 dsub20 dsub35 sub 2R mel dsub13 dsub41 dsub48 dsub28 dsub55 dsub80 dsub53 dsub20 dsub36 dsub79 dsub35 dsub46/ dsub68 dsub80 dsub53 dsub55 dsub36 dsub13 dsub46/ dsub68 dsub35 dsub79 dsub20 dsub28 dsub48 dsub41 E 3 pse dsub13 dsub79 dsub48 dsub41 dsub46/ dsub68 dsub28 dsub53 dsub20 dsub35 sub 2R mel dsub13 dsub41 dsub48 dsub28 dsub55 dsub80 dsub53 dsub20 dsub36 dsub79 dsub35 dsub46/ dsub68 dsub62 dsub07 dsub69 dsub59 dsub12 dsub08 dsub74 dsub27 dsub23 dsub08 dsub81 dsub65 dsub27 dsub07 dsub60 dsub62 dsub74 dsub69 dsub59 dsub23 dsub16 dsub65 J sub 3L mel dsub16/ dsub18 XR pse dsub69 dsub65 dsub62 dsub59 dsub18 dsub16 dsub18 dsub74 dsub07 dsub60 dsub08 dsub81 dsub23 dsub27 dsub62 dsub07 dsub69 dsub59 dsub12 dsub08 dsub74 dsub27 dsub23 dsub08 dsub81 dsub65 dsub27 dsub07 dsub60 dsub62 dsub74 dsub69 dsub59 dsub23 dsub16 dsub65 J sub 3L mel dsub16/ dsub18 XR pse dsub69 dsub65 dsub62 dsub59 dsub18 dsub16 dsub18 dsub74 dsub07 dsub60 dsub08 dsub81 dsub23 dsub27 dsub26 dsub02 dsub25 dsub51 dsub14 dsub47 dsub38 dsub71 dsub34 dsub01/ dsub73 dsub12 dsub29 dsub04 dsub04 dsub29 dsub26 dsub71 dsub73 dsub34 dsub25 dsub38 dsub14 dsub47 dsub01 dsub60 O sub 3R mel 2 pse dsub71 dsub29 dsub04 dsub01/dsub73 dsub12 dsub25 dsub34 dsub38 dsub26 dsub47 dsub14 dsub51 dsub26 dsub02 dsub25 dsub51 dsub14 dsub47 dsub38 dsub71 dsub34 dsub01/ dsub73 dsub12 dsub29 dsub04 dsub04 dsub29 dsub26 dsub71 dsub73 dsub34 dsub25 dsub38 dsub14 dsub47 dsub01 dsub60 O sub 3R mel 2 pse dsub71 dsub29 dsub04 dsub01/dsub73 dsub12 dsub25 dsub34 dsub38 dsub26 dsub47 dsub14 dsub51 dsub64 dsub31 dsub15 dsub42 dsub03 dsub10 U sub 2L mel dsub10 dsub03 dsub31 dsub42 dsub64 dsub15 4 pse dsub42 dsub31 dsub10 dsub03 dsub15 dsub64 dsub64 dsub31 dsub15 dsub42 dsub03 dsub10 U sub 2L mel dsub10 dsub03 dsub31 dsub42 dsub64 dsub15 4 pse dsub42 dsub31 dsub10 dsub03 dsub15 dsub64
Fig. 3 Microsatellites location comparison across the homol-ogous chromosomes of D. subobscura, D. melanogaster, and D. pseudoobscura. For the last two species, microsatellite position was determined by BLAST in the UCSC and Flybase
servers. Each chromosome is oriented so that its centromere (full dot) is pointing down. The length of each chromosome is the same to facilitate across-species comparison and does not reflect size differences between chromosomes
222 J. Santos et al.
40
is mostly heterochromatic and depleted of dinucleotide repeats as in D. melanogaster and D. pseudoobscura, the latter being from the same group.
In D. subobscura, microsatellite density is signif-icantly higher in the sexual A chromosome when compared to the autosomes, and no bias in the location of the loci was expected from the random isolation of microsatellite loci from a genomic, non-enriched microsatellite DNA library (Pascual et al. 2000). This difference had already been observed in other Drosophila species (Pardue et al. 1987; Lowenhaupt et al. 1989; Bachtrog et al. 1999) with 1.5–3 times as many repeats per million base pairs of sequence in the sex chromosome than for the autosomes (Katti et al.2001).
Moreover, D. subobscura microsatellites located in the sex chromosome showed a non-uniform distribu-tion with more microsatellites being detected near the telomere (distal end), contrary to a uniform one in autosomes. These differences could be an artifact of the number of loci hybridized. Nonetheless non-random distribution of AC repeats have been observed in other studies with the highest concentration in the distal two thirds of the X chromosome of D. melanogaster (Pardue et al. 1987; Cuadrado and Jouve 2007b), confirming our results and suggesting some functional significance of these repetitive sequences. Abundance of repetitive DNA might be related to the higher order structures and the packaging level and expression of DNA, although there is still a great gap in the literature concerning these issues.
A general significantly higher proportion of AC than AG was found in the present work along the genome of D. subobscura, being the largest propor-tion detected in the sex chromosome as reported in other Drosophila species (Pardue et al.1987; Bachtrog et al. 1999; Cuadrado and Jouve 2007b). Why these two dinucleotide repetitions (AC/TG and AG/TC), with the same proportion of each nucleotide in the double-stranded DNA and similar slippage synthesis potential (Schlötterer and Tautz1992), show different frequency and genomic distribution has been attributed to an old genomic component conferring some type of evolutionary advantage (Cuadrado and Jouve 2007b). However, this hypothesis was not confirmed by our observations since no repeats were found in the homologous D. subobscura sequences observed in D. melanogaster (see below) in spite of the similar pattern of dinucleotide distribution in the X chromosome of
both species. Consequently, independent distribution of the same elements points to convergence and suggests a functional role of microsatellite loci in the chromo-somal architecture.
Faster evolutionary rate in the sex chromosome has been hypothesized to be caused by higher mutation rate, higher recombination rate, dosage compensation mechanisms, or purifying selection leading to higher accumulation of mutations in the sex chromosome. For the mutation rate hypothesis, no differences in the average levels of nucleotide diversity or different rates of amino acid evolution were observed between the sex chromosomes and autosomes in Drosophila, although silent and intron sites show slightly more divergence in the X chromosome (Bauer and Aquadro 1997; Thornton et al. 2006). Nonetheless, fourfold differences in evolutionary rate among chromosomal elements were reported in some Drosophila species, with the sex chromosome exhibiting the highest rate of rearrangement (González et al. 2002). Regarding the recombination rate hypothesis, no significant effect was observed that could explain the different microsatellite density on the sex chromosome (Bachtrog et al.1999). In addition, no consistent effect was encountered between recombination rate and autosome evolution, although a higher average recombination rate for chromosome X was observed (González et al.2002).
Support for the dosage compensation mechanism causing faster X evolution, which in Drosophila consists of an increased expression of sex-linked genes in males, comes from autosomal arms that have fused to sex chromosomes, such as in D. pseudoobscura and Drosophila miranda (Pardue et al. 1987). These chromosomes, having newly acquired dosage compen-sation, were also found to have an increased density of microsatellites in comparison to the homologous autosomal elements in the other Drosophila species. It was indicated that the X chromosome evolves differ-ently from autosomes as a result of its hemi-zygosity in males, X chromosome inactivation during spermatogenesis, and sexual antagonism, supporting that selection can also be driving gene content evolution of sex chromosomes (Gurbich and Bachtrog 2008).
Purifying selection was proposed to present greater efficiency on the X chromosome than on the autosomes across the Drosophila phylogeny since codon usage bias is consistently greater for X-linked genes (Singh et al. 2008). Moreover, for the three Drosophila species
FISH microsatellite loci 223
41
compared in the present work, it was indicated that in ancestral populations, purifying selection could explain the higher microsatellite polymorphism for X-linked loci (Kauer et al. 2002; Reiland et al. 2002; Pascual et al. 2007). As pointed out by Kauer et al. (2002), recessive deleterious mutations are purged more efficiently from the populations when located on the X chromosome. As they are removed more rapidly, there is less chance for recombination to link different neutral alleles with the deleterious mutations. Thus, the background selection model gives a good fit to the observed results since it predicts more neutral variation on the X chromosome than on the autosomes (Aquadro et al. 1994) and could thus explain the higher polymorphism and density of microsatellites located in the sex chromosome without needing to invoke that the effective population size of the X is higher than the expected three fourths of the autosomal effective population size (Vicoso et al.2008).
Homologies between Drosophila species
The comparisons of the locations of the 72 D. subobscura dinucleotide microsatellite loci in the genomes of D. pseudoobscura and D. melanogaster showed high conservation of chromosomal elements, as previously observed with gene markers (Segarra and Aguadé1992; Segarra et al.1996; Papaceit et al. 2006). However, great internal shuffling by para-centric inversions had to occur inside each chromo-somal element during Drosophila species divergence to explain for the great lack of conservation in markers position within each chromosomal element (González et al.2002; Papaceit et al.2006; Drosophila 12 Genomes Consortium2007; Bhutkar et al.2008). With the high level of physical rearrangement encountered in the present study (Fig.3), we observed numerous syntenic breaks, although it would be necessary to localize a higher number of markers on each chromosomal element to detect the evolutionary breakpoints disrupt-ing syntenic segments between species. Though highly reorganized, the wide conservation of homologous chromosomal content between species corroborates the existence of low inter-arm translocations during the evolution of the Drosophila genus. Only two of the 72 microsatellite loci gave indications of translocation between chromosomal arms when comparing D. subobscura and D. melanogaster. In D. subobscura, these two loci (dsub12 and dsub60) are found in
chromosomes O and J, respectively (Table 1 and Fig. 2), and their orthologous elements are presently fused in D. melanogaster, producing the metacentric chromosome 3. Pericentric inversions in the D. melanogaster lineage would explain the exchange in their chromosomal position, as was invoked to explain an exchange of two markers between the fused 2R and 2L arms of D. melanogaster with respect to their location in D. subobscura (Papaceit et al. 2006). However, we cannot assure the occurrence of a pericen-tric inversion in chromosome 3 of D. melanogaster based on our data since in spite of the small expected value, the number of aligned base pairs was rather small, and thus, the locations could be artifactual.
The divergence time differences between D. sub-obscura and the other two species are in agreement with the amount of genetic homologies found between them since greater homologies were detected when comparing D. subobscura with D. pseudoobscura (Ramos-Onsins et al. 1998). Consequently, there is a higher probability for the D. subobscura microsatellite itself to be found in the D. pseudoobscura genome. Given that 88.9% of the D. pseudoobscura ortholo-gous sequences also contained the microsatellite repeat, this would represent a divergence time of approximately 8 Mya if we apply the regression equation and evolutionary rate derived from fish (Carreras-Carbonell et al. 2005, 2008), in accordance to the divergence time estimate given by Ramos-Onsins et al. (1998). Using the same rationale, if we consider that the melanogaster group diverged from the obscura group about 30 Mya as proposed by Throckmorton (1975), no detection of polymorphism would be expected and thus the absence of the repeats. Nevertheless, the microsatellite repeat itself can be functional since the density in microsatellite loci in the distal part of the sex chromosome both in D. subobscura and D. melanogaster (Cuadrado and Jouve 2007b) seems to be convergent and not dependent on their common ancestry. Furthermore, it has been suggested that microsatellite can even serve as regula-tory elements of transcription (Kashi and Soller1999) and have been reported from expressed sequence tags (EST-SSRs; Ellis and Burke2007) and even related to scaffold attachment regions influencing their attaching potential (Lenartowski and Goc 2002). Intronic SSRs can affect gene transcription, mRNA splicing, export to cytoplasm, or induce heterochromatin-mediated-like gene silencing (Li et al. 2004). Approximately half of
224 J. Santos et al.
42
the D. subobscura microsatellites were localized in intronic regions, as inferred from the D. melanogaster annotated genome, and thus, its expansion in repeat number could be submitted to functional constraints.
In summary, with this work, we were able to assign by fluorescent in situ hybridization precise and specific locations to 72 microsatellites in D. subobscura. Greater microsatellite density and non-uniform distribution was observed in the sex chromosome when compared to the autosomes, which could be explained by the greater effect of purifying selection on the sex chromosome, although further assays should be carried out to clarify this issue. Great conservation of the chromosomal element content between Drosophila species was obtained using these non-codifying markers. Neverthe-less, great shuffling within each element is necessary to explain the chromosomal location of these micro-satellites in the assembled chromosomes of both D. pseudoobscura and D. melanogaster. Finally, the localization of these highly polymorphic markers will allow deeper analysis at the population level, inferring genomic recombination rates, tracking the genetic basis of chromosomal inversion adaptation, or disentangling the role of selection and drift in adaptive laboratory evolution among other future studies.
Acknowledgments We thank Francisco Carmona for help in the statistic analyses and Joan Balanyà for help with probes localization. We also thank Montse Papaceit, Lucía Alonso, Jesús Albornoz, and Ana Domínguez for help with preliminary microsatellite localization assays. Josiane Santos has the grant SFRH/BD/28498/2006 from FCT, Portugal. This work was supported by projects CGL2006-13423-C02-02 from the Ministerio de Ciencia y Tecnología (MCYT, Spain) and the EU (FEDER) and SGR2009-636 from the Generalitat de Catalunya (Spain).
References
Adams MA, Celniker SE, Holt RA et al (2000) The genome sequence of Drosophila melanogaster. Science 287:2185– 2195
Aquadro CE, Begun DJ, Kindahl EC (1994) Selection, recombination, and DNA polymorphism in Drosophila. In: Golding B (ed) Non-neutral evolution: theories and molecular data. Chapman and Hall, New York, pp 46–55 Ayala FJ, Serra L, Prevosti A (1989) A grand experiment in evolution: the subobscura colonization of the Americas. Genome 31:246–255
Bachtrog D, Weiss S, Zangerl B, Brem G, Schlötterer C (1999) Distribution of dinucleotide microsatellites in the Drosophila melanogaster genome. Mol Biol Evol 16:602–610
Balanyà J, Oller JM, Huey RB, Gilchrist GW, Serra L (2006) Global genetic change tracks global climate warming in Drosophila subobscura. Science 313:1773–1775 Bauer V, Aquadro CF (1997) Rates of DNA sequence evolution
are not sex-biased in Drosophila melanogaster and D. simulans. Mol Biol Evol 14:1252–1257
Belyaeva ES, Andreyeva EN, Belyakin SN, Volkova EI, Zhimulev IF (2008) Intercalary heterochromatin in polytene chromosomes of Drosophila melanogaster. Chromosoma 117:411–418
Bhutkar A, Schaeffer SW, Russo SM, Xu M, Smith TF, Gelbart WM (2008) Chromosomal rearrangement inferred from comparisons of 12 Drosophila genomes. Genetics 179:1657–1680
Carreras C, Pascual M, Cardona L et al (2006) The genetic structure of the loggerhead sea turtle (Caretta caretta) in the Mediterranean as revealed by nuclear and mitochon-drial DNA and its conservation implications. Conserv Genet 8:761–775
Carreras-Carbonell J, Macpherson E, Pascual M (2004) Isolation and characterization of microsatellite loci in Tripterygion delaisi. Mol Ecol Notes 4:438–439 Carreras-Carbonell J, Macpherson E, Pascual M (2005) Rapid
radiation and cryptic speciation in Mediterranean triplefin blennies (Pisces: Tripterygiidae) combining multiple genes. Mol Phylogenet Evol 37:751–761
Carreras-Carbonell J, Macpherson E, Pascual M (2008) Utility of pairwise mtDNA genetic distances for predicting cross-species amplification and polymorphism success in fishes. Cons Genet 9:181–190
Chang SB, Yang T-J, Datema E et al (2008) FISH mapping and molecular organization of the major repetitive sequences of tomato. Chromosome Res 16:919–933
Cuadrado A, Jouve N (2007a) The nonrandom distribution of long clusters of all possible classes of trinucleotide repeats in barley chromosomes. Chromosome Res 15:711–720 Cuadrado A, Jouve N (2007b) Similarities in the chromosomal
distribution of AG and AC repeats within and between Drosophila, human and barley chromosomes. Cytogenet Genome Res 119:91–99
Di Meo GP, Perucatti A, Floriot S et al (2008) An extended river buffalo (Bubalus bubalis, 2n=50) cytogenetic map: assignment of 68 autosomal loci by FISH-mapping and R-banding and comparison with human chromosomes. Chromosome Res 16:827–837
Dobzhansky T (1950) Genetics of natural populations. XIX. Origin of heterosis through natural selection in populations of Drosophila pseudoobscura. Genetics 35:288–302 Drosophila 12 Genomes Consortium (2007) Evolution of genes and
genomes on the Drosophila phylogeny. Nature 450:203–218 Ellis JR, Burke JM (2007) EST-SSRs as a resource for
population genetic analyses. Heredity 99:125–132 González J, Ranz JM, Ruiz A (2002) Chromosomal elements
evolve at different rates in Drosophila genome. Genetics 161:1137–1154
Gurbich TA, Bachtrog D (2008) Gene content evolution on the X chromosome. Curr Opin Genet Dev 18:493–498 Kashi Y, Soller M (1999) Functional roles of microsatellites
and minisatellites. In: Goldstein DB, Schlotterer C (eds) Microsatellites: evolution and application. Oxford University Press, Oxford, pp 10–23
FISH microsatellite loci 225