UNIVERSIDADE DE LISBOA
FACULDADE DE CIÊNCIAS
DEPARTAMENTO DE BIOLOGIA ANIMAL
SUPERVISED AND UNSUPERVISED SPERMATOZOA
DETECTION, CLASSIFICATION AND TRACKING IN
IMAGING DATA
Pedro Ângelo Pereira da Silva
MESTRADO EM BIOINFORMÁTICA E BIOLOGIA COMPUTACIONAL
Área de especialização em Biologia Computacional
Dissertação orientada por:
Dr. Jorge Albino Cadeias Araújo Carneiro (Instituto Gulbenkian de Ciências)
Dr. Gabriel José Gonçalves Martins (Faculdade de Ciências da Universidade
de Lisboa)
Contents
Contents I
List of Figures II
List of Tables III
List of Abbreviations IV
Acknowledgments V
Resumo VI
Abstract X
1 General introduction 1
2 Automatic classification and quantification of spermatozoa according to acrosomal
reaction 3
2.1 Introduction . . . 3
2.1.1 Human spermatozoa . . . 3
2.1.2 Classification . . . 5
2.2 Objectives . . . 7
2.3 Materials and Methods . . . 8
2.3.1 Imaging data, annotation and classes . . . 8
2.3.2 Detection of spermatozoa . . . 9
2.3.3 Features extraction . . . 10
2.3.4 Classification model validation . . . 10
2.3.5 Detection module tuning . . . 11
2.3.6 Fully automated classification model . . . 11
2.3.7 Data analysis . . . 11
2.4 Results . . . 12
2.4.1 QDA outperforms LDA on the classification of manual detected spermatozoa . . . 12
2.4.2 Automatic detection can provide good features for classification . . . . 13
2.4.3 Detection module impairs fully automated detection and classification . 17 2.5 Discussion . . . 18
2.5.1 Spermatozoa detection . . . 18
2.5.2 Features and classification method . . . 19
2.5.3 Classification: automatic vs manual detection . . . 19
2.5.4 Fully automated classification method . . . 20
2.6 Conclusion . . . 20
3 Model-based spermatozoa detection and tracking in time-lapse imaging data 21 3.1 Introduction . . . 21
3.1.1 Sperm tracking problem . . . 22
3.2 Objectives . . . 22
3.3 Materials and Methods . . . 23
3.3.1 Time-lapse imaging data . . . 23
3.3.2 Spermatozoon model . . . 24
3.3.3 Assessment of spermatozoon model with image data sets . . . 25
3.3.4 Model fitting procedures . . . 25
3.3.5 Image manipulation . . . 28
3.4 Results . . . 28
3.4.1 Detecting while tracking a spermatozoon in image sequences . . . 28
3.4.2 Validation of the model across species . . . 30
3.4.3 Model fitting provides good estimation of flagellar conformations based on head position and orientation . . . 33
3.5 Discussion . . . 36
3.5.1 Tracking flagella . . . 36
3.5.2 Tabled sperm model . . . 36
3.5.3 Dealing with missing information: heads only . . . 37
3.5.4 Future work . . . 37
3.6 Conclusion . . . 38
4 General discussion 39
List of Figures
1.1 Sperm fertilization process . . . 2
2.1 Classification imaging data . . . 8
2.2 Acrosomal reaction class definition . . . 9
2.3 Examples of objects detection . . . 10
2.4 Features used for classification . . . 11
2.5 Two-dimensional QDA of sperm cells detected manually . . . 13
2.6 QDA classification, detection and object efficiencies as a function of c . . . 15
3.1 L. pictusspermatozoon imaging data . . . 23
3.2 L. pictusspermatozoon local and global fittings . . . 29
3.3 L. pictusspermatozoon τ adjustment . . . 30
3.4 L. pictusmodel instances . . . 31
3.5 S. purpuratusspermatozoon imaging data . . . 31
3.6 S. purpuratusspermatozoon local and global fittings . . . 32
3.7 S. purpuratustracking and flagellar estimation . . . 34
3.8 S. purpuratushead only model instances . . . 34
List of Tables
2.1 Classification frequencies of manually detected objects using QDA . . . 12 2.2 Classification frequencies of automatically detected and curated objects using
QDA . . . 16 2.3 Comparing Reacted relative frequencies of fully automated classification method 17
List of Abbreviations
2D two dimensional
3D three dimensional
[Ca2+]
i intracellular concentration of Ca2+
CASA Computed Assisted Sperm Analysis
DAG diacylglycerol
FITC fluorescein isothiocyanate
IP3 inositol 1-4-5-trisphosphate
QDA Quadratic Discriminant Analysis
LDA Linear Discriminant Analysis
PCA Principal Components Analysis
PLC phospholipase C
PSA Pisum sativumlectin
Acknowledgments
To Jorge Carneiro and Gabriel Martins for accepting me as their student and guiding me with all their wisdom.
To Thiago Macêdo, Tiago Guzella, Tom Weber, Danesh Tarapore and Adán Guerrero for all their comments, criticism and help to my work.
This work was only possible with the help of our collaborators in Universidad Nacional Autónoma de México, so thanks to Alberto Darszon and his crew for the imaging data they provided.
To Instituto Gulbenkian de Ciências and Fundação Calouste Gulbenkian for the opportunity of working at such a great and renowned institute.
Special thanks to my parents for all their support and encouragement to keep up my academic studies.
Resumo
A aplicação da matemática na pesquisa em biologia tem vindo a ganhar relevância nas últimas décadas. Vários estudos teóricos e quantitativos têm contribuído para o progresso da biologia celular, da biologia do desenvolvimento e da imunologia. Os modelos matemáticos são particularmente úteis em casos onde a regulação genética afecta as propriedades biofísicas da célula e um exemplo é o estudo da biomecânica e hidrodinâmica dos espermatozóides. No entanto, a inexistência de comparações quantitativas rigorosas entre estes modelos e os dados experimentais torna este processo difícil e enviesado. Isto é devido à comparação maioritariamente qualitativa e visual, onde os parâmetros são mudados até o modelo e os dados serem semelhantes.
As simulações de células contêm toda a informação geométrica dos objectos que descrevem pelo que podem ser rigorosamente comparadas com as imagens e filmes. Por outro lado, a reconstituição de células é dificultada pelos processos de análise de imagens actuais, que têm um fraco desempenho e que necessitam de supervisão humana. Este último ponto torna a análise de grande quantidade de dados difícil e introduz subjectividade e enviesamento na análise. Desta forma, os avanços na biologia celular quantitativa dependem do desenvolvimento de novos métodos automáticos de análise de imagem.
Os sistemas de análise de espermatozóides assistida por computação (CASA) são um bom exemplo onde a bioimagiologia e a sua análise automática foram combinadas com sucesso. Estes sistemas apareceram nos anos 70 e são baseados na análise populacional dos parâmetros de motilidade dos espermatozóides. A sua popularidade advém da sua importância nos sectores médico e económico, uma vez que um em cada seis casais é subfértil e metade dos casos são de origem masculina.
A motilidade espermática é essencial para a fertilização. Na viagem até ao ovo, as células espermáticas têm que nadar numa extensão milhares de vezes o seu comprimento através de uma geometria interna complexa cheia de fluídos altamente viscosos e de células imunes potencialmente hostis. Começando com uma população de centenas de milhões, a grande maioria não chegará às trompas de Falópio e muito menos chegarão ao local onde ocorre a fertilização. Adicionalmente, a capacitação espermática e a reacção acrossómica são dois eventos que ocorrem durante esta viagem que podem ser usados para definir a capacidade de
fertilização, uma vez que também são essenciais para que esta ocorra. A capacitação prepara a membrana do espermatozóide para receber futuras pistas de localização do óvulo enquanto que a reacção acrossómica liberta enzimas para que o espermatozóide possa penetrar na camada protectora do óvulo enquanto também prepara a membrana espermática para a fusão das duas células.
Para além da motilidade espermática, uma abordagem prática para estudar a fertilização tem sido medir a taxa de resposta dos espermatozóides à indução da reacção acrossómica. Actualmente, esta habilidade é medida manualmente em preparações de células espermáticas fixadas e coradas de forma a visualizar o acrossoma, um complexo derivado do Golgi localizado no ápice da célula. Sendo um parâmetro comum e frequentemente usado em pesquisa científica, neste trabalho desenvolvemos um processo automático de classificar os espermatozóides de acordo a reacção acrossómica.
O nosso classificador baseia-se na análise de discriminantes, um método que define funções de fronteira entre duas ou mais classes, de acordo com os factores providenciados. Definimos duas classes: Capacitadas, que são células que sofreram capacitação mas que ainda não passaram por nenhum estado de reacção acrossómica, e Reagidas, que já reagiram ou que ainda estão a reagir. Como características escolhemos a intensidade média de sete sub-áreas da cabeça do espermatozóide, dispostas ao longo do seu eixo maior. Primeiro testámos se a Análise de Discriminantes Lineares (LDA) e Análise de Discriminantes Quadráticos (QDA) seriam aceitáveis para classificar este tipo de reacção em células detectadas manualmente. A classificação por QDA teve resultados melhores do que a por LDA, classificando correctamente 98.0% das células, tendo sido seleccionado como modelo de classificação.
Tendo em vista uma verdadeira automatização, testámos o mesmo método com células detectadas por segmentação automática da imagem, onde estimámos os parâmetros do módulo de detecção (filtragem de objectos) e classificámos correctamente 94.7% dos objectos que correspondiam a um e apenas um espermatozóide cuja classe era conhecida. No entanto, o processo automático classifica todos os objectos detectados resultando numa classificação todos esses objectos obtivemos um erro de 28.1% na frequência relativa de espermatozóides Reagidos, que é uma diferença significativa. Este erro é maioritariamente devido aos espermatozóides anotados manualmente cuja classe era dúbia, pelo que não foram atribuídos a nenhuma classe. É razoável assumir que todos os espermatozóides dúbios sejam na verdade células que começaram recentemente a reagir e que deverão pertencer à classe Reagidos. Desta forma o erro na frequência de Reagidos obtido é de apenas -2.4%. A eficiência na classificação dos objectos detectados automaticamente cujas classes eram conhecidas e o facto de o classificador ter classificado as dúbias como Reagidas apoia esta hipótese. Provavelmente, é necessário treinar o modelo de classificação com dados anotados por um especialista na área da reacção acrossómica para poder generalizar o nosso modelo correctamente. É ainda de
salientar que, pelo nosso processo, detectámos apenas 49.0% das células, uma vez que muitas detecções tratavam-se de facto de agregados celulares. Este agregados foram filtrados antes da classificação pois iriam enviesar a classificação. Para evitar este problema, propomos o uso de preparações com menos densidade celular, diminuindo o número e tamanho das agregações e permitindo melhor detecção e resultados mais fiáveis.
A maioria dos métodos actuais de detecção de espermatozóides (i.e. incluindo o nosso) sofrem do mesmo problema: resolver as células quando estão agregadas. Com o intuito de ultrapassar as suas limitações, desenvolvemos um novo algoritmo de detecção. O nosso método visa tirar partido da informação do espermatozóide, como conhecimento a priori, e da informação contida em imagens de série temporal, podendo ser também aplicado em imagens isoladas, como demonstramos. A ideia base é aplicar uma função que descreva a forma e movimento do espermatozóide ao longo do tempo à célula na imagem, estimando os parâmetros dessa função através da posição e forma de potenciais objectos nessas imagens. Se o melhor ajuste da função for bom, é muito provável que um espermatozóide se encontra nas posições e com as formas modeladas.
Devido à complexidade em desenvolver, ajustar e validar um modelo baseado em equações diferenciais, neste trabalho tabelámos a posição, rotação e conformação flagelar dum espermatozóide de ouriço-do-mar da espécie Lytechinus pictus. Para validar o nosso método, tentámos detectar o espermatozóide tabelado usando apenas uma imagem (i.e. ajuste local) e ainda rastreá-lo ao longo do tempo (i.e. ajuste global). Tanto a detecção como o rastreamento foram eficazes. Para generalizar este modelo, usámos um filme de um espermatozóide de Strongylocentrotus purpuratus (i.e. outro ouriço-do-mar) e conseguimos detectar e rastrear essa mesma célula, tendo havido apenas uma pequena acumulação de erro nos últimos tempos de amostragem que poderá ser devido à diferença inter-espécie ou a este espermatozóide não ter uma dinâmica estacionária (i.e. a nadar em círculos com a frequência flagelar constante). Podemos iterar o processo global em todas as imagens e seleccionar as instâncias do modelo correspondentes ao mesmo espermatozóides, ou seja, a mesma célula mas fitado localmente em imagens/tempos diferentes, de forma a obter o melhor modelo do espermatozóide nesse filme. Este processo de ajuste local pode ser usado em imagens isoladas (i.e. independência espacial) e, consequentemente, para detectar os espermatozóides humanos usados na classificação, desde que o espermatozóide tabelado seja ajustado.
Uma questão interessante é se o nosso modelo consegue aumentar a resolução temporal e espacial da microscopia. Analisando uma sub-amostra temporal conseguimos detectar e rastrear a célula correctamente, tendo o nosso modelo sido coerente com os tempos de amostragem não usados para ajustar os parâmetros. De modo semelhante, conseguimos ainda obter boas estimativas da posição do flagelo em imagens onde apenas a informação da cabeça estava disponível (i.e. os flagelos não eram visíveis). No entanto, das várias instâncias do
modelo referentes a esse espermatozóide, não conseguimos escolher a que mais se aproximava à célula, pelo que é necessário um método de selecção diferente que inclua mais informação. Os métodos desenvolvidos podem ser integrados em modelos morfodinâmicos, onde forma, mecânica e sinalização são combinados, e revolucionar os sistemas CASA, que estão até à data por integrar motilidade e processos bioquímicos.
Palavras-chave: automação; capacitação; classificação; detecção; espermatozóide; rastreamento; reacção acrossómica;
Abstract
Recent advances in microscopy, by allowing to visualize cells and tissues in their natural physiological context, expanded the research possibilities to unprecedented domains. However, progress is hindered by the virtual absence of automatic image analysis methods that extract quantitative information from images. At best, image analysis is based on semi-automatic methods that require human supervision which is subjective and biased. This is how spermatozoa research stands at the moment and here we address three major computational issues in sperm imaging research: classification, detection and tracking.
Sperm capacitation, acrosomal reaction and motility play an important role in fertility, which is a subject of growing medical and economic importance. In sperm research, acrosomal reaction is commonly measured by image analysis but, since no automatic classifier exists, it is performed manually. We developed and compared a method based on Discriminant Analysis capable of distinguishing capacitated cells which have not undergone acrosomal reaction from cells which are reacting or have reacted with over 94% of efficiency. The major difficulty encountered was automatic spermatozoa detection and a method to detect and track was devised - detect while tracking. This method uses a model of a sperm cell as a priori knowledge and can define well the sperm flagella position. We showed it can also predict sperm cells and their flagella at higher temporal resolution than the image sequence under study. It also has the potential to estimate flagellar conformations when only the sperm head positions are available but more sources of information are required in order to get the right conformation. Our methods modules can be easily adapted to any experimental setting (i.e. different labelling or sperm cell model) and the methods themselves can be combined to each other or to other available methods in order to facilitate sperm research.
Keywords: acrosomal reaction; automation; capacitation; classification; detection; spermatozoa; tracking;
Chapter 1
General introduction
The last decades witnessed a growing impact of mathematical approaches in biological research that is epitomized in the claim that "Mathematics is biology’s next microscope, only better" (Cohen, 2004). Theoretical and quantitative insights have been achieved in many fields of biology, notably in cell and developmental biology and immunology (Carneiro et al., 2007). Mathematical models proved particularly useful when genetic regulation met the biophysical realm and theoretical insights into the biomechanics and hydrodynamics of spermatozoa are excellent examples of this (Böhmer et al., 2005, Cosson et al., 2003, Crenshaw, 1989, Friedrich et al., 2010). This progress notwithstanding, the lack of rigorous quantitative comparison with experimental data is a transversal difficulty of mathematical biology. Regarding cell or tissue modelling, comparison is often qualitative and visual: parameters are tuned until model results and experimental data look similar. This was even compared to painting (Cartwright et al., 2008).
Cell simulations contain all the geometric information regarding the objects they describe and could be rigorously compared to images and films. However, image based reconstitution of cells is made difficult by the limitations of current image analysis methods. Image analysis and reconstitution algorithms have poor performance and require painstaking supervision by humans. This need for human intervention precludes objective large scale analysis of data, and introduces subjective biases. Therefore, the advances in quantitative cell biology expected from real time imaging of cells are currently dependent on the invention of good automated image analysis algorithms (Goldberg et al., 2005). Without such computational breakthroughs, sub-utilized image data accumulate, and the views they bring on biological processes remain partial.
Computed Assisted Sperm Analysis (CASA) systems are an example where imaging and its automated analysis were successfully combined (Amann and Katz, 2004). These systems first appeared in the 1970s and are based on population analysis of sperm motility parameters. Their rise in popularity comes from human fertility medical and economic importance, as
Figure 1.1: Sperm fertilization process. The spermatozoon must pass through several checkpoints (numbered) before being able to reach and fertilize the ovule. PVS - periviteline space, ZP - zona pellucida.
approximately one in every six couples is subfertile (Gaffney et al., 2011) and male factors account for around half of the cases (Barratt et al., 2009).
Sperm motility is essential for fertilization. In their journey towards the egg, sperm cells must swim a path thousands of times their own body length through the complex geometry of the female tract, often filled with highly viscous and potentially hostile immune cells. Starting with a population over hundreds of millions, the overwhelming majority do not even reach the fallopian tubes and only a few get to the site of fertilization (Gaffney et al., 2011). In addition to motility, the ability of a sperm cell to succeed in fusing with the egg depends on other essential processes like capacitation (Austin, 1951) and acrosomal reaction (Ikawa et al., 2010) (fig. 1.1). Capacitation prepares the sperm to receive the female gamete positional cues while the acrosomal reaction allows for the sperm to reach and penetrate the egg membrane (see section 2.1.1 for further detail).
A practical approach to analyse fertility, complementary to sperm motility characterization, consists in measuring the ability of spermatozoa to undergo acrosomal reaction (Li et al., 2010). Several methods based on specific staining with fluorescent dyes or probes have been proposed that allow a person to identify the acrosomal status of sperm cells based on their staining pattern (Cross and Meizel, 1989, Saling and Storey, 1979). Since there are no computational tools available to automatically identify and classify these staining patterns, the quantification of the acrosomal reaction is done by painstaking visual annotation. Being such an important and common parameter in fertilization studies, an automatic classification method is highly desired
and this thesis proposes a new method based on discriminant analysis (see chapter 2). As we will demonstrate, this method has an excellent performance under normal imaging conditions, but its practical implementation is curtailed by the modest performance of sperm head detection algorithms.
With the aim of overcoming the limitations of spermatozoon detection algorithms, we developed a novel method for detection of both the head and flagellum (see chapter 3). We specially designed the algorithm to take advantage of the complete information present in time-lapse imaging data but, as we will show, it can also detect complete spermatozoa in single images. An important feature of our method is the ability to estimate, even if with some error, the flagellum conformation and position having only information on the position of the head.
Chapter 2
Automatic classification and quantification
of spermatozoa according to acrosomal
reaction
2.1
Introduction
2.1.1
Human spermatozoa
Capacitation
Mammalian sperm must spend some time in the female reproductive tract before they acquire the ability to fertilize eggs (Austin, 1951). This acquisition of fertilization capability is called sperm capacitation (Austin, 1951) and its discovery made mammalian fertilization in vitro possible. Sperm cells are stored in the oviduct (i.e. isthmus) epithelium in an environment that stabilizes sperm for a period of hours and delays capacitation (Dobrinski et al., 1997). The modifications needed for capacitation to occur create a more fluid sperm membrane environment, making it competent for subsequent fertilization cues (Ikawa et al., 2010). After capacitation, spermatozoa display hyperactivated movement and asymmetrical flagellum beating that is thought to assist sperm escaping from the oviduct epithelium. This gradual release of sperm from the isthmus helps to avoid polyspermy as the number of sperm available at the point of fertilization is reduced, suggesting that the isthmic portion of the female reproductive tract regulates the number of fertilization-competent sperm that reach the egg in vivo(Ikawa et al., 2010).
Acrosomal reaction
The acrosome is a Golgi-derived exocytotic organelle that covers the tip of the sperm head (Ikawa et al., 2010). Acrosomal exocytosis is essential for a sperm cell to fuse with an egg that happens only in capacitated sperm. Also known as acrosomal reaction, it comprehends the exocytosis of hydrolytic enzymes for penetration of sperm into the ovule protective layers (Ikawa et al., 2010, Li et al., 2010). Experiments in mouse show sperm cells are already undergoing acrosomal reaction when passing through cumulus layers and have reacted before reaching the zona pellucida. Progesterone secreted from human cumulus cells is reported to induce the acrosomal reaction. These evidences suggest the acrosomal reaction is induced by cumulus cells (Ikawa et al., 2010).
The mechanism of the acrosomal reaction starts with transient calcium influx which leads to activation of phospholipase C (PLC). Activated PLC generates inositol 1-4-5-trisphosphate (IP3) and diacylglycerol (DAG) from phosphatidylinositol 4,5-bisphosphate, IP3 releases intracellular calcium and DAG mediates activation of protein kinase C and phosphorylation of substrate proteins. This cascade promotes a calcium influx via transient receptor potential cation channels, which induces the complete acrosomal reaction (Fukami et al., 2001). The acrosomal reaction is not a instant process but one with several stages, having some acrosomal components released in seconds and others which are gradually released (Ikawa et al., 2010).
Computed Assisted Sperm Analysis systems
There are numerous CASA systems that measure relevant aspects of sperm motility. Despite their widespread use in medical and veterinary fertilization diagnosis, these systems did not contribute substantially to unravel a causal link between biochemical changes in sperm and detectable changes in sperm motility (Amann and Katz, 2004). The development of commercial in vitro fertilization companies also helped to decrease these systems popularity and usage on fundamental sperm research. Furthermore, current CASA systems are also limited by not incorporating methods to quantify key processes such as acrosomal reaction.
Lacking such tools, Li et al. (2010) studied the effect of cystic fibrosis transmembrane conductance regulator on male fertility by manually comparing the changes of acrosome-reacted sperm ratio under several conditions. This kind acrosomal staining with e.g. chlortetracycline (Saling and Storey, 1979) is a standard procedure on sperm research (Li et al., 2010, Garzon-Perez et al., 2010, El-Sisy et al., 2010). Thus, an unbiased, reproducible, fast and automated method for characterizing sperm cells according to their staining or marker is required.
2.1.2
Classification
Automatic classification is a typical problem of machine learning. Machine learning methods fall into two categories, supervised and unsupervised. Algorithms of the first category need to learn the classes characteristics by analysing sample objects that are previously annotated and classified. Then, they use the information gained to analyse and classify the target sample. In contrast, methods of the second category analyse the target sample in an unbiased way without any prior information. The major advantages of unsupervised classification methods is that they can be used to associate or compare the input variables of the sample or to explore the structure of the data and recognize a posteriori a classification. The supervised ones output a categorical result based on the input and according to the objects from which their parameters were estimated (Hastie et al., 2009).
The basis for classifying several objects is to define the features (i.e. object characteristics) and give a name (i.e. class) to the ones with similar features. At this point, two problems arise: (1) which features shall we use and (2) what it means to be similar. The solutions will depend on the problem at hand, of course, but many times they are not clear. While it seems very straightforward to choose the feature shape and define similar as having the same number of vertexes to distinguish between a circle, a triangle and square, choosing the same features and similar definition will not distinguish a rectangle from a diamond or a square.
Much effort has been used to answer question (2) and many methods were and are still being developed, e.g. k-nearest neighbours, discriminant analysis, neural networks, support vector machines and many, many more. They are mathematical and statistical models that aim at receiving several features of the objects as inputs and output the class of that object, as well as a selection of features that allow for efficient classification. This means they define boundaries on the feature (hyper-)space and the sample (i.e. a point on that space) will be classified according to which class area it belongs. Most of these methods differ on how classes boundaries are established (Hastie et al., 2009).
PCA
Principal Components Analysis (PCA) is an example of a classic unsupervised method for multivariate data analysis, which finds a new orthogonal axes system, ordered by decreasing variance of the data (Hastie et al., 2009). For this reason, this method is also useful for dimension reduction as the new first reference axes (i.e. principal components) may be enough to explain the data with virtually no loss of information. For example, imagine you have a ball closely behind another bigger ball. From where you stand you cannot see the smaller ball but if you move left or right you will start to see the smaller ball until you cannot see any ball overlapping the other. PCA does this in a n-dimensional hyper-space.
Mathematically, this method calculates the eigenvectors of the sample covariance matrix and orders them according to their respective eigenvalues. Although it cannot be used to classify per se, this method can be used in classification, where the sample is rotated to match the principal components and the border function is manually or automatically defined (i.e. by a different method). New samples can then be rotated by the same matrix and classified by the same border function.
Discriminant analysis
Discriminant analysis is a supervised method with many actual applications that is also a classic multivariate statistical analysis method (Lamb and Niederberger, 1993). This technique searches for a projection where observations from the same class are clustered together while the distance between classes is maximized, defines decision boundaries based on probabilities and gives information on which features contribute more for the classification (Alegre et al., 2009).
For optimal classification, decision theory for classification tells us that we need to know the class posteriors P (G|X) (i.e. probability of being class G given features X) (Hastie et al., 2009). If we suppose that fk(x) is the class-conditional density of X in class G = k, and that
πkis the prior probability of class k, with ΣKk=1πk = 1, an application of Bayes theorem gives
us P (G = k|X = x) = fk(x)πx K X l=1 fl(x)πl (2.1)
The object will be labelled as the class for which P (G|X) is higher.
Discriminant analysis appears in many flavours depending on this model for the probability density in each class. Linear Discriminant Analysis (LDA) and Quadratic Discriminant Analysis (QDA) assume Gaussian densities, however, they differ in assuming that classes are homo- or heteroscedastic (i.e. classes have or have not the same covariance matrix), respectively. This way, the decision boundary between each pair of classes will be a linear or quadratic equation, respectively. Because the parameters of the assumed Gaussian (i.e. mean and standard deviation) and the prior probability are not known, we need to estimate them from the training set. As such, the decision boundaries are determined by the covariance matrix of the classes distributions and the classes centroids, to define where e.g. P (G = k1|X = xk1) =
Assessment, training and validation of a classification model
A major disadvantage of unsupervised methods is that they do not output a class per se even if they can be defined a posteriori (Hastie et al., 2009). Supervised learning methods, however, output a probable class for the object which can be compared to the object real class. This way it is possible to assess the efficiency of the method and even validate it. This efficiency can be measured by the frequency of true positives, which is the frequency of the total number of cells that were classified in the correct class relative to all cells. One can also measure the true positive frequency of each class. To validate a classification model, the sample is usually divided in three parts:
1. Training set: this is the "teaching" material the classifier will learn so the best classification with this data is achieved and where the model parameters will be optimized. Depending on the learning methods, if it is too specific (i.e. low variance) it may not classify a sample that is significantly different from what it "learned" correctly, opposed to if it is too loose (i.e. high variance) it may easily misclassify the object;
2. Validation set: this is the "exam" material to choose between different models;
3. Testing set: this is the "final exam" for the classification model chosen. You only have one attempt at this one and, if it fails, your model is unable to generalize the information within the training set to another data set. You will need to re-evaluate whether your training set was representative or large enough. Alternatively, you may need to rethink the classification learning model, either adapting the current one or starting another one from scratch;
It is important to randomly separate the sample into these sets so validation and testing remain unbiased.
When the sample is too small to split in this way it is still possible to validate the classifier through another method, the k-fold cross-validation method (Hastie et al., 2009). This method randomly divides the sample into k sets and uses a combination of k − 1 sets to train the algorithm and the remainder set to validate. The model efficiency is the mean efficiency of all possible combinations. The widely used leave-one-out validation method arises when k is equal to the sample size but k ∈ {5, 10} is usually practiced (Hastie et al., 2009).
2.2
Objectives
Envisaging to ultimately improve CASA systems, we will develop an automatic method to classify sperm cells according to their staining pattern. Specifically, we are going to focus on the problem of classifying and quantifying imaged spermatozoa according to the status of
the acrosome, given the importance of acrosomal reaction assays in sperm cell physiology and fertilization studies (see section 2.1.1).
We will use imaging data provided by collaborators and develop the automatic classification algorithm in C/C++. Eventually, the classification method will be endowed with a simple graphical user interface and made available to the scientific community.
2.3
Materials and Methods
2.3.1
Imaging data, annotation and classes
The acrosomal reaction imaging data (fig. 2.1) was obtained with the methodology detailed in Suhaiman et al. (2010). Briefly, highly motile spermatozoa were obtained from healthy donors and then were incubated in capacitating conditions. Cells were treated with inhibitors or stimulants immediately after capacitation, permeabelized in ice-cold methanol and fixed to slides. The preparation was then stained with Pisum sativum lectin (PSA) coupled to fluorescein isothiocyanate (FITC). This lectin binds to different glucosides residues that are particularly abundant in the acrosome membrane, e.g. glucose and mannose.
The acquisition of the images was done with a ZEISS microscope with a 63x/1.4NA oil immersion lens and the exposure time was 600 ms. Images were stored in a 8-bit format. Notice the great variability of the imaging data in terms of background noise, saturation, contrast and sperm density, clustering and acrosomal reaction stage (fig. 2.1). This variability in the imaging conditions will be instrumental to assess the capacity of the classification algorithm to generalize the information on the training sets.
Figure 2.1: Sample imaging data used to training and test our classification algorithm. Note the heterogeneity on image contrast, saturation and background noise and on cell labelling, clustering and density.
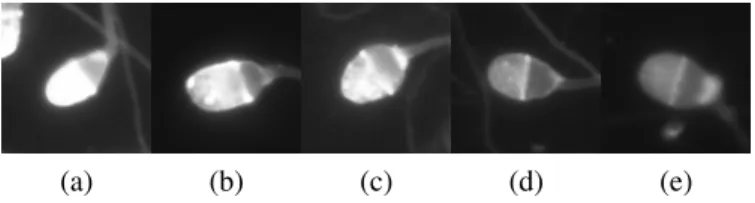
(a) (b) (c) (d) (e)
Figure 2.2: Different stages of acrosomal reaction of different human spermatozoa, where reaction occurs from left to right: a) capacitated, b-d) reacting and e) reacted. Cell in a) is an example of class Capacitated, which have not undergone any stage of acrosomal reaction, and b) through e) are examples of several possible stages of acrosomal reaction, which are annotated as Reacted.
The imaging data was partitioned into three independent sets of manually annotated sperm cells: one with 195 cells, other with 440 cells and another with 314 cells. Each set has sperm cells from different images but no two cells of different sets belong to the same image.
In this thesis, and for classification purposes, cells which have not undergone any stage of acrosomal reaction define the Capacitated class while capacitated cells which are undergoing or had undergone acrosomal reaction define the Reacted class (fig. 2.2). It is possible to see the high concentration of labelling dye on the spermatozoon tip on capacitated cells getting dimmer as acrosomal reaction takes place. It is based on this difference that we will distinguish the two classes. The referred sets also have spermatozoa of unknown class, which are a sub-set of the Extra class (see the following section for more details on this special class). We will refer to classes with a capital first letter, while the biological process will be referred normally.
2.3.2
Detection of spermatozoa
The detection of spermatozoa was done by selecting the sperm cells’ areas and discarding the remaining background area either by manual or automatic segmentation. Then, objects were extracted by finding contours of pixels (px) with intensity above zero and fitting ellipses by least-squares to each object detected. These fitted ellipses will be referred as objects from now on, opposed to the imaged sperm cell they derive from.
Manual segmentation was done by selecting the sperm cells areas and discarding the remaining background area (i.e. setting pixel intensity to zero). This will be referred as manual detection, opposed to manual annotation, which refers to the spermatozoa and not the objects.
The following segmentation algorithm was used to automatically detect the spermatozoa heads in the image. To distinguish fore- and background we check if all neighbouring pixels of a target pixel are above a threshold value and maintain that pixel if they are or set to zero if not. Then, to select clusters of pixels, every pixel which has no neighbouring pixels above zero is also set to zero. In detail, for each pixel p on coordinates x, y of image I: if any pixel in matrix Ix−r:x+r,y−r:y+rhas intensity below meanI− c ∗ sdI, set pixel p intensity to zero; where r is the
Figure 2.3: Examples of objects detection (thick green ellipses). From left to right: spermatozoon, debris and two clusters of cells. The last two kind of objects must be discarded in order to classify efficiently. Thin green lines delimiter the object features (see following section).
and sdI is the standard deviation of image I pixel intensities. Subsequently, every isolated
non-zero pixel (i.e. pixel with intensity above zero with all neighbouring pixels with intensity equal to zero) was set to zero. Then, objects and their corresponding features were obtained as described in section 2.3.3.
At this point one should note that the ellipse-shaped objects detected may be either a single spermatozoon, a cluster of several spermatozoa or debris (fig. 2.3). To avoid inappropriate parameter feeding to the classification module, low and high area threshold values were used when mentioned to preferentially select ’single spermatozoon’ objects. The spermatozoon detected may also be either Capacitated, Reacted or with unknown class. Also consider that some objects detected can and will be sperm cells that were not annotated. These unannotated sperm, clusters, debris and unknown class are considered as a third special class named Extra, which is not included in the training sets or in the curated sets.
2.3.3
Features extraction
The features used for classification were the FITC mean intensity of seven independent areas of the object ellipse. These areas were defined by cutting the ellipse in seven sections with identical length along its major axis (fig. 2.4a). The ordered set of features, from flagellum to tip, is the object profile.
Because we are only detecting the heads and spermatozoon head polarity is the basis of this classification, the objects profile must be correctly aligned according to the flagellum and our detection process does not provide cellular orientation. To ensure every profile was its features in ascending order, we inverted each profile if its first half mean was higher than the second half (i.e. changed all objects with feature order #7-#1 to #1-#7). Unordered Capacitated profiles have higher tip intensity and were be inverted, as the decrease in features #1-3 suggest (fig. 2.4b and 2.4c). Note that unordered reacted sperm (note we are referring to the process) may not have their profile inverted as their tip might not be brighter than the flagellar side. This should not pose a major problem because the classification method is based on the sperm head halves
(a) (b) (c)
Figure 2.4: Features used for classification. a) Sample object detected on spermatozoon head (thick green line), with each feature area defined by thin green lines (only the area inside the ellipse is taken into account); numbers represent feature order used for classification. b) and c) Objects profiles before and after inversion, respectively; plots represent the values distribution of each feature in box-and-whiskers charts, where open circles represent outliers.
intensities and both of them should be low for reacted cells.
2.3.4
Classification model validation
The training and validation sets for classification model validation were obtained by 5-fold cross-validation method on the 195 cells set segmented by hand, which ellipses and profiles were then computed as previously described. In all cross-validations, the training set was randomly partitioned to be identically distributed.
2.3.5
Detection module tuning
A training set with 440 manually annotated cells was used to estimate c and low and high area threshold values by trying to maximize classification efficiency (i.e. true positives percentage) and the number of objects that correspond to one and only one spermatozoon. Area threshold values were optimized by consecutive bisection. To avoid over-fitting these values to the data, we performed 5-fold cross-validation instead of maximizing the training set self-classification. Objects corresponding to none or more than one spermatozoon or which classes were unknown were discarded in both training and validation sets (curated set).
2.3.6
Fully automated classification model
To assess how the automatic features would affect the classification we used the detection parameters estimated as referred above (c = 1.05, 800px2 < area < 2000px2) to train QDA using the 440 cells set after curating the objects detected in both the training and the 314 cells
testing sets. We then tested the classification model using the same training set but using all objects detected in the testing set, including clusters of cells, debris, non-classified cells and cells missed by manual annotation (uncurated set).
2.3.7
Data analysis
All data analysis was done using R (R Foundation for Statistical Computing, Vienna, Austria). Scripts were developed to automatically deal with the considerable amount of data produced in each simulation.
Except when noted, to automatically compare to the classification results, all statistics were done by manually mapping and classifying all sperm cells in several independent images and automatically labelling the object class as the spermatozoon class which center is contained in that object area, only if that object contains one and only one spermatozoon center.
2.3.8
Image manipulation
All the algorithms for image manipulation were developed and encoded in C/C++ using the free computer vision library OpenCV 2 (Intel, Santa Clara, United States of America).
2.4
Results
2.4.1
QDA outperforms LDA on the classification of manual detected
spermatozoa
In order to select the best classification model we validated either LDA or QDA on 195 manually segmented cells, on which ellipses were fixed and their profiles were obtained. Since the data size was small we adopted the 5-fold cross-validation strategy, which means that in each validation round we had 156 cells in the training set and 39 cells in the validation set. In table 2.1 it is possible to compare LDA and QDA classification efficiencies when using all features and it is clear that the later performed significantly better, having high true positives percentage for both classes. We asked if only two features were enough to achieve good classification, as this would reduce the feature space and would produce an intuitive graphical output. Our results show that this method can successfully distinguish both classes by using features #3 and #5 only (i.e. these features are expected to and do contribute most to the classification), not being able to resolve only three out of 195 cells (fig. 2.5). On the other hand, the 5-fold cross-validation using this couple of features does not yield good results as 10,3% of cells were misclassified in both training and testing sets, a result worse than that achieved by LDA with all features.
Table 2.1: Classification frequencies of manually detected objects using LDA and QDA. Percentages refer to 5-fold cross-validation of 95 Capacitated cells and 100 Reacted cells.
LDA QDA
Capacitated Reacted Capacitated Reacted
Training true positives 100,0% 87,8% 99,5% 98,5%
Validation true positives 100,0% 85,0% 97,9% 98,0%
We conclude that QDA of the data with seven features, with a percentage of true positives above 98%, is more adequate for acrosomal reaction classification.
A fully automated classification algorithm must include the detection of the spermatozoa head to be fed to the classification module. We explore this detection module in the next section.
2.4.2
Automatic detection can provide good features for classification
The automatic detection module will feed the classification module with profiles to be analysed and we must ensure these are adequate and do not impair the classification efficiency. First, we need to estimate the detection module parameters and we used the 440 cells training set while varying the referred parameters. After detection, each object and their respective features were obtained and the coupled performance of detection and classification was determined by
Figure 2.5: Two-dimensional QDA of 95 Capacitated and 100 Reacted spermatozoa manually detected using only features #3 (F3, a.u) and #5 (F5, a.u.). Plot represents the training set distribution, classified according to how they ’trained’ the QDA method. Dark blue and orange dots represent the Capacitated or Reacted data points, respectively. Black dots represent the class means. Light blue and yellow regions represent the partition of the space by QDA into Capacitated and Reacted classes, respectively. Numbered red arrows point to the respective misclassified numbered cells shown on the plot’s right.
measuring the following criteria as a function of the automatic detection parameters (fig. 2.6):
• Detection efficiency = P1
S × 100 : percentage of spermatozoa correctly detected in the
images (uncurated);
• Object efficiency = P1
P × 100 : percentage of objects detected that correspond to one and
only one spermatozoon;
• True positives percentage of each class: classification accuracy assessment - to avoid classification over-fitting, 5-fold cross-validation was performed;
where Pi is the total number of objects that correspond to i and only i spermatozoa, P is the
total number of objects detected and S is the total number of spermatozoa in the images. One critical aspect of automatic detection and classification of objects is that every detected object will be inevitably assigned to one of two classes. Therefore, one must ensure that the detection algorithm finds objects that correspond to one and only one spermatozoon, i.e. to maximize object efficiency. The detection algorithm must also find as many true spermatozoa in the images as possible, as this will provide larger training and validation data sets for learning and also will provide more accurate estimates of the class frequencies.
The detection algorithm has three parameters: the quantile for background subtraction c and the lower and higher cut-offs of the accepted area of a spermatozoon’s head [aL, aH]. Clearly,
for each of these parameters there is an optimum. Outside the optimum we will accept debris and clusters of cells. The above mentioned variability in the appearance of the sperm cells in the images, however, creates a problem since if we are too restrictive on the area definition or background subtraction we may and will loose true spermatozoa. But these are simply generic problems of any object segmentation. Here we will also have the problem that the automatically detected objects might be inappropriate for generating the features. For example, the ellipse of a detected object might be larger, smaller or misoriented as compared to the sperm cell it delineates. Under this scenario, even if it detects one and only one sperm cell, it might give rise to values of the seven features that are inadequate. For the sake of the argument, consider the Capacitated spermatozoon in fig. 2.4a. If the detected object would be an ellipse with the major axis twice that of the one represented (which could be obtained if one chooses a value of c that would not eliminate the visible flagellum) then this objected would give rise to features with profile typical of a Reacted spermatozoon.
Thus, the automatic detection may produce features that are inadequate. In this section we explore the parameters of the detection algorithm, aiming to understand how they affect the overall performance. The upshot is that the proposed detection algorithm can generate adequate classification features. provided that the 5-fold cross-validation is performed on objects curated after automatic detection.
We first explored the automatic segmentation algorithm without constraining the areas, i.e. by varying only c (fig. 2.6a). Under these conditions the segmentation per se demonstrated low detection and object efficiencies since only ∼60% of total spermatozoa in the sample were found and only ∼50% of the detected objects were true spermatozoa. Once these objected were used for learning they generated bad features. Hence, by restricting the cross-validation
c
(a) 0px2≤ area (b) 200px2> area
c
(c) area < 2500px2 (d) 800px2< area < 2000px2
Figure 2.6: QDA classification, detection and object efficiencies as a function of c. Green and light blue are classification with 5-fold cross-validation true positives for training (dashed line) and validation (line) for Capacitated and Reacted classes, respectively; dark blue and red lines are for detection and object efficiency, respectively. Number of spermatozoa = 440.
Table 2.2: Classification frequencies of automatically detected and curated objects (c = 1.05, 800px2 < area < 2000px2) using QDA. Percentages are relative to each row total, except for Total column, which is relative to total curated objects. Detection efficiency = 49,0%.
Objects
Capacitated Reacted Total
Spermatozoa Capacitated 59 (90.8%) 6 (09.2%) 65 (52.4%)
Reacted 1 (01.7%) 58 (98.3%) 59 (47.6%)
Total 60 (48.4%) 64 (51,6%) 124
to curated objects (within which the object efficiency is 100%) the percentage of true positive Capacitated and Reacted objects was still below 90%.
By selecting detected objects with areas greater than aL = 200px2, noise and debris were
filtered out, improving the object efficiency but the detection efficiency and classification performance remained the same (fig. 2.6b). By putting only an upper-bound to the acceptable area on aH = 2500px2 to reduce the number of detected objects corresponding to cell clusters
increasing (even if marginally) the object efficiency (fig. 2.6c, data not shown). Most detected objects are now single cells (and debris) and the frequency of Reacted true positives raised to more than 90% for some c values around 1.00. On the other hand, the detection efficiency maximum lowered from ∼60% to ∼50%.
We explored the lower and upper bounds of the detected objects area. For 800px2 < area < 2000px2 and c = 1.05, Capacitated and Reacted true positives and object efficiency are over
90% and close to ∼95% (fig. 2.6d). Notice that we cannot rule out that these parameters are over-fitted. With this cautionary not in mind, we tested how the classification would perform on images independent of the training set. Thus we trained the QDA with 147 automatically detected and curated objects and tested it with an independent test set of 124 automatically detected and curated objects. The overall frequency of correctly classified spermatozoa was good, Reacted true positive rate above 98% and Capacitated true positive rate above 90% (Table 2.2.
In conclusion, the automatic detection module can feed the classification module with appropriate profiles which ensure good classification. In the next section we investigate how the fully automated classification model, with both detection and classification modules, performs.
Table 2.3: Comparing Reacted relative frequencies of fully automated classification method. Reacted absolute and relative frequencies of manually annotated spermatozoa and automatically detected and classified objects (c = 1.05, 800px2 < area < 2000px2) using QDA.
Relative frequency
Training set Testing set
Sperm Curated Sperm Sperm Curated objects Uncurated objects
Reacted 43.5% 40.8% 43.1% 51.6% 55.2%
Absolute frequency
Training set Testing set
Sperm Curated Sperm Sperm Curated objects Uncurated objects
Capacitated 192 87 136 60 60
Reacted 148 60 103 64 64
Extra - - - - 21∗
∗Thirteen objects correspond to spermatozoa of unknown class and the remainder eight correspond to unfiltered clusters and debris and to miss-annotated cells.
2.4.3
Detection
module
impairs
fully
automated
detection
and
classification
In the previous section we assessed the efficiency of the detection and classification by restricting the training and testing of the QDA to curated objects, ensuring that all objects were in fact spermatozoa. In a real situation this condition cannot be guaranteed. We then tested our method on the uncurated data set, i.e. we used the same detection parameters as before but this time we did not discard the objects which did not represented one and only one sperm cell. Because we do not known the classes of the unknown sperm cells and cannot annotate the class of an objects corresponding to clustered spermatozoa or debris, a different method to assess the performance of our model must be defined.
The performance metric we used is inspired in the actual acrosomal reaction assay (see section 2.1.1). In this assay we wish to know for example how a drug affects the percentage of spermatozoa that make the acrosomal reaction. So we will compare the estimate of the frequency of Reacted sperm cells obtained with automatic classification method with that provided by manual annotation. Using the testing set as an assay example (table 2.2) it is possible to find 55,2% of Reacted objects in those images, opposed to the 43.1% of Reacted spermatozoa manually annotated. We can see this measurement has an error (i.e. ε = (η0 − η)/η, where η0
is the Reacted frequency within the uncurated objects in the testing set and η is the Reacted frequency within the subset sperm cells contained in the testing set) of 28.1%, which is not negligible. On the other hand, if we consider the 75 cells of the training set annotated as unknown to be in fact Reacted cells, the error would be -2.4%, a negligible result. The classification module can classify correctly using the profiles of the detected objects (previous section) which, combined to these results, suggest that the detection module does not allow the estimating the correct Reacted frequencies. It is worth noticing that despite the fact
that only 49,0% of the spermatozoa were detected, this included some cells that were missed by the manual cell annotation, an indication that our detection module has good potential and may have good performance after refinement.
2.5
Discussion
In this chapter, we proposed a modular automated method for detection and classification of human spermatozoa according to acrosomal reaction. While the classification module based on QDA demonstrated a good performance the detection module has a relatively poor performance, that prevents its straightforward usage in acrosomal reaction assays. Nevertheless, the method has a high potential as discussed below.
2.5.1
Spermatozoa detection
Because clusters impair the detection, low spermatozoa density on image acquisition is advised when using this detection method to avoid formation of clusters. This straightforward improvement of the experimental condition would allow to widen the area thresholding limits and consequently to improve detection efficiency. While this might entail the preparation of a few extra slides and some additional time at the microscope, the detection, classification and quantification would be reduced from hours to minutes or even seconds. Note that a spermatozoa maximum density threshold can be obtained and advised if a detection performance test is done while varying cell density.
Although it was found a c value and maximum and minimum area thresholds (i.e. detection parameters) for which the classification is good, this training process takes considerable time per image and per c value iteration. Hopefully, the training can be generally applicable to other images. The fact that we were able to satisfactorily classify cells of independent images suggest this training will only be needed once (i.e. with a sufficiently large and variable training set) and then the detection-classification algorithm will be ready to use for most samples. Also, the algorithm can be optimized, meaning we can increase its speed.
The high classification efficiency for high c values when no area threshold was applied (fig. 2.6a) is unexpected as the features chosen and used for classification should need a considerable large spermatozoon sampling area to be classified correctly. The detection algorithm detects higher intensity areas for higher c values and these are resolved at the tip or at the middle of Capacitated and Reacted spermatozoon heads, respectively, suggesting that the differences in these areas profiles is significant and may be sufficient for classification. The Reacted true positives oscillating values for high c values is probably due to stochastic effects on the small population of objects used for training and validation sets.
It is worth remarking that the proposed algorithm detected and classified correctly a few cells that were not manually annotated, as this illustrates automatic classification may avoid mistakes due to tedious manual annotation.
2.5.2
Features and classification method
In contrast to boar spermatozoa damaged acrosome assay (Alegre et al., 2009), QDA performed better than LDA. Our method also provided slightly better classification efficiency than any of the methods used in that work. As their imaging data suggest different intensities along the normal and abnormal spermatozoa heads, our features may also be adequate for that kind of assay, although performance tests must be made to assess if they are better. Note we also tested if we could manually define a border function after analysing the data with PCA but we came to conclusion that a great compromise from one of the classes would be needed and worse results than those achieved by LDA were expected (data not shown).
No rescaling or normalization of profile values (i.e. either profile-wise or feature-wise) was done. This is because the 8-bit grayscaled images have a fixed range from zero to 255 and we expected good image acquisition practice (i.e. every image as at least a few pixels with zero intensity and other few pixels with maximum intensity) so rescaling should not be needed. Although improbable, it is possible that this had an impact on classification efficiency and more work should be done to address this issue.
It should be emphasised that the number of spermatozoa used to train and validate the classification method was relatively small. Most likely the training with larger data sets would provide better results.
2.5.3
Classification: automatic vs manual detection
Training efficiency after automatic detection by segmentation never got to the same efficiency level of that achieved after manual detection. This suggests the automatically detected ellipse-shaped objects provided weaker features for class sorting which affected classification. By fine-tuning or developing better automatic detection algorithms it should be possible to get better classification efficiency while using this classification algorithm. Many CASA systems exist (Amann and Katz, 2004) and it is possible to merge one of those good spermatozoa detectors with our classification method. The problem is that many of these detectors evaluate sperm motility, being based on forward and backward tracking to resolve clusters of cells, and need time-lapse images of those cells (Amann and Katz, 2004). The acrosomal reaction assay requires fixing cells and therefore the back or forward tracking will fail here. Furthermore, CASA detection methods identify the position but not the major axis and orientation of the spermatozoon head, and the latter is critical for our classification method.
2.5.4
Fully automated classification method
The distribution of spermatozoa classes are similar in both training and testing set, as expected (table 2.3). Note that the imaging data used for both the training and testing sets also contain 100 and 75 unknown and ambiguous spermatozoa, respectively, that were not included in the Reacted frequencies. It is not unlikely all annotated cells that were not unequivocally classified as Capacitated are in fact Reacted. This would alter the Reacted frequencies of training and testing spermatozoa to 56.4% and 56.7%, respectively. With these values the error in the estimate of Reacted frequencies is -2.4%, which is negligible. The classification was correct for almost every cell in the testing curated objects set (table 2.2), which further supports the validity of this assumption.
Considering the ambiguous sperm cells affect the estimated Reacted frequencies and we do not have the means to ascertain the real error. The ambiguity might not exist if an expert would do the manual annotation. Using the expert data to build training, validation and testing sets large enough to validate and generalize our method. At that stage, the algorithm would be ready to be made available to the research community. Also note that we compared the whole data, where clustered spermatozoa were annotated and considered, to the objects detected and filtered, which comprehend about half the spermatozoa present. If the frequency of Reacted sperm cells within cluster differs from the one in isolation, by some biological/experimental condition or simply by randomness, the error might be significant. As such, it is crucial to improve spermatozoa detection.
2.6
Conclusion
Male infertility is major problem affecting millions of couples. CASA systems are widely used in clinical setting to assess infertility derived from spermatozoa motility problems or in hyperactivation after capacitation. Hitherto, these systems do not incorporate methods to quantify the ability to perform the acrosomal reaction, which is critical for gamete fusion. In a step towards the development of such methods, we used QDA to distinguish and classify spermatozoa according to their status of acrosomal reaction on independent images. Our method demonstrated an excellent potential in term of this classification, but several limitations of automatic detection must be overcome.
Chapter 3
Model-based spermatozoa detection and
tracking in time-lapse imaging data
3.1
Introduction
Sperm motility is a key determinant of reproductive efficiency in animals in general and specifically in humans. Although efforts in microscopy instrumentation have been made to allow tracking the spermatozoa while swimming freely in three dimensions (Crenshaw, 1989, Corkidi et al., 2008) the vast majority of the experimental and theoretical studies on sperm motility are based on planar swimming. In fact, most of our current knowledge is based on sea urchin sperm cells that are more convenient to study than their human homologues (Gaffney et al., 2011, Barratt et al., 2009, Darszon et al., 2008). Sea urchin spermatozoa swim in three dimensions along helical paths that bring them close to media interfaces (e.g. water-air or water-glass), where they remain trapped and describe circles (Cosson et al., 2003). Once confined to an interface spermatozoa can be easily imaged by conventional microscopy techniques since they remain in the focal plane of the microscope for long periods of time. This feature combined with fast acquisition cameras and stroboscopic lighting allowed imaging of flagellar bending waves while these propel the spermatozoon in stationary swimming or during reorientation in response to chemoattractants (Friedrich et al., 2010, Guerrero et al., 2010). The restrict degrees of freedom in planar swimming also make it an ideal case for mathematical modelling. A considerable body of experimental work (Cosson et al., 2003, Guerrero et al., 2010) and theoretical (Friedrich et al., 2010, Smith et al., 2009, Yang et al., 2008) indicates that when spermatozoa swim in the plane they can reorient their swimming path towards a source of a chemoattractant by increasing the asymmetry in the flagellar beating, making acute turns, followed by intervals of more symmetric beating, resulting in straighter paths. These turn-and-run episodes are controlled by concomitant Ca2+-spiketrains (Böhmer et al., 2005, Guerrero et al., 2010). intracellular concentration of Ca2+ ([Ca2+]i) spikes are elicited by
sperm activating peptides (SAPs) (e.g speract and resact) that trigger reorientation in sperm that have specific receptors (Guerrero et al., 2011). Yet, the SAP response is not sufficient for chemotaxis. Lytechinus pictus and Strongylocentrotus purpuratus spermatozoa respond to speract with [Ca2+]
ispike trains and turn and run episodes, but only spermatozoa of the former
species displays chemotaxis (Guerrero et al., 2010). Chemotaxis require exquisite sensorimotor coordination so that [Ca2+]
i spikes and turn are elicited at the right time close to the minimum
of chemoattractant gradient sensed in the circular path (Guerrero et al., 2010).
3.1.1
Sperm tracking problem
The quantitative studies on spermatozoa chemotaxis and how flagellar bending waves control the swimming trajectory require not only the tracking spermatozoa in time-lapse images but also the fine quantification of flagella conformations in many frames. Hitherto this has been done by procedures that are computer assisted (e.g. Baba and Mogami (1985)), but that require human intervention (e.g. Guerrero et al. (2010)). The usual difficulties in automated detection of objects are further augmented when detecting and tracking sperm cells during SAP responses, since spermatozoa overcrowd the area with higher chemoattractant concentration. Under these conditions, different flagella overlap and multiple heads appear transiently as contiguous regions (Guerrero et al., 2010). Algorithms for identification and tracking of spermatozoa are based on image segmentation and shape descriptors. Image segmentation uses mathematical and statistical analysis of the data (i.e. using positional and intensity dimensions) to separate objects from background (Luo et al., 2010, Ren et al., 2010). Once objects are identified in each frame in a time-lapse sequence they are in general associated taking into account their proximity and/or velocity. The drawback is that often, these objects identified in each frame are two or more cells clustered together and these methods alone do not provide means to separate them. A few algorithms exist and address this issue (e.g. watershed algorithms) but they deal mostly with roundish cells (i.e. the more elliptical the cells are, the more this algorithm fails). All these factors make any automatic tracking algorithm very inefficient and requiring human supervision.
3.2
Objectives
Object detection in imaging data is crucial for any subsequent analysis, either morphological, signalling, or tracking. The results of previous chapter illustrate this point since the overall efficiency in the automatic classification of spermatozoa according to acrosomal reaction was compromised by inefficient detection of sperm heads. While detecting fixed sperm is, in practical terms, as important as detecting or tracking motile spermatozoa time-lapse imaging
data, the latter case is more has more applications. As noticed before for fixed spermatozoa, one could simply decrease the sperm density on experimental assays but motile sperm tend to swim towards sources of chemoattractant, where they intersect. This is a huge drawback for the possibility of automatic the analysis of this kind of assays.
While many cell detection and tracking algorithms exist they rely almost solely on the images, using little a priori information (e.g. desired area and shape descriptors). Today, we need to get more information beyond the imaging data and to get it we need other sources of information. Complementing and analysing these different kind of information will generate new knowledge. The hypothesis that we are exploring in this chapter is that an a priori model of the spermatozoa conformation and trajectory can be derived, and this model can be fitted to time-lapse imaging data of spermatozoa swimming in the plane. As in any other problem of model fitting one of the challenges is to devise a measurement of the quality of the fitting that can be used to adjust the model parameters.
3.3
Materials and Methods
3.3.1
Time-lapse imaging data
L. pictus images were acquired with Optronics CR500X2 camera at 500 fps in full chip in a bright field Olympus inverted microscope (IX71) with a 60 × 1.6 0.7 NA long working distance objective. Later these were processed in ImageJ as follows: (1) Image type 16 bits, (2) Smooth, (3) Subtract background (Rolling bar radius = 13px, Light background), (4) Create an average time projection (1000 frames) (5) Subtract the resultant image to each frame of the stack (32 bit result), (6) Enhance contrast (Normalize, Use stack histogram), (7) Invert and (8) Image type 16 bits. S. purpuratus imaging was done as described in Guerrero et al. (2010).
Figure 3.1: a) First 30 frames of a L. pictus spermatozoon used to build the tabled sperm data. b) Sample of 30 frames of two L. pictus spermatozoa intersecting. Frame sequence is displayed row-wise from top-left to bottom-right. Frames have a frequency of 500Hz and a resolution of 0.37 µm/pixel.