MEMBERS’ SEGMENTATION, SERVICE QUALITY AND BEHAVIORAL INTENTIONS: A CASE STUDY OF A PROFESSIONAL FOOTBALL TEAM
Rui Biscaia
Doutorando em Sociologia e Gestão do Desporto
Faculdade de Motricidade Humana da Universidade Técnica de Lisboa [email protected]
Abel Correia Professor Associado
Faculdade de Motricidade Humana da Universidade Técnica de Lisboa [email protected]
Vilde Gomes de Menezes Professor Adjunto
Universidade Federal de Pernambuco [email protected]
António Rosado Professor Catedrático
Faculdade de Motricidade Humana da Universidade Técnica de Lisboa [email protected]
Carlos Colaço
Professor Associado com Agregação
Faculdade de Motricidade Humana da Universidade Técnica de Lisboa [email protected]
Abstract
This study aims to identify segments of members in a professional football team, and to compare service quality perceptions and behavioral intentions among these segments. The members registered in the club’s database were invited to complete a survey including demographic questions, measures of consumer behavior, service quality, and behavioral intentions. The results from a sample of 6820 participants allowed the identification of three distinct segments, named as ‘Occasional’, ‘Die-hard’, and ‘Weekend Lovers’. Results also indicate that these three segments of members showed statistically significant differences regarding service quality perceptions and behavioral intentions. Managerial implications of these results are discussed and suggestions for future research are provided.
Key words: Members. Consumer behavior. Service quality. Behavioral intentions. Football.
Segmentação de sócios, qualidade do serviço e intenções comportamentais. Um estudo de caso com uma equipa profissional de futebol
Resumo
sócios denominados por ‘Ocasionais’, ‘Fanáticos’ e ‘Domingueiros’. Os resultados indicaram ainda que os três segmentos de sócios apresentam diferenças estatisticamente significativas em relação à perceção da qualidade do serviço e intenções comportamentais. Implicações de gestão destes resultados são discutidas e sugestões para futuras pesquisas são apresentadas.
Palavras-Chave: Sócios. Comportamento do consumidor. Qualidade do serviço. Intenções comportamentais. Futebol.
Segmentación de socios, calidad del servicio e intenciones de comportamiento. Un estudio de caso de un equipo de fútbol profesional
Resumen
Este estudio tuvo como objetivo identificar segmentos de socios de un equipo de fútbol profesional y comparar la percepción de la calidad del servicio y las intenciones de comportamiento de cada segmento. Se solicito la participación voluntaria de los socios registrados en la base de datos del club, para responder a un cuestionario que incluía preguntas demográficas, medidas de comportamiento del consumidor, de calidad del servicio y sobre las intenciones de comportamiento futuro. Los resultados de una muestra de 6820 participantes permitieron la identificación de tres segmentos de socios que fueron nombrados los ‘Ocasionales’, los ‘Fanáticos’ y los ‘Amantes del fin de semana’. Los resultados también indicaron que estos tres segmentos de socios presentan diferencias estadísticamente significativas con respecto a la percepción de la calidad del servicio y las intenciones de comportamiento. Se discuten las implicaciones gerenciales de estos resultados y se sugieren líneas futuras de investigación.
Palabras Clave: Socios. Comportamiento del consumidor. Calidad del servicio. Intenciones de comportamiento. Fútbol.
Introduction
Previous literature suggests that the affiliated members of the clubs (i.e., paid-up members) have more favorable perceptions of their consumption experiences (Fisher & Wakefield, 1998). This link with the club has obvious managerial implications such as game attendance, word-of-mouth communications, season ticket purchases, or merchandise sales (Dale, Iwaarden, Wiele, Williams, 2005; Boyle & Magnuson, 2007). However, service quality perceptions and goodwill towards the team could differ according to consumer’s demographics or lifestyle (Kim, Yoo, & Pederson, 2007; Shaw & McDonald, 2006). Thus, the practice of identifying groups among the members of the clubs is vital because sport organizations cannot obtain a strong foothold within the marketplace if these segments are not identified and managed appropriately (Ross, 2007). Segmentation enables the identification of market opportunities, and sets the guidelines for the formulation of marketing strategies and allocation of resources (Bednarik, Šugman, Urank, & Kovač, 2007). The most prevalent segmentation approach over the last decades has been based on demographic variables (Woo, 1998). However, recent literature suggests that effective segmentation practices can result from developing a deep understanding beyond the mere demographic profiles (Kim et al., 2007; Rohm, Milne, & McDonald, 2006). Thus, the segmentation of sport consumers should include consumer behavioral variables (Kotler, 2000) as complement of demographic information, given that individuals respond in myriad ways when thinking about certain objects or concepts in a specific situation (Kim et al., 2007).
Market segmentation is extremely pertinent in professional team sports such as football because of its extensive global popularity and the ability to generate high incomes and revenues (Bauer, Stokburger-Sauer, & Exler, 2008). For example, during the the 2008-2009 season, about 54 million spectators attended games in the top divisions of European football leagues in England, France, Germany, Italy and Spain (Koenigstorfer, Groeppel-Klein, & Kunkel, 2010). In another example, the top Portuguese professional football league attracted 2.5 million spectators in the 2008/2009 season (Liga Portuguesa de Futebol Profissional, 2011), and the team with better average attendance was Sport Lisboa e Benfica, with 46.737 spectators per game. Still, game attendance is currently decreasing in all Portuguese clubs and financial management is becoming harder (Deloitte, 2010). To that extent, this study represents a case study of a team from the top Portuguese professional football league, and the purpose is twofold. First, this study attempts to identify distinct segments of the affiliated members of that team. Second, this study seeks to compare the perception of service quality and behavioral intentions among different members of the team. It is expected that knowledge derived from this case study may aid the managers of this team, in particular, and club managers, in general, in developing marketing strategies to increase game attendance, as well as expanding their members’ base.
Method
Sample and data collection
college graduation (47.8%). More than half indicated that were living at less than 50 km from the stadium (56.2%), while about one-third was living at a distance of more than 200km (26.4%). Almost half mentioned they typically attend more than 9 games per season (40.5%), and more than two-thirds were not season ticket holders (72.3%). Also, the majority reported visiting the stadium shopping at game days (79.0%).
Instrument
The survey included demographic questions (gender, age, education level, distance Home-Stadium), consumer behavior variables (average games attended per season, type of ticket, and visits to the shopping at the stadium), and a total of 35 items divided into two sections. The first section was designed to assess service quality and included 29 items. The 20 items proposed in the SPORTSERV scale (Theodorakis & Alexandris, 2008) were adapted to assess five constructs: Tangibles (five items), Responsiveness (four items), Access (four items), Security (four items), and Reliability (three items). In addition, two constructs were included to assess Auditory (i.e., ambient conditions derived from the crowd noise) and Game Quality (i.e., perception of team performance). The construct of Auditory included five items. Four of these items were derived from Kuenzel and Yassim (2007), while one item was designed to measure members’ perception of the show performed by the club’s mascot. To assess Game Quality, two items were adopted from Kuenzel and Yassim (2007), and two additional items regarding team success were designed to increase construct reliability and decrease measurement errors (Churchill, 1979). The second section was designed to measure behavioral intentions and included six items. The two constructs proposed by Theodorakis and Alexandris (2008) were used in this section: Repurchase Intentions (three items) and Word-of-mouth (three items). All survey items were required to answer and measured through a 10-point scale (1=strongly disagree, 10=strongly agree).
Data Analysis
Data were analyzed using SPSS 19.0. A confirmatory factor analysis (CFA) was performed to confirm the proposed structure of the measurement model including the constructs related to service quality and behavioral intentions. The appropriateness of the model to the data was assessed with comparative-of-fit-index (CFI), goodness-of-fit index (GFI), and root mean square error of approximation (RMSEA). Internal consistency of the constructs was estimated through composite reliability, and convergent validity was evaluated through the average variance extracted (AVE) (Fornell & Larcker, 1981; Hair, Black, Babin, Anderson, & Tatham, 2005). A two-step cluster analysis was conducted to identify distinct segments among the team members. The use of this method is justified by the large dataset and the fact this study includes both continuous and categorical variables to identify segments (Hair et al., 2005). The MANOVA procedures were used to assess clusters differences across service quality and behavioral intentions. When statistically significant effects were detected, Tukey's Post-hoc tests were carried out (Maroco, 2010). Statistical significance was assumed for p<.05.
Results
Measurement Model
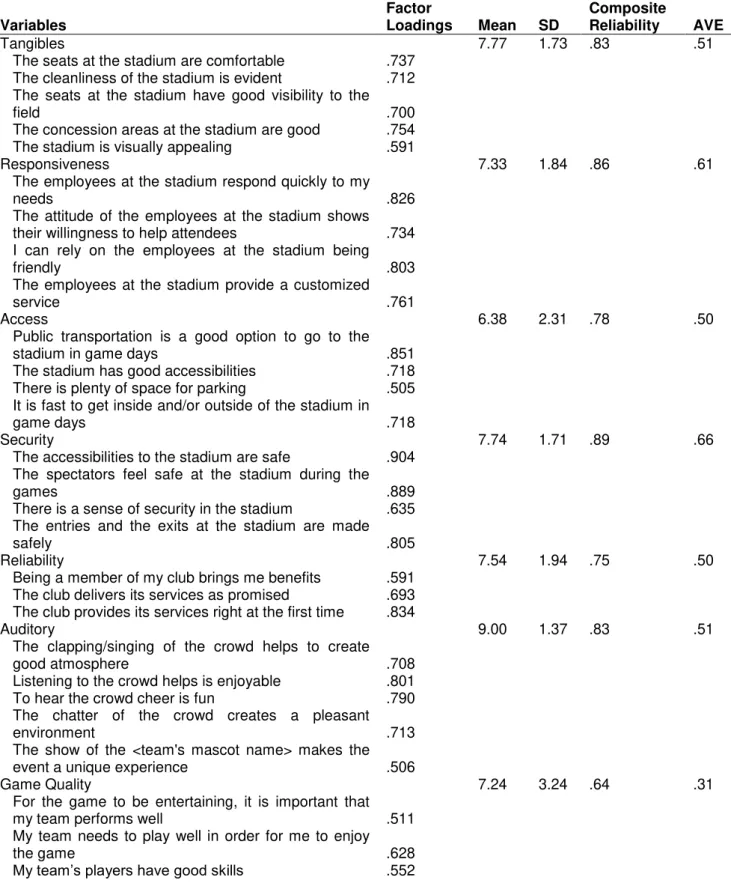
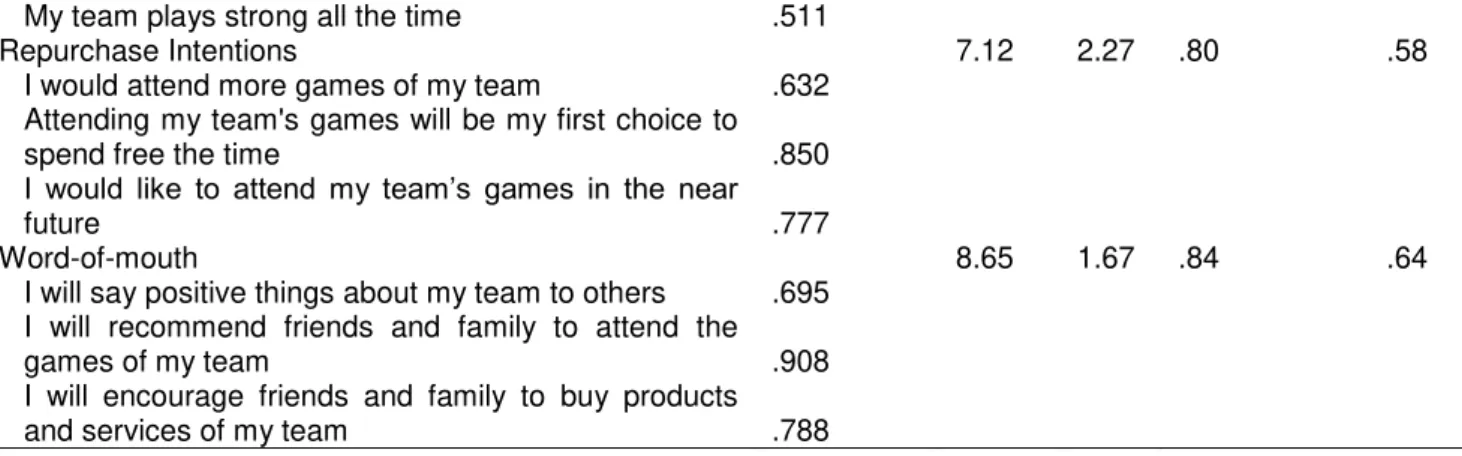
Descriptive statistics are also reported in Table 1. In what concerns to the constructs of service quality, Auditory had the highest mean score (M=9.00; DP=1.37), while Access had the lowest mean score (M=6.38; DP=2.31). Regarding to behavioural intentions, participants showed lesser levels of Repurchase Intentions (M=7.12; SD=2.27) than Word-of-mouth (M=8.65; SD=1.67).
Table 1. Mean (M), Standard Deviation (SD), Factor Loadings, Composite Reliability, and Average Variance Extracted (AVE).
Variables
Factor
Loadings Mean SD
Composite
Reliability AVE Tangibles
The seats at the stadium are comfortable The cleanliness of the stadium is evident
The seats at the stadium have good visibility to the field
The concession areas at the stadium are good The stadium is visually appealing
.737 .712 .700 .754 .591
7.77 1.73 .83 .51
Responsiveness
The employees at the stadium respond quickly to my needs
The attitude of the employees at the stadium shows their willingness to help attendees
I can rely on the employees at the stadium being friendly
The employees at the stadium provide a customized service
.826 .734 .803 .761
7.33 1.84 .86 .61
Access
Public transportation is a good option to go to the stadium in game days
The stadium has good accessibilities There is plenty of space for parking
It is fast to get inside and/or outside of the stadium in game days
.851 .718 .505 .718
6.38 2.31 .78 .50
Security
The accessibilities to the stadium are safe
The spectators feel safe at the stadium during the games
There is a sense of security in the stadium
The entries and the exits at the stadium are made safely
.904 .889 .635 .805
7.74 1.71 .89 .66
Reliability
Being a member of my club brings me benefits The club delivers its services as promised
The club provides its services right at the first time
.591 .693 .834
7.54 1.94 .75 .50
Auditory
The clapping/singing of the crowd helps to create good atmosphere
Listening to the crowd helps is enjoyable To hear the crowd cheer is fun
The chatter of the crowd creates a pleasant environment
The show of the <team's mascot name> makes the event a unique experience
.708 .801 .790 .713 .506
9.00 1.37 .83 .51
Game Quality
For the game to be entertaining, it is important that my team performs well
My team needs to play well in order for me to enjoy the game
My team’s players have good skills
.511 .628 .552
My team plays strong all the time .511 Repurchase Intentions
I would attend more games of my team
Attending my team's games will be my first choice to spend free the time
I would like to attend my team’s games in the near future
.632 .850 .777
7.12 2.27 .80 .58
Word-of-mouth
I will say positive things about my team to others I will recommend friends and family to attend the games of my team
I will encourage friends and family to buy products and services of my team
.695 .908 .788
8.65 1.67 .84 .64
Description of the Clusters
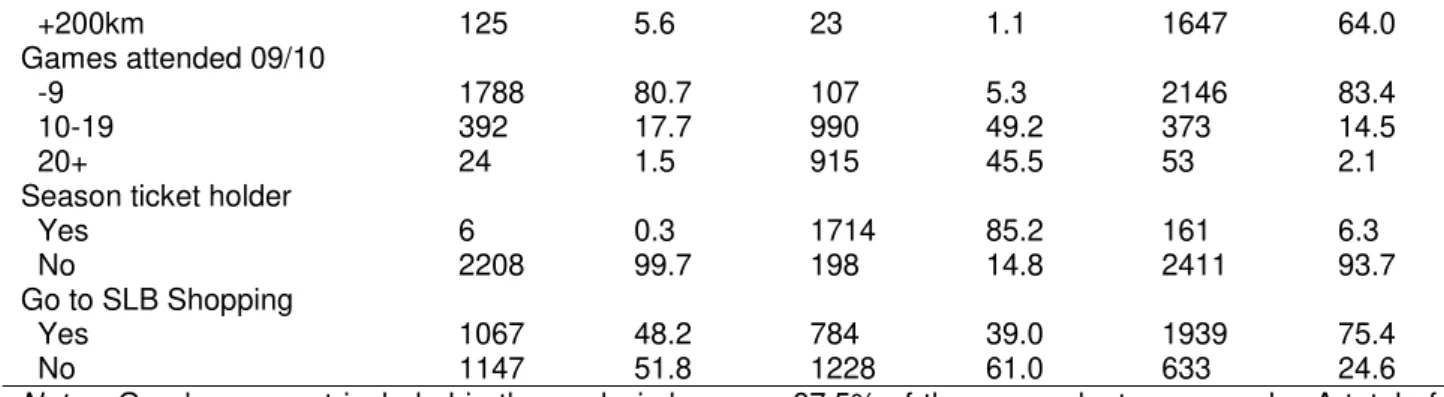
Three distinct segments were identified with the two-step cluster analysis (Table 2). Cluster One (n=2214) made up 32.5% of the sample. Members of this cluster were named ‘Occasional’ based on the following characteristics: 26.0% were between the 30-39 age range, 50.3% had high school degree, 85.4% were residents in a range of 50km from the stadium, 80.7% attend less than 9 games per season, 99.7% were not season ticket holders, and 48.2% indicated visiting the stadium shopping at game days. Cluster Two (n=2012) corresponds to 29.5% of the sample. These members were named ‘Die-hard’ based on previous literature (Dale et al., 2005) and the following aspects: 31.7% were in the 30-39 age range, 61.8% had college degree, 91.8% reported living in a range of 50km from the stadium, 94.7% attend more than 9 games per season, 85.2% were season ticket holders, and 61.0% do not visit the stadium shopping at game days. Cluster Three (n=2572) consists of 37.7% of the sample. These members were named ‘Weekend Lovers’ based on the following characteristics: 32.4% were in the 30-39 age range, 50.8% had high school degree, 64.0% indicated living over 200km from the stadium, 83.4% attend less than 9 games per season, 93.7% were not season ticket holders, 75.4% visit the stadium shopping at game days. In general, it could be said that members named as ‘Occasional’ are those who live near the stadium, but attend only a few games each season. The ‘Die-hard’ members are those who live near the stadium and attend several games per season. In turn, the members named as ‘Weekend Lovers’ are the ones that live very far from the stadium and attend only a few games. However, when they travel to the stadium, these days represent a full experience that includes visiting the shopping and attending the game.
Table 2. Comparison of the Clusters Profiles.
Variables
Cluster 1 (n=2214)
‘Occasional’ Cluster 2 (n=2012) ‘Die-hard’
Cluster 3 (n=2572) ‘Weekend Lovers’
n % N % n %
Age -20 20-29 30-39 40-49 50-59 60+ 377 484 576 401 252 124 17.0 21.9 26.0 18.1 11.4 5.6 85 472 637 395 249 174 4.2 23.5 31.7 19.6 12.4 8.6 100 484 833 500 318 117 3.9 18.8 32.4 19.4 12.4 4.5 Education Level
+200km 125 5.6 23 1.1 1647 64.0 Games attended 09/10
-9 10-19 20+
1788 392 24
80.7 17.7 1.5
107 990 915
5.3 49.2 45.5
2146 373 53
83.4 14.5 2.1 Season ticket holder
Yes No
6 2208
0.3 99.7
1714 198
85.2 14.8
161 2411
6.3 93.7 Go to SLB Shopping
Yes No
1067 1147
48.2 51.8
784 1228
39.0 61.0
1939 633
75.4 24.6
Notes: Gender was not included in the analysis because 87.5% of the respondents were males;A total of 22
participants (0.3%) were automatically eliminated by the two-step cluster analysis because they didn't fit with any of the clusters.
Clusters Comparison
The MANOVA results indicated significant differences (Wilk’s Lambda=.804, p<.001) among the three clusters in relation to the constructs of both service quality and behavioral intentions (Table 3). Subsequent Tukey's Post-hoc tests revealed that ‘Weekend Lovers’ showed a significantly higher perception of service quality than other members in the following constructs: Tangibles (p<.01), Responsiveness (p<.05), Access (p<.01), Security (p<.01), Reliability (p<.05), Auditory (p<.05), Game Quality (p<.05). Regarding behavioral intentions, ‘Weekend Lovers’ showed significantly higher Repurchase Intentions than ‘Occasional’ (p<.01) but the mean score were significantly lower than for ‘Die-hard’ (p<.01). The Word-of-mouth communications for ‘Weekend Lovers’ were significantly higher than in ‘Occasional’ (p<.05). ‘Die-hard’ members demonstrated significantly lower perceptions than ‘Occasional’ in the constructs of Tangibles (p<.01), Responsiveness (p<.05), Access (p<.01), Reliability (p<.05), and Game Quality (p<0.05). However, the mean score of Repurchase Intentions (p<.01) was significantly higher in ‘Die-hard’ than in ‘Occasional’, while no statistically significant differences were found between these two segments in Word-of-mouth.
Table 3. MANOVA results.
Variables ‘Occasional’M (SD) ‘Die -hard’
M (SD) ‘Weekend Lovers’M (SD) F p
Tangibles 7.80 (1.62) 7.39 (1.33) 8.08 (1.26) 77.07 **
Responsiveness 7.39 (1.49) 6.94 (1.43) 7.62 (1.42) 62.11 *
Access 6.51 (1.76) 6.00 (1.73) 6.84 (1.62) 67.89 **
Security 7.62 (1.61) 7.64 (1.47) 7.93 (1.46) 16.45 ** a)
Reliability 7.58 (1.66) 7.39 (1.49) 7.79 (1.56) 18.62 *
Auditory 8.94 (1.19) 8.92 (1.04) 9.11 (1.05) 10.13 * a)
Game Quality 7.31 (1.58) 6.97 (1.72) 7.41 (1.54) 23.34 *
Repurchase Intentions 7.10 (1.86) 7.74 (1.70) 7.45 (1.88) 32.80 ** Word-of-mouth 8.64 (1.48) 8.75 (1.41) 8.85 (1.39) 8.69 * b) Notes: * p<.05; ** p<.01; a) no differences between ‘Occasional’ and ‘Die-hard’; b) differences only in ‘Occasional’ and ‘Weekend Lovers’.
Discussion and Implications
Lovers’), based on their demographic characteristics and consumption behavior variables. These findings are consistent with previous literature suggesting that fans often differ in demographic characteristics, lifestyles, and product usage (Ross, 2007). Thus, club managers could use these variables to effectively reach and serve consumers, and develop a stronger link between club and members. In addition, the results of the CFA showed a good fit of the measurement model to the data and, with exception to Game Quality, all constructs exhibited good psychometric properties. The MANOVA results indicated that all constructs used to assess both service quality and behavioral intentions dimensions were important to distinguish the three segments of SLB members. Identifying segments of members with similar perceptions of service quality and behavioral intentions can be a powerful tool for sport managers in order to develop positioning strategies. The findings in this study indicate that ‘Weekend Lovers’ had, in general, the best perception of service quality (Table 3) but they showed significantly lower mean scores of Repurchase Intentions than ‘Die-hard’. Also, ‘Weekend Lovers’ had significantly higher mean scores of Word-of-mouth than others SLB members. Although the price perception was examined in this study, these findings may be related to the distance from their residences to the stadium and the overall costs associated (Dale et al., 2005). ‘Die-hard’ members showed, in general, the worst perception of service quality, but the highest mean scores of repurchase intentions. These results may suggest that, although ‘Die-hard’ members are more critical about service delivery, they consider other factors in their consumption decisions, such as team identification (Trail & James, 2001). In turn, ‘Occasional’ showed an intermediate perception of service quality constructs, when compared with ‘Die-hard’ and ‘Weekend Lovers’. However, ‘Occasional’ had the lowest mean scores in Repurchase Intentions and Word-of-mouth suggesting the need to enhance marketing communications with this segment in order to reinforce their link with the team (Ross, 2007).
Taken together, findings from this study support the conclusion that there are three distinct segments of members in the team that was examined, named as ‘Occasional’, ‘Die-hard’, and ‘Weekend Lovers’. As such, the club managers should develop differentiated marketing strategies. For example, it may be important to reward the ‘Die-hard’ members for their consumption behavior by offering better pricing in cross-sell products and services. Additionally, the reduction of the parking fees inside the stadium to ‘Die-hard’ may be crucial to improve their perception of the access to the stadium and the overall service quality. In turn, some characteristics of ‘Weekend Lovers’ (e.g., visits to the stadium shopping) suggest that this segment considers the game day as an escape from the daily routines of everyday life. Thus, enriching their consumption experience at game days with other activities (e.g., ticket packages including a visit to the club’s museum or guided tours of the stadium) could be important to increase their perception of service quality, and to improve the revenues of the club. Given that ‘Weekend Lovers’ showed the best perception of service quality, the club could also promote the sense of nostalgia (Clowes & Tapp, 2003) among these members by evoking past memories of the consumption experience when promoting games. Regarding to ‘Occasional’, it seems important to increase the marketing communications (e.g., newsletters, free local newspapers) and promote experiences for reinforcing their link with the team (e.g., scheduling the interaction of these members with historical figures of the club before the game and at half-time). Also, through the use of email communications with this segment (e.g., videos from historical games), the club may improve the attractiveness of the games to this group of members, as well as for the remaining segments.
Limitations and future research
actual stadium may contribute to a more representative sample of the clubs’ members. Second, the demographic questions and consumer behavior variables used in this study may not be enough to characterize appropriately the members of a team or club. Future research could include additional variables such as household income, perceived constraints (Jun, Kyle, Mowen, 2009), social values, lifestyle characteristics (Kim et al., 2007), affiliation in organized groups of supporters (i.e., ultra-fans), the type and number of companions at the stadium, and merchandise purchases, in order contribute to a wider knowledge of the profile of the different groups of members of the clubs. Third, the construct of Game Quality did not show good psychometric properties. This fact suggests the need to refine the items of this construct in future research given that the quality of the game is vital for measuring consumer perception about service quality (Kelley & Turley, 2001; Yoshida & James, 2010). Thus, the inclusion of items regarding team players and head coach (Bauer et al., 2008) could provide useful guidance to improve the assessment of game quality. Additional research could also include other constructs such as facility design (Wakefield, Blodgett, & Sloan, 1996), opponent characteristics (Yoshida & James, 2010), or rivalry (Ross, Russell, & Bang, 2008) to extend the understanding of service quality in professional team sports. Finally, additional research should monitor the perceptions of service quality and behavioral intentions of each segment of members at different points of the season to understand the importance of team success on members’ attachment with the clubs.
References
Bagozzi, R., & Yi, Y. (1988). On the evaluation of structural equation models. Journal of the Academy of Marketing Science, 16(1), 74-94.
Bauer, H., Stokburger-Sauer, N., & Exler, S. (2008). Brand image and fan loyalty in professional team sport: A refined model and empirical assessment. Journal of Sport Management, 22(2), 205-226.
Bednarik, J., Šugman, R., Urank, J., & Kovač, M. (2007). Segmentation of sports consumers in Slovenia. Kinesiology, 39(1), 74-84.
Boyle, B. A., Magnusson, P. (2007). Social identity and brand equity formation: A comparative study of collegiate sports fans. Journal of Sport Management, 21(4), 497-520.
Brady, M. K., & Cronin, J. J. (2001). Some new thoughts on conceptualizing perceived service quality: A hierarchical approach. Journal of Marketing 65(3), 34-49.
Byrne, B. (2000). Structural Equation Modeling with AMOS: Basic concepts, applications, and programming.Mahwah, NJ: Lawrence Erlbaum Associates.
Churchill, G. A. Jr. (1979). A paradigm for developing better measures of marketing constructs. Journal of Marketing Research,16(1), 64-77.
Clowes, J., & Tapp, A. (2003). Looking through the hourglass of fan segmentation: research findings and marketing implications for live spectator sports. International Journal of Sports Marketing and Sponsorship, 5(1), 57-73.
Cronin, J. J. Jr., Brady, M., & Hult, G. T. M. (2000). Assessing the effects of quality, value and customer satisfaction on consumer behavioral intentions in service environments. Journal of Retailing, 76(2), 193-218.
Dale, B., Iwaarden, J., Wiele, T., Williams, R. (2005). Service improvement in a sports environment: a study of spectator attendance. Managing Service Quality, 15(5), 470-484.
Deloitte (2010). Football Money League. Manchester: Sport Business Group, Deloitte.
Deloitte (2012). Annual review of football finance 2012. Manchester: Sport Business Group, Deloitte.
Diaz, I. M. R., Verdugo, M. C., & Florencio, B. P. (2012). Calidad percibida por el espectador de fútbol. Revista de Psicología del Deporte, 21(1), 15-23.
Fisher, R., & Wakefield, K. (1998). Factors leading to group identification: A field of study of winners and losers. Psychology and Marketing, 15(1), 23-40.
Grönroos, C. (1988). Service quality: The six criteria of good perceived service. Review of Business 9(3), 10-13.
Hair, J. F, Black, W. C., Babin, B., Anderson, R. E., & Tatham, R. L. (2005). Multivariate data analysis (6th ed.). New York: Prentice Hall.
Hall, J., & O’Mahony, B. (2006). An empirical analysis of gender differences in sports attendance motives. International Journal of Sports Marketing & Sponsorship, 7(4), 334-346.
Homburg, C., & Giering, A. (2001). Personal characteristics as moderators of the relationship between customer satisfaction and loyalty – An empirical analysis. Psychology and Marketing, 18(1), 43-66.
Jun, J., Kyle, G. T., & Mowen, A. J. (2009). Market segmentation using perceived constraints. Journal of Park and Recreation Administration, 26(1), 35-65.
Kelley, S., & Turley, L. (2001). Consumer perceptions of service quality attributes at sporting events. Journal of Business Research, 54(2), 161-166.
Kim, S., Yoo, E., & Pederson, P. (2007). Market segmentation in the K-League: An analysis of spectators of the Korean professional soccer league. International Journal of Sports Marketing and Sponsorship, 8(2), 141-158.
Koenigstorfer, J., Groeppel-Klein, A., & Kunkel, T. (2010). The attractiveness of national and international football leagues: perspectives of fans of “star clubs” and “underdogs”. European Sport Management Quarterly 10(2), 127-163.
Koo, G, Hardin, R., McClung, S., Jung, T., Cronin, J., Vorhees, C., & Bourdeau, B. (2009). Examination of the casual effects between the dimensions of service quality and spectator satisfaction in minor league baseball. International Journal of Sports Marketing & Sponsorship 11(1), 46-59.
Kotler, P. (2000). Marketing Management (5th ed.). New Jersey: Prentice-Hall.
Kuenzel, S., & Yassim, M. (2007). The effect of joy on the behavior of cricket spectators: The mediating role of satisfaction. Managing Leisure, 12(1), 43-57.
Liga Portuguesa de Futebol Profissional (2011, June 5). Painel de espectadores. [Web page information] Retrieved from http://www.lpfp.pt/futebol/pages/espectadores.aspx.
Maroco, J. (2010). Análise de equações estruturais: Fundamentos teóricos, software e aplicações. [Structural equation modeling: Theoretical foundations, software and applications] Pêro Pinheiro, Portugal: Report Number.
McDonald, M.A., Sutton, W.A., & Milne, G.R. (1995). TEAMQUAL: Measuring service quality in professional team sports. Sport Marketing Quarterly 4(1), 9-15.
Parasuraman, A., Zeithaml, V.A., & Berry, L.L. (1988). SERVQUAL: A multiple-item scale for measuring customer perceptions of service quality. Journal of Retailing 64(1), 12-40.
Rohm, A. J, Milne, G. R., & McDonald, M. A. (2006). A mixed-method approach for developing market segmentation typologies in the sports industry. Sport Marketing Quarterly, 15(1), 29-39.
Ross, S. (2007). Segmenting fans using brand associations: A cluster analysis. Sport Marketing Quarterly, 16(1), 15-24.
Ross, S., Russell, K., & Bang, H. (2008). An empirical assessment of spectator-based brand equity. Journal of Sport Management, 22(3), 322-337.
Shaw, R. N., & McDonald, H. (2006). Season-ticket holder satisfaction and sponsor-related behavior: evidence of a positive relationship. International Journal of Sports Marketing & Sponsorship, 7(4), 318-325.
Theodorakis, N., & Alexandris, K. (2008). Can service quality predict spectators’ behavioral intentions in professional soccer? Managing Leisure, 13(3), 162-178.
Theodorakis, N., Kambitsis, C., Laios, A., & Koustelios, A. (2001). Relationship between measures of service quality and satisfaction in professional sports. Managing Service Quality, 11(6), 431-438.
Trail, G., & James, J. (2001). The motivation scale for sport consumption: Assessment of the scale’s psychometric properties. Journal of Sport Behavior, 24(1), 108-127.
Woo, K. S. (1998). Using quality perceptions to segment customers in services. Marketing Intelligence and Planning, 16(7), 418-424.
Yoshida, M., & James, J. (2010). Customer satisfaction with game and service experiences: Antecedents and consequences. Journal of Sport Management, 24(3), 338-361.
Zeithaml, V. A., Berry, L. L., & Parasuraman, A. (1996). The behavioral consequences of service quality. Journal of Marketing 60(2), 31-46.
Corresponding author: Rui Biscaia
Faculdade de Motricidade Humana da Universidade Técnica de Lisboa Estrada da Costa, 1495-688 Cruz Quebrada - Portugal