©2013 Science Publication
doi:10.3844/ajassp.2013.1575.1585 Published Online 10 (12) 2013 (http://www.thescipub.com/ajas.toc)
Corresponding Author: Helmi Zulhaidi M. Shafri, Department of Civil Engineering, Faculty of Engineering, Universiti Putra Malaysia, 43400 UPM, Serdang, Selangor, Malaysia
IMAGING SPECTROSCOPY AND
LIGHT DETECTION AND RANGING DATA
FUSION FOR URBAN FEATURES EXTRACTION
1
Mohammed Idrees,
1,2Helmi Zulhaidi Mohd Shafri and
1Vahideh Saeidi
1
Department of Civil Engineering, Faculty of Engineering, Universiti Putra Malaysia, 43400 UPM, Serdang, Selangor, Malaysia
2
Geospatial Information Science Research Centre (GISRC),
Faculty of Engineering, Universiti Putra Malaysia, 43400 UPM, Serdang, Selangor, Malaysia
Received 2013-07-30, Revised 2013-08-21; Accepted 2013-10-28
ABSTRACT
This study presents our findings on the fusion of Imaging Spectroscopy (IS) and LiDAR data for urban feature extraction. We carried out necessary preprocessing of the hyperspectral image. Minimum Noise Fraction (MNF) transforms was used for ordering hyperspectral bands according to their noise. Thereafter, we employed Optimum Index Factor (OIF) to statistically select the three most appropriate bands combination from MNF result. The composite image was classified using unsupervised classification (k-mean algorithm) and the accuracy of the classification assessed. Digital Surface Model (DSM) and LiDAR intensity were generated from the LiDAR point cloud. The LiDAR intensity was filtered to remove the noise. Hue Saturation Intensity (HSI) fusion algorithm was used to fuse the imaging spectroscopy and DSM as well as imaging spectroscopy and filtered intensity. The fusion of imaging spectroscopy and DSM was found to be better than that of imaging spectroscopy and LiDAR intensity quantitatively. The three datasets (imaging spectrocopy, DSM and Lidar intensity fused data) were classified into four classes: building, pavement, trees and grass using unsupervised classification and the accuracy of the classification assessed. The result of the study shows that fusion of imaging spectroscopy and LiDAR data improved the visual identification of surface features. Also, the classification accuracy improved from an overall accuracy of 84.6% for the imaging spectroscopy data to 90.2% for the DSM fused data. Similarly, the Kappa Coefficient increased from 0.71 to 0.82. on the other hand, classification of the fused LiDAR intensity and imaging spectroscopy data perform poorly quantitatively with overall accuracy of 27.8% and kappa coefficient of 0.0988.
Keywords: Data Fusion, Feature Extraction, Urban Mapping, Hyperspectral, LiDAR
1. INTRODUCTION
The geometric expansion of urban population around the world and other geohazard related issues brought the need for sustainable urban planning and management for socioeconomic development and environmental protection into a limelight. Efficient urban management entails having an up-to-date infrastructural database that will enhance informed, timely and cost effective decision making. According to Blaschke (2010), one of the primary aims of remote sensing is to significantly
complexity of spectral and textural information of urban environment (Yu et al., 2009) and the absence of height components limit the amount of information that can be derived from them. Thus, optical sensor data alone lacks the capability of meeting todays’ need for 3D analysis.
In a similar development, progress in Light Detection and Ranging (LiDAR) sensor technology for dense 3D data collection allows the geometrical properties and surface roughness of both natural and man-made objects to be obtained (Guo et al., 2011; Jiangui and Guang, 2011). In fact, LiDAR data and its derived products have become acceptable component of national geospatial database similar to the way orthophotos took over geo database in the 1990 s (Rottensteiner, 2010). The use of LiDAR data has, therefore, enhanced generation of accurate and up-to-date data for urban landscape, infrastructure inventory and vegetation monitoring (Edson and Wing, 2011), which has been the aim of remote sensing professionals.
LiDAR provides good 3D geometry of urban feature and can discriminate distinct patches of the same material covered objects at different height (Chen et al., 2009; Johansen et al., 2010). For example buildings of different heights, road, bare ground and different vegetation cover (Edson and Wing, 2011) can easily be distinguishable in LiDAR image. In addition to these benefits, LiDAR intensity is not affected by shadow and is less affected by natural illumination conditions. Despite these advantages, issues of undersampling, coarse resolution, limited textural information in the laser returns, inability to sharply delineate feature boundaries and poor performance over waterbody (Dong et al., 2009; Mancini et al., 2009) are the major challenges facing complete extraction of urban information from LiDAR data only.
According to Awrangjeb et al. (2010) and Yu et al. (2009), combination of man-made and natural features complicates the extraction of feature using single remote sensing data. Despite the successes (Shafri et al., 2012a; 2012b; Shafri and Zeen, 2011; Taherzadeh and Shafri, 2011) about the use of imaging spectroscopy for urban characterization, the maps produced are insufficient for 3D representation of the urban environment. As a result of this, the concept of data fusion has received the attention of the research community of late. Data fusion technique involves the principle, theory and technology of combining data from different sensors to improve the representation and quality of information extraction (Yang et al., 2010). Data fusion has the advantages of giving better characterization and understanding of the study area, improve feature extraction, improve visual
analysis and provide a base for planning and decision making (Chen et al., 2009; Dong et al., 2009). On the application side, pattern recognition, visual enhancement, object detection and reconstruction, area surveillance, land use and land cover classifications have benefited immensely from data fusion.
Several studies have been done combining satellite image with LiDAR data (Cartus et al., 2012; Edson and Wing, 2011; Hartfield et al., 2011). At the same time, nearly a dozen algorithms have been developed to fuse data from different sensors in order to complement the advantages of the respective sensor for optimal information extraction. Chen et al. (2009) employed hierarchical object oriented algorithm to classify nine kinds of urban land cover objects in Kuala Lumpur city centre by fusing LiDAR and QuickBird data. Dempster-Shafer theory of evidence is another fusion method that have been widely used in remotes sensing, computer vission and pattern recoginition. Typical applications include landslide susceptibility mapping (Althuwaynee et al., 2012), land cover classification (Tabassian et al., 2012) andforest species and height estimation (Mora et al., 2013). Also, Kada and McKinley (2009) fused building footprint and LiDAR data for 3D building reconstruction in the cities of East Berlin and Cologne, while Kabolizade et al. (2010) used improved snake model to automatically extracted building from fusion of aerial image and LiDAR data in the city of Taft, Iran.
In spite of the progress made in research directed at extracting urban features from Multi-sensor data fusion, there are few publications available that combine other sensors with the wealth of information contained in imaging spectroscopy for the same purpose. Buckley et al. (2013) combined hyperspectral and LiDAR data for geological out crop analysis, floodplain classification (Verrelst et al., 2009) and civil engineering structural monitoring (Brook et al., 2010). Most of the other work on LiDAR and imaging spectroscopy data fusion (Colgan et al., 2012; Dalponte et al., 2012; Ghosh et al., 2013; Jones et al., 2010); focus on vegetation applications. The growing interest in urban precise engineering mapping, deformation monitoring and the critical time factor involved in selecting training sites for supervised classification, especially for large areas or during emergency situations, motivates this study. The goal of this study is to evaluate quality of fused data, assess the performance of automatic classification for urban features extraction from fused imaging spectroscopy and LiDAR data and, as well, its influence on 3D modeling for visualization.
2. MATERIALS AND METHODS
2.1. Study Area and Data Description
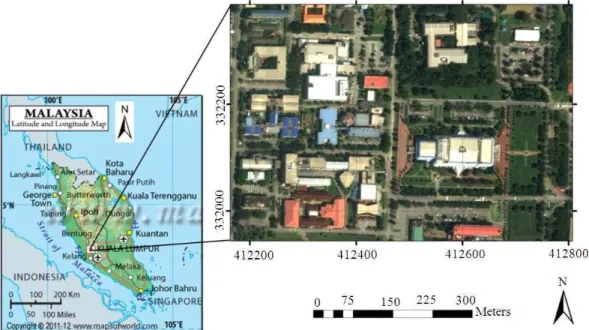
The Advanced Imager Spectrometer for Applications (AISA) and TerraScan LiDAR data collected over part of the University Putra Malaysia (UPM) campus, located in Selangor, Malaysia, were used for this study. The vicinity of the Institute of Advanced Technology (ITMA) (03° 04’N and 101° 43’E) was selected because it fairly represents a characteristic urban setting with a mixture of man-made and natural features (academic buildings, roads, trees and green areas). Figure 1 shows the study area within the campus. AISA-Classic is an airborne hyperspectral imaging spectrometer designed and built by Spectral Imaging Ltd (Specim), Finland. The image consists of 20 spectral bands with a spectral range of 400-970 nm in the visible and near-infrared spectrum of the electromagnetic energy with a spatial resolution of 1m and spectral resolution of 2.9 nm. The image was acquired in 2004 by Aeroscan Precision (M) Sdn Bhd. The LiDAR data were acquired in 2009 using Riegl LiDAR sensor and cannon III camera on-board aircraft flying at an altitude of approximately 5000 m above MSL. The LiDAR data have an average point density of 2.3 points/m2.
2.2. Data Preprocessing
2.2.1. Imaging Spectroscopy Data Processing
Data processing was done in ENVI 4.8. Figure 2
shows the data processing workflow. The area of interest was subset and pre-processing commenced with atmospheric correction using the Internal Average Relative Reflectance (IARR) empirical approach. IARR uses the average pixel radiance for the scene and calculates the ratio of the spectrum for all pixel radiance. This process removes the atmospheric disturbances that affect the data during acquisition. Image to image registration was carried out using the LiDAR derived image to correct for geometric effects. Thereafter, Minimum Noise Fraction (MNF) transformation was carried out to reduce noise and spectral dimensionality in the data and to determine the inherent dimensionality. Unlike Principal Component Analysis (PCA), MNF orders the transformed image according to their noise fraction. The first 10 bands were found to have less noise and were selected for further processing.
The Optimum Index Factor (OIF) is a statistical method for selecting most suitable or favorable three band combinations by ranking the band subset according to their information content. OIF was necessary because of the constraint imposed by the HSI technique to use three or less bands at a time (Dong et al., 2009). OIF was performed in R-programming and bands (2-3-10) were found to be the best (Fig. 3b). Subsequently, unsupervised classification (K-mean algorithm) was used for classification and the accuracy estimated using confusion matrix that produces overall accuracy of 84.6% and kappa coefficients of 0.71.
2.3. LiDAR Data Processing
Fig. 1. The study area covering part of Universiti Putra Malaysia (UPM) main campus extracted from Google Earth
(a) (b)
Fig. 3. Hyperspectral data of the study area (a) CIR composite (b) Selected OIF 3 best bands
(a) (b)
Fig. 4. LiDAR derived products (a) DSM (b) filtered LiDAR intensity image
2.4. Data Fusion
All data fusion techniques combine data from multiple sensors at different levels: decision, feature and pixel (Dong et al., 2009) in order to achieve improved accuracy, identification and extraction of features better than it could be achieved using a single sensor. The complexity inherent in feature extraction in urban areas motivates us to fuse imaging spectroscopy and LiDAR data so as to exploit the hyper-spatial, hyperspectral and the spatial geometrical configuration for accurate and complete mapping of the terrain characteristics. Dong et al. (2009)
bands producing the HSI fused image. Hue expresses the more important wavelength of the pixel and saturation measures the color concentration. The RGB color space is converted to HSI using the expression in Equation 1-3:
2 1
(2R G B)
2 H Arccos
(R G) (R B)(G B)
− − =
− − − − (1)
HSI
2 min f (R,G, B) S
R G B
= −
+ + (2)
HSI
R G B
I
3
+ +
= (3)
where, RGB represents the red, green, blue colour image (Krzywinski, 2011).
The advantages of the HSI include easy implementation, time efficiency, improvement of the spatial resolution and producing near human-eye color perception image output (Dong et al., 2009). However, limitation of HSI to three or less images and distortion of spectral information are the major drawbacks of the method. In this study, imaging spectroscopy and DSM as well as imaging spectroscopy and LiDAR intensity image were fused. The results are presented in Fig. 5. Further, the fused data were classified and the classification accuracy assessed. This produced overall accuracy of 90.2% and kappa coefficients of 0.82 for the former and 27.8% and 0.0988 for the later. Despite the poor result obtained from intensity fused data, visually the data reveals some useful information that could have not been obtained from the respective single sensor. In addition to the 2D visualization, the fused data draped on DSM also provides a clue to uncover some urban spatial pattern and distribution.
2.5. Data Classification
Data classification involves the representation of remote sensing image pixels (digital numbers) into land cover classes. Supervised and unsupervised classification algorithms are the commonly used hard classifiers. In both cases, the algorithms group the DN into themes based on their spectral similarities. For the supervised classification, prior knowledge of the study area, adequate definition of land cover classes and careful selection of training samples are required. However, where timely decision making is a priority (like during emergency situation), it may be tedious and, therefore, ineffective hence, the use of unsupervised classification for this study. We classified four urban features: buildings, pavement, trees and grass from the fused data.
Unsupervised classification is simple and fast without the need for expert knowledge, training sites or ancillary data, meanwhile accuracy may be compromised.
3. RESULTS
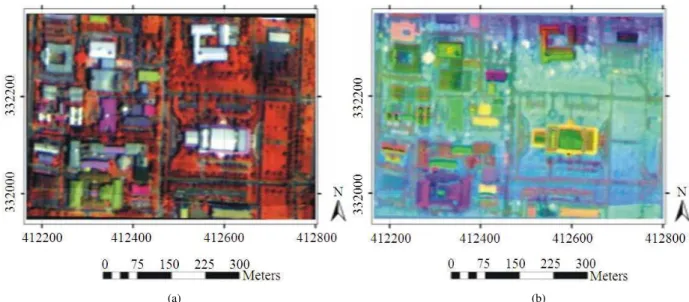
Remote sensing systems contain quantitative information about the urban environment. So, combining information from different sensors can strategically help in assessing the efficiency of complete urban feature extraction. Most especially in the phase of today’s dynamic and complex urban scenarios, time is critical to database updating for timely decision making. This study assesses the effectiveness of unsupervised classification for urban feature extraction from fusion of imaging spectroscopy and LiDAR data through analysis of the following results: fused imaging spectroscopy with DSM and intensity image described (Fig. 5), qualitative assessment of fused imaging spectroscopy and DSM (Fig. 6),classification results (Fig. 7) and 3D view of the classified data to reveal spatial configuration of the study area (Fig. 8).
4. DISCUSSION
(a) (b)
Fig. 5. Fused data (a) imaging spectroscopy + DSM (b) imaging spectroscopy + LiDAR intensity
Fig. 6. Qualitative assessment of the fused data and imaging spectroscopy: (a) imaging spectroscopy, (b) classification of ‘a’, (c) fused data, (d) classification of fused data, (e) 3D view of imaging spectroscopy data and (f) 3D view of the fused data
(b)
Fig. 7. Result of classification. (a) Classified imaging spectroscopy (left) and classified DSM fused data (right) (b) classified intensity fused data (bottom)
Table 1. Classification accuracy assessment result
Imaging spectroscopy IS + DSM IS + Intensity
Overall accuracy 84.60% 90.20% 27.8000%
Kappa coefficient 0.71 0.82 0.0988
Classification of the fused datasets highlight some significant information. Obviously, DSM fused data perform better than fused LiDAR intensity in terms of identification and extracted of urban features. In the classified DSM fused data, trees and grasses are distinctively classified into their respective feature classes without much misclassifications (Fig. 7a-right) contrary to classified imaging spectroscopy data with pronounced misclassification (Fig. 7a-left). Another interesting observation is the classification of buildings with well-defined outline. Moreover, the effect of shadow in the imaging spectroscopy (around the buildings, trees and shadow caused by the cloud in north-east of (Fig. 3a) result into misclassification. This effect is improved with fusion. Meanwhile misclassifications still exist but not as much as it is in single sensor data.
For the fused LiDAR intensity, the classification perform poorly in feature extraction (Fig. 7b). This reflects the extent of spectral distortion (Hartfield et al., 2011; Mao et al., 2009) caused by the low accuracy of the LiDAR intensity and undersampling. Since HSI fusion methodology replaces the intensity (I) band with a higher resolution panchromatic image, LiDAR intensity cannot be assumed to be suitable because the reflected intensity is not calibrated and the laser footprint size is much more smaller than the sampling (Mao et al., 2009). Hence, may not meet the required resolution for the fusion technique and therefore produces noisy classification result. Aside from this factor, Yu et al. (2009) noted that pixel-based classifiers are not designed for classification of multi-sensor data of different accuracies because of their reliance on statistical representation.
Quantitatively, the classification accuracy estimated by confusion matrix indicates better result with respect to the imaging spectroscopy and DSM fused data as shown in Table 1 with an increase in the overall accuracy from 84.6 to 90.2% and the kappa coefficient from 0.71 to 0.82. On the contrary, low accuracy of fused intensity data with a value of 27.8% and kappa coefficient of 0.0988 calls for future investigations.
3D visualization of the fused image is a useful for the identification of different urban features and land scape form. It can be seen in Fig. 8 that features are better discriminated in the classified fused data (Fig. 8b) when draped on the digital terrain model compared to the
classified imaging spectroscopy only (Fig. 8a). The geometric component of LiDAR data impressively enhances the visualization of the shape and size of features which can be used as cues to urban feature extraction. It can be noticed that different roof shapes and structure, vegetation height and crown are clearly distinguishable.
5. CONCLUSION
In this study, hyperspectral and LiDAR data were fused to characterize four urban features: buildings, paved surfaces, trees and grasses from the fused data. The study highlights promising applications the fusion of the two dataset can be applied to. Fusion improves visually and statistically the identification, interpretation and extraction of urban features. Features like roads, trees, buildings can clearly be discriminated from fused data. The advantages include enhancement of data quality, visualization, improved 3D modelling and the potential to differentiate metallic from non-metal roof types. Though unsupervised classification gives good result, it is, however,not optimal for detailed level feature extraction from fused imaging spectroscopy and LiDAR data. Nevertheless, accuracy of the fused data improved compared to hyperspectral data only. From the fused data, four urban features: buildings, paved surfaces, trees and grasses were extracted from the fused data. The study signals optimism in 3D urban landscape mapping fromthe geometric properties provided by LiDAR.More research needs to be focused on multi-sensor data integration algorithms, classification methods and the development of new techniques to exploit information from LiDAR intensity. Meanwhile, the following factors may affect the quality of result obtained in this study: low spatial resolution of LiDAR data and time interval between data acquisition. Improvement in these weaknesses will definitely improve the accuracy of fusion and the resulting classification.
6. ACKNOWLEDGMENT
Bhd is also acknowledged for the provision of the hyperspectral data.
7. REFERENCES
Althuwaynee, O.F., B. Pradhan and S. Lee, 2012. Application of an evidential belief function model in landslide susceptibility mapping. Comput. Geosci., 44: 120-135. DOI: 10.1016/j.cageo.2012.03.003 Arroyo, L.A., K. Johansen, J. Armston and S. Phinn,
2010. Integration of LiDAR and QuickBird imagery for mapping riparian biophysical parameters and land cover types in Australian tropical savannas. Forest Ecol. Manage., 259: 598-606. DOI: 10.1016/j.foreco.2009.11.018
Awrangjeb, M., M. Ravanbakhsh and C.S. Fraser, 2010. Automatic detection of residential buildings using LIDAR data and multispectral imagery. ISPRS J. Photogrammetry Remote Sens., 65: 457-467. DOI: 10.1016/j.isprsjprs.2010.06.001
Blaschke, T., 2010. Object based image analysis for remote sensing. ISPRS J. Photogrammetry Remote Sens., 65: 2-16. DOI: 10.1016/j.isprsjprs.2009.06.004
Brook, A., E. Ben-Dor and R. Richter, 2010. Fusion of hyperspectral images and LiDAR data for civil engineering structure monitoring. Proceedings of the 2nd Workshop on Hyperspectral Image and Signal Processing: Evolution in Remote Sensing, jun. 14-16, IEEE Xplore Press, Reykjavik, pp: 1-5. DOI: 10.1109/WHISPERS.2010.5594872
Buckley, S.J., T.H. Kurz, J.A. Howell and D. Schneider, 2013. Terrestrial lidar and hyperspectral data fusion products for geological outcrop analysis. Comput.
Geosci., 54, 249-258. DOI:
10.1016/j.cageo.2013.01.018
Cartus, O., J. Kellndorfer, M. Rombach and W. Walker, 2012. Mapping canopy height and growing stock volume using airborne lidar, ALOS PALSAR and Landsat ETM+. Remote Sens., 4: 3320-3345. DOI: 10.3390/rs4113320
Chen, Y., W. Su, J. Li and Z. Sun, 2009. Hierarchical object oriented classification using very high resolution imagery and LIDAR data over urban areas. Adv. Space Res., 43: 1101-1110. DOI: 10.1016/j.asr.2008.11.008 Colgan, M., C. Baldeck, J.B. Fret and G. Asner, 2012.
Mapping savanna tree species at ecosystem scales using support vector machine classification and BRDF correction on airborne hyperspectral and LiDAR data. Remote Sens., 4, 3462-3480. DOI: 10.3390/rs4113462
Dalponte, M., L. Bruzzone and D. Gianelle, 2012. Tree species classification in the Southern Alps based on the fusion of very high geometrical resolution multispectral/hyperspectral images and LiDAR data. Remote Sens. Environ., 123: 258-270. DOI: 10.1016/j.rse.2012.03.013
Demir, N., D. Poli and E. Baltsavias, 2009. Detection of buildings at airport sites using images and LiDAR data and a combination of various methods. Institute of Geodesy and Photogrammetry.
Dong, J., D. Zhuang, Y. Huang and J. Fu, 2009. Advances in multi-sensor data fusion: Algorithms and applications. Sensors, 9: 7771-7784. DOI: 10.3390/s91007771
Edson, C. and M.G. Wing, 2011. Airborne Light Detection and Ranging (LiDAR) for individual tree stem location, height and biomass measurements.
Remote Sens., 3: 2494-2528. DOI:
10.3390/rs3112494
Ghosh, A., F.E. Fassnacht, P.K. Joshi and B. Koch, 2013. A framework for mapping tree species combining hyperspectral and LiDAR data: Role of selected classifiers and sensor across three spatial scales. Int. J. Applied Earth Observat. Geoinform., 26: 49-63. DOI: 10.1016/j.jag.2013.05.017
Guo, L., N. Chehata, C. Mallet and S. Boukir, 2011. Relevance of airborne LiDAR and multispectral image data for urban scene classification using Random Forests. ISPRS J. Photogrammetry Remote
Sens., 66: 56-66. DOI:
10.1016/j.isprsjprs.2010.08.007
Hartfield, K.A., K.I. Landau and W.J.D. Van Leeuwen, 2011. Fusion of high resolution aerial multispectral and LiDAR Data: Land cover in the context of urban mosquito habitat. Remote Sens., 3: 2364-2383. DOI: 10.3390/rs3112364
Hofle, B., M. Hollaus and J. Hagenauer, 2012. Urban vegetation detection using radiometrically calibrated small-footprint full-waveform airborne LiDAR data. ISPRS J. Photogrammetry Remote Sens., 67: 134-147. DOI: 10.1016/j.isprsjprs.2011.12.003
Jiang, D., D. Zhuang, Y. Huang and J. Fu, 2011. Survey of multispectral image fusion techniques in remote sensing applications.
Johansen, K., S. Phinn and C. Witte, 2010. Mapping of riparian zone attributes using discrete return LiDAR, Quick Bird and SPOT-5 imagery: Assessing accuracy and costs. Remote Sens. Environ., 114: 2679-2691. DOI: 10.1016/j.rse.2010.06.004
Jones, T.G., N.C. Coops and T. Sharma, 2010. Assessing the utility of airborne hyperspectral and LiDAR data for species distribution mapping in the coastal Pacific Northwest, Canada. Remote Sens. Environ., 114: 2841-2852. DOI: 10.1016/j.rse.2010.07.002 Kabolizade, M., H. Ebadi and S. Ahmadi, 2010. An
improved snake model for automatic extraction of buildings from urban aerial images and LiDAR data. Comput. Environ. Urban Syst., 34: 435-441. DOI: 10.1016/j.compenvurbsys.2010.04.006
Kada, M. and L. McKinley, 2009. 3D building reconstruction from LiDAR based on a cell decomposition approach. University of Stuttgart. Ke, Y., L.J. Quackenbush and J. Im, 2010. Synergistic
use of Quick Bird multispectral imagery and LIDAR data for object-based forest species classification. Remote Sens. Environ., 114: 1141-1154. DOI: 10.1016/j.rse.2010.01.002
Krzywinski, M., 2011. Image color summarizer.
Li, C., L. Zhao and S. Sun, 2010. An adaptive morphological edge detection algorithm based on image fusion. Proceedings of the 3rd International Congress on Image and Signal Processing, Oct. 16-18, IEEE Xplore Press, Yantai, pp: 1072-1076. DOI: 10.1109/CISP.2010.5646902
Mancini, A., E. Frontoni and P. Zingaretti, 2009. Automatic extraction of urban object from multi-sourse aerial data. Polytechnic University of the March.
Mao, J., X. Liu and Q. Zeng, 2009. Building extraction by fusion of LIDAR data and aerial images. Proceedings of the Joint Urban Remote Sensing Event, May 20-22, IEEE Xplore Press, Shanghai, pp: 1-5. DOI: 10.1109/URS.2009.5137631
Mora, B., M.A. Wulder and J.C. White, 2013. An approach using Dempster-Shafer theory to fuse spatial data and satellite image derived crown metrics for estimation of forest stand leading species. Inform. Fus., 14: 384-395. DOI: 10.1016/j.inffus.2012.05.004
Rottensteiner, F., 2010. Automation of object extraction from LiDAR in urban areas. Proceedings of the IEEE International Geoscience and Remote Sensing Symposium, Jul. 25-30, IEEE Xplore Press, Honolulu, HI., pp: 1343-1346. DOI: 10.1109/IGARSS.2010.5652949
Shafri, H.Z.M. and R.M. Zeen, 2011. Mapping malaysian urban environment from airborne hyperspectral sensor system in the VIS-NIR (0.4-1.1 um) spectrum. Res. J. Environ. Sci., 5: 587-594.
Shafri, H.Z.M., E. Taherzadeh, S. Mansor and R. Ashurov, 2012a. Hyperspectral remote sensing of urban areas: An overview of techniques and applications. Res. J. Applied Sci. Eng. Technol., 4: 1557-1565.
Shafri, H.Z.M., N. Hamdan and M.I. Anuar, 2012b. Detection of stressed oil palms from an airborne sensor using optimized spectral indices. Int. J. Remote Sens., 33: 37-41. DOI: 10.1080/01431161.2011.619208 Tabassian, M., R. Ghaderi and R. Ebrahimpour, 2012.
Combining complementary information sources in the Dempster-Shafer framework for solving classification problems with imperfect labels. Knowl.-Based Syst., 27: 92-102. DOI: 10.1016/j.knosys.2011.10.010
Taherzadeh, E. and H.Z.M. Shafri, 2011. Using Hyperspectral remote sensing data in urban mapping over Kuala Lumpur. Proceedings of the Joint Urban Remote Sensing Event, Apr. 11-13, IEEE Xplore
Press, Munich, pp: 405-408. DOI:
10.1109/JURSE.2011.5764805
Trinder, J. and M. Salah, 2011. Disaster change detection using airborne LiDAR. Proceedings of the Surveying and Spatial Sciences Biennial Conference, Nov. 21-25, Wellington, New Zealand, pp: 231-242.
Verrelst, J., G.W. Geerling, K.V. Sykora and J.G. P.W. Clevers, 2009. Mapping of aggregated floodplain plant communities using image fusion of CASI and LiDAR data. Int. J. Applied Earth Observat. Geoinform., 11: 83-94. DOI: 10.1016/j.jag.2008.09.001
Yang, Y., D. Park, S. Huang and N. Rao, 2010. Medical Image fusion via an effective wavelet-based approach. EURASIP J. Adv. Signal Process. DOI: 10.1155/2010/579341
Yin, T., J. Inglada and J. Osman, 2012. Time series image fusion: Application and improvement of STARFM for land cover map and production. Proceedings of the IEEE International Geoscience and Remote Sensing Symposium, Jul. 22-27, IEEE Xplore Press, Munich, pp: 378-381. DOI: 10.1109/IGARSS.2012.6351559