UNDERSTANDING ASYMMETRIES IN ICT ACCEPTANCE
AT INDIVIDUAL USE IN POLAND
Justyna Kondrat
The UTAUT2 theory combined with
attitude, privacy risk, perceived security
Dissertation presented as partial requirement for obtaining
the Master’s degree in Statistics and Information
Management
NOVA Information Management School
Instituto Superior de Estatística e Gestão de Informação
Universidade Nova de LisboaUNDERSTANDING ASYMMETRIES IN ICT ACCEPTANCE
AT INDIVIDUAL USE IN POLAND
THE UTAUT2 THEORY COMBINED WITH ATTITUDE, PRIVACY RISK,
PERCEIVED SECURITY
by
Justyna Kondrat
Dissertation presented as partial requirement for obtaining the Master’s degree in Information Management, with a specialization in Analysis and Risk Management Co Advisors: Tiago Oliveira, PhD Frederico Cruz Jesus, PhDNovember 2016
DEDICATION
I dedicate this work to my close family, who have supported me in every step of this scientific adventure. Mum Czesia, Dad Janek, Grandmothers Jadzia and Stasia, Kasia and Bartek: thank you!
ACKNOWLEDGEMENTS
My sincerest appreciations go to my supervisors: Tiago Oliveira, PhD, and Frederico Cruz Jesus, PhD for their hard work, precious comments and invaluable guidance throghout my research work. I would like to thank Andrzej Smolarczyk, PhD (Białystok University of Technology), and Professor Henryk Wnorowski, PhD (Dean of Faculty of Economics and Management at University of Białystok) for their great help during data collection process. The dream begins with a teacher who believes in you, who tugs and pushes and leads you to the next plateau, sometimes poking you with a sharp stick called "truth". Dan Rather
ABSTRACT
Understanding of the main determinants associated to Internet and Communication Technology acceptance have received attention from international bodies and researchers (Dewan & Chen, 2014; Featherman & Pavlou, 2003; Im, Hong & Kang, 2011; Ming Chi Lee, 2009; Niehaves & Plattfaut, 2014; Shareef, Kumar, Kumar & Dwivedi, 2011; Shin, 2010; Venkatesh & Bala, 2008; Venkatesh, Thong & Xu, 2012a). The reason behind the growing interest in this issue refers to the implications of digital inequalities in social development. Technology access, income, and education seem to be main of many factors that contribute the level of digital inequality. However, providing access or increasing income will still fail to resolve the problem with low level of technology use. There is no guarantee that if more availability is given to the digitally excluded individuals, that they would increase their ICT usage. The individuals’ rational about ICT acceptance or rejection is proportional to the potential risks and opportunities an individual faces at the adoption stage. Currently, understanding the role of users´ perceived risks in relation to attitude, privacy concerns and perceived security while the ICT adoption in Poland is limited. Hence, this work aims to explain the ICT usage behaviour in the specific context of Poland. To test the developed conceptual model, this study uses the data collected in one of Polish medium size cities, the capital city of region Podlasie. The role of attitude, security and privacy issues have as a would‐be predictors of ICT acceptance, is analysed via survey directed to a representative sample of individuals. Based on the theories and previous literature, this study proposes a theoretical model of UTAUT2 theory in conjunction with attitude, privacy, and security model to be used in understanding the ICT adoption process. Theoretical and practical contributions are also outlined. Parties who should be mostly interested in the results of this study are those who provide online services to wide audience and benefit when the audience uses or absorbs the information or services provided online. Therefore, the theoretical and managerial implications of presented results should be in equal interest of: individuals and organisations active online.
KEYWORDS
Digital Divide; Information and Communication Technology; Technology Acceptance; Information Technology Adoption; Attitude; Privacy Risk; Perceived Technology Security; UTAUT2INDEX
1.
Introduction ... 1
2.
Theoretical background ... 3
2.1.
The concept of digital divide ... 3
2.2.
Prior research on digital divide ... 3
2.3.
Measuring ICT adoption at individual level ... 5
2.3.1.
ICT definition ... 5
2.3.2.
Differences between ICT and other specific IT ... 6
2.4.
Adoption models at individual level ... 6
3.
Research model ... 9
4.
Methodology ... 15
5.
Data analysis and results ... 17
5.1.
Measurement model ... 17
5.2.
Structural model and hypotheses testing ... 19
6.
Discussion ... 23
6.1.
Theoretical implications ... 23
6.2.
Managerial and practical implications ... 25
6.3.
Limitations and future research ... 26
7.
Conclusions ... 27
8.
Bibliography ... 28
LIST OF FIGURES
Figure 3.1 – Research model ... 12
Figure 5.1 – Research results (only with direct effects) ... 22
LIST OF TABLES
Table 3.1 – Conceptual model questionnaire ... 12
Table 4.1 – Demographic data of responses ... 16
Table 5.1 – Square root of AVE and factor correlation coefficients ... 17
Table 5.2 – PLS‐loadings and cross‐loadings ... 18
Table 5.3 – Structural model with path coefficients and R‐squares for models with UTAUT2
and UTAUT2 and attitude, privacy risk and perceived technology security ... 20
LIST OF ABBREVIATIONS AND ACRONYMS
ETAM Extended Technology Acceptance Model ICR Internal Consistency Reliability ICT Information Communication Technology IT Information Technology PLS Partial Least Squares SEM Structural Equation Modelling SNS Social Network Services TAM Technology Acceptance Model TPB Theory of Planned Behaviour TRA Theory of Reasoned Actions UTAUT Unified Theory of Acceptance and Use of Technology UTAUT2 Unified Theory of Acceptance and Use of Technology (UTAUT extended)1. INTRODUCTION
The Information Communication Technology (ICT) industry, as per the analysis prepared by European Commission, has an increasingly important contribution to the economic growth of advanced economies. Significant relevance of the ICT industry in the whole economy of a country has been reflected in the European Union’s 2020 Strategy by the Digital Agenda for Europe and Innovation Union initiatives (European Comission, 2010). Undoubtedly, it is due to the fact that new technologies offer multiple opportunities for citizen participation, satisfy the consumer interests (van Dijk & Hacker, 2003), as well as provide ample opportunities for developing online business activities.
The great role of ICT at various levels of its existence has been described briefly by World Bank institution: “ICTs offer major transformational opportunities. They can contribute to enhanced
productivity, competitiveness, growth, wealth creation, poverty reduction and can spur the knowledge‐ based economy. ICTs provide the means by which knowledge is developed, stored, aggregated, manipulated and diffused. ICTs also enable participation in the global economy.” with the special
attention given to undoubted influence of ICT on new jobs creation, economic growth and increased productivity (ITU & InfoDev, 2010). Differences in the material access, cultural, and cognitive resources required to benefit the most from ICT can be characterised as digital inequality phenomena. Since they impact on and may threaten social, economic, and national cohesion, in consequence can lead to unequal distribution of material and immaterial resources, and so will deepen the inequality problem (OECD, 2015). Therefore, the understanding of all the reasons and factors conducive to deepening the digital inequalities and their types, is so crucial to prevent enlargement of digital divide that would favour exclusion of some social groups from the economic and social activity. Individuals from developed and developing countries can equally benefit from the exchange platforms of information and knowledge. Those who have an access can gain more benefit from ICT use, than those who do not. The level of digital literacy and skills that individuals possess to navigate through ICT defines different type (or level) of digital divide. Therefore, it is important to notice that some of the individuals consciously resign from ICT acceptance or stop/reject using the ICT technology after initial acceptance. Hence, it is vital to understand the reasons that stand behind their decision. That could be because of perceived risks associated to ICT use, although technology adoption is accompanied by several opportunities as well. However, the perception of security and privacy online is an important factor. Here comes the balance of potential gains and losses that digitally excluded individual may encounter when considering ICT adoption. It is in the interest and benefit of the whole of society to make sure that those who would accept ICT adoption should have a chance to do so. The aim of this study is to understand aspects of the digital divide problem in Poland. The main research questions point at discovering:
1. What are the drivers of the digital divide of citizens of central European country? 2. What are the main reasons of individual acceptance for ICT in Poland?
The study tries to investigate sensitive reasons for the digital divide phenomena and the risks associated to adoption of ICT as perceived by its users. Individuals naturally protect their personal data (Boss, Galletta, Lowry, Moody & Polak, 2015; Hong & Thong, 2013), and any information they leave in
the Internet against anybody who may want to use it without their permission. Therefore, those who are more aware of the potential ways of wise ICT usage will be using it consciously. On the other hand, those whose risk acceptance is lower, along with a lack of knowledge about safe Internet usage, may tend to refuse to accept ICT. In this context, risk acceptance considers how much of availability an individual can readily give while using ICT and what is theirs risk awareness perception of security and privacy, experienced while using ICT. This work is expected to make important theoretical, and managerial inputs. The contributions are twofold: firstly, study provides insights on ICT acceptance at individual level, and it adds the knowledge about ICT acceptance in the second biggest country of central Europe, and one of ten biggest in whole European continent. Secondly, a better understanding of factors associating an individual´s decision about acceptance for adoption of ICT can help governments to more efficiently engender economic growth with the help of ICT, thus accomplishing the objectives of Europe’s 2020 strategy as expressed in the Digital Agenda for Europe (European Comission, 2010). Various groups of stakeholders (public institutions, companies, educational institutions) would be able to adjust their point of view and the strategy of approaching digitally excluded individuals, in order to bring them closer to the ICT world, and to offer them the services, and products available online. The elimination of digital exclusion represents potential business opportunities for the companies, and helps in wider economic expansion.
In answering the research questions posed above, this study is organised as follows: in section two, the theoretical background of digital divide phenomena is presented; in third section, there is present proposed research model; section four describes methodology used, whereas section five presents the data analysis. The results of the study and conclusions, as well as limitations of this research are presented in last two parts of work.
2. THEORETICAL BACKGROUND
2.1.
T
HE CONCEPT OF DIGITAL DIVIDEDigital divide is a term that illustrates the view that certain individuals are not able to obtain access to personal computers or the Internet due to a variety of factors including race, socio‐economic status, gender, place of residence, level of education, adeptness with technology, and/or social associations (Dewan & Riggins, 2005). The term refers to the gap between people who have access to modern ICT, and those who have restricted access to it. In the past it was mainly referring to lack of a PC and Internet access, however nowadays in general it considers lack of access to the Internet (Mardikyan, Yıldız, Ordu & Şimşek, 2015).
With regard to the Internet, the access is only one aspect of the problem. Other factors such as the quality of connection and related services are also considered. Nowadays the most discussed issue is the availability of quality access at an affordable cost. The digital divide is not indeed a clear single gap which splits a society into two groups (van Dijk, 2006). The idea that some information and communication technologies are vital to quality of civic life is not new (Mansell, 1999). Some researchers (Bruno, Esposito, Genovese, & Gwebu, 2010) suggest that the Internet and other ICTs are somehow transforming society, improving its mutual understanding, eliminating power differentials, realizing a truly free and democratic world society, among other benefits (Mansell & Wehn, 1998). It is fair to say that technology is only as powerful as it is accessible. Broader access brings education, information and an enlightened world community (van Deursen & van Dijk, 2015). Proponents for closing the digital divide include those who argue it would improve literacy, democracy, social mobility, economic equality, and economic growth (Mozelius, 2014). ICT´s technological progress is a driving force behind economic growth, citizen engagement, and job creation, reshaping and strengthening them (United Nations, 2003; World Bank, 2016). Many people stubbornly cling to the belief that digital inequality can be solved by addressing a single factor: technology access (Srivastava & Shainesh, 2015; van Dijk & Hacker, 2003). However, providing the access and creating the conditions for its initial usage is just the beginning of the long journey of breaking the digital divide. It is important to highlight that providing the availability gives no guarantee for continued intention to use ICT (Bhattacherjee, 2001; Viard & Economides, 2014).
2.2.
P
RIOR RESEARCH ON DIGITAL DIVIDEThe literature related to digital divide problem is mostly focused on the sources of the IT exclusion and negative effects of this phenomena. There is not that much said about using ICT adoption models and in particular about the drivers of individuals´ decisions in relation to ICT acceptance. Understanding the perceived risks and opportunities of adoption by individuals in the context of attitude, perceived, security and privacy issues, is a principle objective of this study, and will help in covering this gap in knowledge.
The last few decades of human history are commonly called the Computer Age, Digital Age or Information Age. One of the main characteristics of this period is a shift from traditional industry to an economy based on manipulation of information and effective operating within information society. The opinions about whether a digital divide is a big problem or just an overhyped nonissue seem to be mixed up at earlier times (Compaine, 2001). More than a decade ago, in his book, Compaine presents evidence that by the year 2000, digital divide gaps were rapidly closing without substantive public policy initiatives and spending money from social programs. Literature on the subject of digital divide subject deeply covers various reasons of the existence of this phenomenon. Researchers clearly present factors that contribute to wider gap of digital divide within society and economic environment (Colecchia & Schreyer, 2002). Many solutions are already suggested for overcoming the problem of digital exclusion. Scientists present ideas in order to balance the level of digital inequality (Steyn & Johanson, 2010). Survey studies have indicated that digital inequality exists across a variety of demographic, ethnic and geographic dimensions. It is fair to say that it is a substantial global problem even in developed countries. The results of some researchers´ investigations (Srinuan & Erik, 2011) suggest that scientific articles which examine digital divide issues, concentrate mostly at the individual and country level. Great focus is given to ICT diffusion and adoption issues, as well as public policies and regulations, and e‐government. Technological changes have accelerated transmission and processing of information. The digitalization of information has had a profound impact on the traditional media business. As information is increasingly presented in digital form, businesses across many industries have adapted to capitalize on the Information Age. The companies defined by the Information Age are the ones that know their consumers best, however they have great difficulties in reaching new markets of consumers that are digitally excluded (Lobaugh, Simpson & Ohri, 2015). The production and the diffusion of knowledge are few of main features of contemporary societies (Forman & van Zeebroeck, 2015; Giorgi & Loris, 2015). Nowadays, the outputs of economy of information, are not treated as property that belongs to an individual, but in contrast can be available to everyone, and in this way can offer meaningful opportunities for improving human development everywhere in the world (Benkler, 2006; García‐ Álvarez, 2015) e.g., by public funding, traditional non‐profit organisations.
To better understand the problem, the digital divide question should be reviewed at least on two basic dimensions: internal and external. The internal dimension covers differences in access to new technologies that occur between individuals and social groups of a country. In other words, a unit of analysis at internal level is a society with its digital divide dynamics. On the opposite side, the external dimension covers global aspect of digital divide between countries (continents, integration structures) and consequences that it causes between their international relationships (Porębski, 2014). Deeper disintegration of world economy, social and cultural systems can be a consequence of lack of access to ICT, leaving easy to distinguish areas where the ICT technology has greater vs. marginal meaning (Mecinas Montiel, 2016; Porębski, 2014). However, statistics show that every year the level of digital exclusion on global scale is constantly decreasing. Logically if ICT features more frequent in individual’s daily lives in developing countries then they will not be totally isolated. However it may result in a creation of some sort of system, which will be a certain disadvantage for developing countries in the competition with leader countries of ICT revolution (Porębski, 2014).
Other authors (Fenrich, 2014; Fieseler, Meckel & Müller, 2014) highlight that a deficit of digital competencies does not mean digital exclusion from society life, as long as an individual knows how to
cover up or substitute missing skills (e.g. by asking somebody else for help, or using other sources of information that is stored in the Internet). Following the authors’ words, while studying ICT adoption or rejection, researchers should also consider the impact of other spheres of individual’s life (i.e. if person lives/works alone, if can count on some support from others if necessary). Researchers point out that easier access given to users does not lead automatically to use or adoption of ICT, however it should be seen as one of necessary conditions to fulfil in the adoption process (Bergström, 2015). The acceptance (or rejection) of usage is highly correlated with individual´s ability to understand how systems work, their confidence and trust in new systems, their economic, and social benefits and costs, and with the way in which the innovation fits into cultural norms that currently exist, several examples can be found in works of these authors: Bouwman & van Der Duin (2007), Livingstone & Helsper (2007), McCreadie & Rice (1999), Norris (2001), Tsatsou (2011), van Deursen & van Dijk (2011), and Verkasalo, López‐Nicolas, Molina‐Castillo & Bouwman (2010). One of the issues often referred by scientists is the difficulty in engaging the non‐Internet users, and assuring that they can access online public services, when they have no interest in being digitally connected (Hamdoun et al., 2014). This meaning of digital divide has been already identified by other authors (van Dijk & Hacker, 2003). Van Dijk and Hacker list four barriers of access briefly described below. Following their research, first order of digital divide is related to “motivational access”, which stands for lack of elementary digital experience due to a lack of interest or experienced anxiety or consideration of unattractiveness for new technology. Second order is driven by “material access”, and so lack of physical access to a computer and network connection. Next level of digital inequalities is related to lack of digital skills, “skills access”, caused by inadequate IT education or not sufficient social support. “Usage access”, i.e. lack of significant usage opportunities stands for fourth level of digital divide derived by the researchers (van Deursen & van Dijk, 2015).
2.3.
M
EASURINGICT
ADOPTION AT INDIVIDUAL LEVEL2.3.1. ICT definition
ICT has a complex nature and its multiple applications may be perceived and defined in various different ways (United Nations, 2003). World Bank institution defines ICT as: “Consists of the hardware, software, networks, and media for the collection, storage, processing, transmission and presentation of information (voice, data, text, images), as well as related services. ICT can be split into ICI (refers to physical telecommunications systems and networks (cellar, broadcast, cable, satellite, postal) and the services that utilize them (Internet, voice, mail, radio, and television)) and IT (refers to the hardware and software of information collection, storage, processing, and presentation)” (World Bank, 2013). The definition of ICT considered in this research is following: “ICTs are a complex and heterogeneous set of goods, applications and services used for producing, distributing, processing and transforming information ‐ included in this set are the outputs of industries as diverse as telecommunications, television and radio broadcasting, computer hardware and software, computer services and electronic media (e.g. Internet, electronic mail, electronic commerce, computer games).” (Gender Working Group
in this study are: Internet, e‐mail, e‐banking, e‐commerce (e‐business), e‐learning (e‐school), e‐health, e‐government (e‐society), e‐games, e‐recruitment (e‐employment), e‐agriculture, e‐security, social networks (e‐interaction), interest groups (forums).
2.3.2. Differences between ICT and other specific IT
While talking about digital divide, clear distinction must be made in relation to ICT from generic Information Technologies (IT). Researchers, such as Farmer and Farmer (2013) define IT as “the
knowledge, skills and understanding needed to use such things as computers, keyboards, ILS systems etc.”. On the other hand ICT is considered as “an umbrella term that includes any communication device or application, encompassing: radio, television, cellular phones, computer and network hardware and software, satellite systems and so on, as well as the various services and applications associated with them, such as videoconferencing and distance learning” (Rouse, 2005). Nowadays the
ICT constantly has greater role in information management, collection, analysis, interpretation, and its distribution, which are most important factors of companies’ success (Olszak, 2015).
Summarising the differences, ICT “covers all technical means used to handle information and aid
communication.” (Eurostat, 2016), and in comparison with IT “focuses primarily on communication technologies” (Asabere, Torgby & Gyamfi, 2013). As researchers state, the main difference between
ICT and IT is the impact of modern communication technologies on societies, i.e. the aspect that is included in ICT term, that allowed all people around the world to communicate wirelessly with all “across the world as if they were living next door.” (Asabere et al., 2013).
2.4.
A
DOPTION MODELS AT INDIVIDUAL LEVELUser’s acceptance of technology continues to be an important issue despite the fact that reliance on computerized systems, and constant emergence of new technologies is nowadays a fact (Yi & Hwang, 2003). The outcome of one´s behaviour intention, i.e. potential ICT acceptance is measured in this research using a questionnaire in which Polish individuals were asked about their motivation and plans to use the ICT during the upcoming months. Evaluation of usage behaviour is then analysed, based on the responses related to frequency of ICT use. The study tested the results of analysis using the UTAUT2 in conjunction with attitude, security and privacy aspects.
Amongst first and well known individual‐level models that examine user’s intentions to use technological innovations, considering theirs beliefs, attitudes and intentions were: Theory of Reasoned Actions (TRA) (Fishbein & Ajzen, 1975) and Theory of Planned Behaviour (TPB) (Netemeyer, Ryn & Ajzen, 1991). The Technology Acceptance Model (TAM) (Davis, 1989) is also one of the first models which in a very powerful way predict users acceptance technology. TAM theory assumes that an individual’s usage of technological innovations depends on behavioural intention, which is influenced by the usefulness and ease of use. However the analysis of empirical research using TAM
shows that results are not totally consistent or clear, since the model explains about 40% of system’s usage and could suggest that some other, potentially significant factors could be investigated (Legris, Ingham & Collerette, 2003). Later on, researchers: Venkatesh and Davis (2000) extended TAM to include other important determinants that influence perceived usefulness and perceived ease of use to form the Extended Technology Acceptance Model (ETAM). More recent studies of Yi and Hwang (2003) on intrinsic motivation and self‐efficacy in social psychology suggest there are several factors (i.e. goal orientation, enjoyment, and self‐efficacy) that play very important roles in determining people’s behaviour. However, all those theories did not fully explore the issue of resistance that may stop an individual user from adopting new technologies.
The detailed synthesis of eight existing models of technology acceptance, has been performed by researchers Venkatesh, Morris, Davis, and Davis (2003) and resulted in the composition of the Unified Theory of Acceptance and Use of Technology (UTAUT). The UTAUT model explored the elements from the following models: Theory of Reasoned Action, Motivational Model, Theory of Planned Behaviour, a combined TAM and TPB model, Model of PC Utilization, Innovation Diffusion Theory and Social Cognition Theory. The conjunction of those models resulted in eight UTAUT constructs: Performance Expectancy, Effort Expectancy, Attitude towards using technology, Social influence, Facilitating conditions, Self‐efficacy, Anxiety and Behavioural intention to use the system. The UTAUT model has been widely used and tested in various research projects and on diversified geographical locations, equally in developed and developing countries. UTAUT is one of the most popular models used by scientists who investigate technology adoption. The model has been used in a variety of technological settings, and has also been applied in various research studies. Despite its universality and generalizability of contribution, scientists were examining UTAUT model in many new contexts, e.g.: technologies, new user populations, cultural settings while adding or eliminating some subsets of the constructs of UTAUT model (Venkatesh et al., 2012a). Extended investigation on UTAUT model has helped in working out the previously unconsidered factors, identifying key additional constructs and relationships that result in building UTAUT2 model. UTAUT2 is basically composed from the original UTAUT model constructs plus three newly incorporated constructs by Venkatesh et al. (Venkatesh et al., 2012a). The author of the model claimed that those additional elements to the original model help to highlight significant changes in the variance disclaimed by behavioural intention and technological use (Raman & Don, 2013).
The main postulates of strain theory (Merton, 1938) try to create a link between an individuals´ decision and their feeling of desire for innovation, i.e. in the context of this work, the desire of acceptance for use of ICT. On the other side, it is worth mentioning the theory, states there is still some reluctance towards new technologies, mainly due to risk concerns and trust related issues (Ming C. Lee, 2009). All of the afore mentioned models contain some limitations (Ooi & Tan, 2016). This fact obviously drove researchers to further investigate and develop a model which will better explain the problem of technology acceptance. Some individuals want to use new technology although refuse it due to the technology’s unreliable quality, high price or limited content (Bernstein & Singh, 2008). Despite that, some of the studies that are based on ETAM, explore the adoption barriers linked to privacy concerns (Wu & Wang, 2005) and computer anxiety (Venkatesh & Bala, 2008).
TRA model and its general causalities have been also used in investigation of social networking context and attempts to understand the adoption patterns. In practice individuals very often overlook the issues related to security and privacy (Chen, Beaudoin & Hong, 2016; Shin, 2010). Despite the growing
and each time more vital privacy concerns very few studies explore the issues mentioned above (Fogel & Nehmad, 2009). The privacy concerns have been lastly widely framed (Chen et al., 2016; Moscardelli & Divine, 2007; Youn, 2005) in Protection Motivation Theory (Rogers, 1975). Similarly trust and its impact on the relationship between users and information systems has been proven to be a factor that heavily influences the usability level of systems (Acemyan & Kortum, 2012). Within ICT environment, researchers (Salisbury, Pearson, Pearson & Miller, 2001) also identify security issues as a dominant barrier of growth of online services and so a blocking point for their acceptance by individuals. Shin’s study on the effects of trust, security and privacy proposed a new model that can be applied in investigation of individual social‐networking technologies acceptance. The model’s foundations link to factors characteristic for TAM: usefulness, easiness of use and enjoyment. Various studies on security (Dewan & Chen, 2014; Linck, Pousttchi & Wiedemann, 2006), perceived privacy (Dwyer, 2007), and perceived trust (Culnan & Armstrong, 1999; Kim, Steinfield & Lai, 2008) served as components of Social Network Services (SNS) model. The SNS model has been built up around the trust as a central concept: as a subsequent variable of perceived security and privacy, and as an antecedent variable to individual’s attitudes (Shin, 2010).
3. RESEARCH MODEL
Several theories exist and help in understanding why people adopt the use of new technologies. It is easy to deduct from the most popular theories (UTAUT (Venkatesh et al., 2003); TAM (Davis, 1989) and Diffusion of Innovations Theory (Rogers, 2003), UTAUT2 (Venkatesh et al., 2012a), and related literature that any new technology acceptance is strongly related to socio‐demographic factors. However socio‐cultural impacts are rarely debated in evidenced‐based literatures. The following words of some researchers: “new ICTs will neither help development nor bridge the economic or other gaps,
but rather mirror and extend existing divides” show this (Steyn & Johanson, 2010). Socio‐cultural
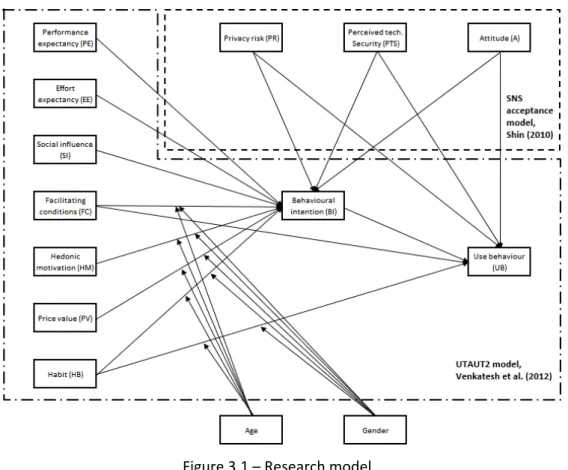
factors are underpinned by region and so researchers have found that together they shape perception of ICT and have high impact on an acceptance or rejection decision about its adoption (Steyn & Johanson, 2010). An individual´s decision in relation to the ICT adoption process usually is supported by the base of the initial knowledge available before the proper use of an innovation (Rogers, 2003). As Rogers sets, the rejection can occur at any stage of the process, however it is more likely to happen if the initial knowledge is not provided well and in sufficient form. To answer the research questions stated earlier, a research model composed by UTAUT2 (Venkatesh et al., 2012a) in conjunction with constructs from SNS acceptance model is developed. The UTAUT2 aims to explain technology acceptance based on eight, distinct determinants, which were deducted from similar type of research models, designed to explain information system usage behaviour. The UTAUT2 is composed by following constructs: performance expectancy, effort expectancy, social influence, facilitation conditions, hedonic motivation, price value, habit. Briefly, performance expectancy (PE) presents the level of benefits to the ICT user while performing certain activities online; effort expectancy (EE) is associated with the simplicity of ICT usage; social influence (SI) reflects how important others (important to the user) believe that the user should use ICT technology; facilitating conditions express user´s perception of the resources and support that is available to perform a behaviour related to ICT usage; hedonic motivation stands for the fun or pleasure that user gathers from ICT usage; price value portrays a special compromise between perceived benefits that come from ICT usage vs. monetary cost associated to the usage; habit in this context measures the extent to which users perform ICT usage automatically. Therefore, according to UTAUT2 model: performance and effort expectancy, social influence, hedonic motivation, and price value are influencing behavioural intention to use the ICT technology. On the other hand behavioural intention, facilitating conditions and habit determine technology use (Venkatesh et al., 2012a).
The SNS acceptance model has been built up on four core constructs: attitude, perceived security, perceived privacy, and trust. The cognitive as well as affective attitudes as primary influencing factors have been integrated into the model (Shin, 2010). Perceived security as a model’s construct should be interpreted as a factor that helps user to assess if the ICT environment is perceived as a risk‐free, since there is a difficult combination of ICT usage and safety of activities performed online. It defines user’s perception of security while using the ICT services. In the context of this study, perceived privacy risk can be described as a control over the: flow, exchange, transfer of information a user leaves online while using ICT tools. Attitudes, according to this research relate to user´s positive or negative feelings while using ICT (Shin, 2010). Therefore, according to UTAUT2 and SNS models, the hypotheses are as follows:
Performance expectancy (PE) reflects individuals’ perception of performance improvement if using ICT. Users expect that their tasks, objectives, or better productivity is achieved quicker if they use ICT. Hence, H1. The influence of Performance Expectancy (PE) on Behavioural Intention (BI) will be positive. Effort expectancy (EE) relates to a degree of easiness associated with ICT usage. If users feel that while using ICT they do not encounter any major issues and they can use it consciously, more likely they will have higher expectation of gaining the expected performance (Zhou, Lu, & Wang, 2010). Hence, H2. The influence of Effort Expectancy (EE) on Behavioural Intention (BI) will be positive.
Opinions and comments of people who closely interact with users i.e. family, friends, relatives, superiors have significant impact at users’ intention to adopt ICT (Venkatesh et al., 2003). Hence, H3. The influence of Social Influence (SI) on Behavioural Intention (BI) will be positive. Older users, especially of female gender tend to face more problems in dealing with new technologies (Niehaves & Plattfaut, 2014). The importance of help, available resources and skills needed to use ICT impact users’ willingness to adopt ICT. However this impact is particularly different for several groups of users: younger vs. older, while younger ones are more likely to overcome the issues, and men vs. women, while men are more willing to dedicate more effort in overcoming encountered difficulties (Venkatesh, Thong & Xu, 2012b). Hence,
H4a. The influence of Facilitating Conditions (FC) on Behavioural Intention (BI) will be positive, and moderated by Age and Gender, such that it will be stronger for older individuals and women. H4b. The influence of Facilitating Conditions (FC) on Use Behaviour (U) will be positive, and moderated by Age and Gender, such that it will be stronger for older individuals and women. Hedonic motivation (HM) relates to the differences of user’s openness to innovation, novelty seeking. Young men tend to express greater tendency in following new trends and absorption of innovative solutions, tools, technologies (Wu & Wang, 2005). Hence,
H5. The influence of Hedonic Motivation (HM) on Behavioural Intention (BI) will be positive, and moderated by Age and Gender, such that it will be stronger for younger individuals and men.
Price of products or services have different impact on users’ decisions. Women tend to be more careful and responsible in spending money, since the monetary value brings higher importance to them, and with age they are more cost conscious (Venkatesh et al., 2012b). They will be much less willing to purchase an expensive ICT as the price value they would assign to it is lower than in case if it would be priced by men. Hence, H6. The influence of Price Value (PV) on Behavioural Intention (BI) will be positive, and moderated by Age and Gender, such that it will be stronger for older individuals and women. Repeated activity or performance can lead to well established routine or habit of behaviour performing (Ajzen & Fishbein, 2000). Habit (HB) can be perceived as a determinant that highly influences users’
decision about ICT acceptance and actual use. Older men tend to rely more on their habitual actions, learned schemes and routines (Venkatesh et al., 2012b). Hence,
H7a. The influence of Habit (HB) on Behavioural Intention (BI) will be positive, and moderated by Age and Gender, such that it will be stronger for older individuals and men.
H7b. The influence of Habit (HB) on Use Behaviour (U) will be positive, and moderated by Age and Gender, such that it will be stronger for older individuals and men. Following the UTAUT2 base theory, behavioural intention (BI) construct should have an important and significant influence on technology use (Venkatesh et al., 2003). Its impact will be positive. Hence, H8. Behavioural intention (BI) will have a significant and positive influence on Use Behaviour (U). Privacy risk (PR) relates to the perceived level of identifiability of information processed by user via ICT. Is strongly related to perception of user’s control of their personal information (Metzger, 2006). Depending on how strongly users believe that ICT protects their privacy, their overall regard to it is more positive, and so positively influence behavioural intentions and use behaviour towards it (Shin, 2010). Hence, H9a. The influence of Privacy Risk (PR) on Behavioural Intention (BI) will be positive. H9b. The influence of Privacy Risk (PR) on Use Behaviour (U) will be positive.
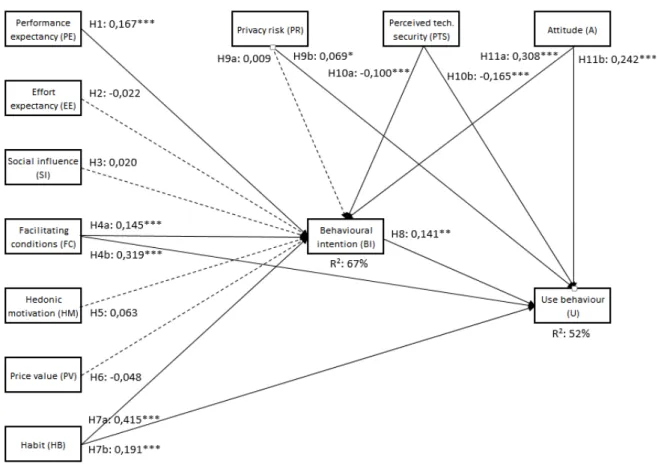
Perceived technology security (PTS) represents the level of safety guaranteed by ICT if sensitive information is provided by users (Cheng, Lam & Yeung, 2006). More secure feelings in respect of ICT usage translate to more positive intention towards technology use and behavioural intention. Hence, H10a. The influence of Perceived Security (PTS) on Behavioural Intention (BI) will be positive. H10b. The influence of Perceived Security (PTS) on Use Behaviour (U) will be positive. Following Theory of Reasoned action, the attitude relates to the users feelings about performing tasks via ICT and their settled way of thinking about ICT reflected in their behaviour (Shin, 2010). The attitude (A) positively impacts on behaviour use and intention. Importantly, attitude is malleable (Ajzen, 2005) i.e. it may change over time (Foltz, Newkirk & Schwager, 2016). Hence, H11a. The influence of Attitude (A) on Behavioural Intention (BI) will be positive. H11b. The influence of Attitude (A) on Use Behaviour (U) will be positive. The above hypotheses result in following conceptual model, presented in Figure 3.1.
Figure 3.1 – Research model
All model’s constructs with associated to them items that helped in building the research model are presented in Table 3.1.
Table 3.1 – Conceptual model questionnaire
Constructs Code Items Source
Performance Expectancy
(PE)
PE1 I find ICT useful in my daily life. (Venkatesh
et al., 2012a) PE2 Using ICT increases my chances of achieving things that are important to me. PE3 Using ICT helps me accomplish things more quickly. PE4 Using ICT increases my productivity. Effort Expectancy (EE)
EE1 Learning how to use ICT is easy for me. (Venkatesh
et al., 2012a) EE2 My interaction with ICT is clear and understandable. EE3 I find ICT easy to use. EE4 It is easy for me to become skilful at using ICT. Social Influence (SI)
SI1 People who are important to me think that I should use ICT. (Venkatesh et al., 2012a) SI2 People who influence my behaviour think that I should use ICT. SI3 People whose opinions that I value prefer that I use ICT. Facilitating Conditions (FC) FC1 I have the resources necessary to use ICT. (Venkatesh et al., 2012a) FC2 I have the knowledge necessary to use ICT. FC3 ICT is compatible with other technologies I use. FC4 I can get help from others when I have difficulties using ICT.
Constructs Code Items Source Hedonic Motivation (HM) HM1 Using ICT is fun. (Venkatesh et al., 2012a) HM2 Using ICT is enjoyable. HM3 Using ICT is very entertaining. Price Value (PV) PV1 ICT is reasonably priced. (Venkatesh et al., 2012a) PV2 ICT is a good value for the money. PV3 At the current price, ICT provides a good value. Habit (HB) HB1 The use of ICT has become a habit for me. (Venkatesh et al., 2012a) HB2 I am addicted to using ICT. HB3 I must use ICT. HB4 Using ICT has become natural to me. Behavioural Intention (BI)
BI1 I intend to continue using ICT in the future. (Venkatesh
et al., 2012a) BI2 I will always try to use ICT in my daily life. BI3 I plan to continue to use ICT frequently. Behavioural Intention (BI)
BI1 I intend to use ICT in the next 3 months. (Bjoern
Niehaves & Plattfaut, 2013) BI2 I predict I would use ICT in the next 3 months. BI3 I plan to use ICT in the next 3 months. Use Behaviour (U) U What is your actual frequency of use for each of the following: (Venkatesh et al., 2012a) a) Internet b) E‐mail c) E‐banking services d) E‐commerce services e) E‐learning services f) E‐health services g) E‐government services h) Social networks (i) Never; to (vii) several times a day. Use Behaviour (U)
U1 On average, how many hours do you use ICT each week? (Venkatesh, Brown, Maruping, & Bala, 2008) U2 How often do you use ICT? (i) Never; to (vii) several times each day. U3 How do you consider the extent of your current ICT use? (i) Non‐use; to (vii) heavy use. Privacy Risk (PR) PR1 The chances of using the ICT and losing control over the privacy of my information is high. (Featherman & Pavlou, 2003) PR2 My signing up and using of ICT would lead me to a loss of privacy because my personal information would be used without my knowledge. PR3 Internet hackers (criminals) might take control of my personal information if I use ICT. Perceived Technology Security (PTS) PTS1 I would feel secure sending sensitive information across ICT. (Cheng et al., 2006) PTS2 ICT is a secure means through which to send sensitive information.
Constructs Code Items Source PTS3 I would feel totally safe providing sensitive information about myself over ICT. PTS4 Overall ICT is a safe place to send sensitive information Attitude (A)
A1 I would have positive feelings towards ICT in general. (Shin, 2010) A2 The thought of using ICT is appealing to me.
A3 It would be a good idea to use ICT.
The original questionnaire form presented to respondents contained a few more questions related to the following constructs: continued intention to use and initial trust. Since both gave in return insignificant results and had neutral impact on the whole model, both have been removed from the final list of model constructs, and from the structure of research model to.
4. METHODOLOGY
All of the measurement items have been assimilated from literature, i.e. UTAUT2 model (Venkatesh et al., 2012b) have been augmented by constructs from SNS acceptance model (Shin, 2010) along with privacy risk construct studied in work of Featherman and Pavlou (2003) and attitude construct adopted after TAM model (Cheng et al., 2006). The target study population covers the individuals living in Poland, and more specifically in Białystok city. The sample covers individuals who work and study at University of Białystok (22% of total number of respondents are from Faculty of Economics and Management) and Białystok University of Technology. To fulfil the objectives of this research work, information and the data needed for deep understanding of ICT acceptance problem was collected via survey directed to the users who are using the ICT services. The questionnaire was provided on the website by free Web hosting service. The survey contained a number of questions asked in English related to intentions, perception, motives that stand behind the acceptance and continued usage of ICT. The research model has been constructed and hypothesis were tested using quantitative data gathered via the study. The survey has been performed by following a two‐step data collection process. First step (pilot survey) aimed in refining the questions and gaining additional comments on the content and structure of the questions. At this step a sample covered by the research contained around 40 users, those users have not been included in the next step. Second step i.e. proper data collection (402 users), with reviewed research questions, have been used in the work analysis, model construction and hypothesis testing. Most of the items of the survey (see Table 3.1) have been measured using seven‐point range scale (where “1” – stands for “totally disagree”, “7” – “totally agree“), with the exception to age (measured in years), and gender (it was a dummy variable where “1” stands for males, and “0” for females). Usage behaviour items were investigating the frequency of use of particular ICTs (therefore “1” was representing an answer of non‐usage: “never”, while “7 “several times a day”). Use construct was gathering information about number of hours spent weekly on ICT usage, as well as about its frequency.
The first stage of data collection process began with a pilot survey. It was performed in May 2016, 31 individuals had participated in it. That helped in testing the questions included in the survey, some feedback has been gathered about the way and the form in which questions have been asked, and also potential issues have been identified in relation to the survey. Comments around phrasing the questions, and overall structure of survey have been taken into account before launching the main survey with a different set of population. The pilot survey helped to identify a lack of few important questions that were collecting the information about demographic characteristics of tested population. The data from the pilot survey has not been included in the results of the main survey. The questionnaire was provided to the sample group (of around 1000 people) via email which contained a link to the online survey. A total of 402 university students have responded and participated in the main survey. The entire number mentioned above has been achieved during one week since the survey has been launched.
Demographic data characteristics are presented in Table 4.1. Majority of survey respondents were females, the average age of whole population was 22 years, usually with the education obtained at high school or at bachelor degree level. Those users’ average household income does not exceed
3700zł, so no more than around 855€ (assuming 1€ is worth about 4.33zł, exchange rate as at 21/10/2016 provided by National Polish Bank www.nbp.pl). Table 4.1 – Demographic data of responses On average the users spent around 18 hours weekly using ICT, and they have considered the intensity of using was on average at fifth level of 7‐point range scale (where 1 means “non‐use” and 7 “heavy use”). Consequently, respondents have indicated the frequency of ICT use which on average also has been set up between 5 and 6 point of 7‐point Likert scale (where for 1 – “ICT is never used”, 7 – “several times each day”).
Measure Value Frequency %
Gender Male 189 47% Female 213 53% Age Below 21 159 40% Between 22 and 26 222 55% Between 27 and 31 14 3% Over 32 7 2% Education High School 180 45% Bachelor degree 184 46% Master degree 35 9% Doctor degree 3 1% Professional status Student 351 87% Employed/Self‐employed 43 11% Other/Unemployed 4 1% Don’t know/don’t want to answer 4 1% Average monthly household income less than 1850zł 74 18% between 1850zł and 3700zł 94 23% between 3700zł and 5550zł 55 14% between 5550zł and 7400zł 29 7% more than 7400zł 29 7% Don’t know/don’t want to answer 121 30%
5. DATA ANALYSIS AND RESULTS
Structural Equation Models (SEM), more specifically, Partial Least Squares (PLS) method have been used to test the measurement model and hypothesis. Theoretical research model has been tested using variance‐based PLS technique. Smart PLS 2.0 M3 software has been used to calculate the results (Ringle, Wende & Will, 2005). This technique is a statistical technique especially recommended for studying complex models with several constructs that should be taken into account (Chin, 1998). The sample dimension is ten times greater than the maximum number of paths directed to a single construct (Gefen & Straub, 2005), which is an one more argument in favour of using the PLS tool, apart from the fact that the presented earlier model has not been tested in the literature before. The analysis has been done in two steps, as recommended by Anderson and Garbing’s (1988) guideline: reliability and validity assessment of the measurement model followed by the assessment of structural model and hypothesis testing.
5.1.
M
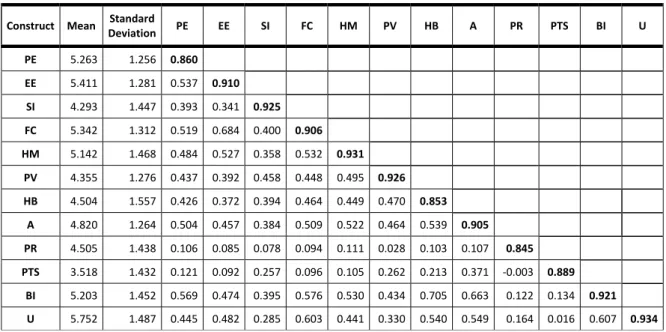
EASUREMENT MODELThe measurement model was assessed for construct reliability, indicator reliability, convergence validity and discriminant validity. The model results including information about reliability, validity, correlations, and factor loadings are presented in Table 5.1 and Table 5.2.
Table 5.1 – Square root of AVE and factor correlation coefficients
Construct Mean Standard
Deviation PE EE SI FC HM PV HB A PR PTS BI U
PE 5.263 1.256 0.860 EE 5.411 1.281 0.537 0.910 SI 4.293 1.447 0.393 0.341 0.925 FC 5.342 1.312 0.519 0.684 0.400 0.906 HM 5.142 1.468 0.484 0.527 0.358 0.532 0.931 PV 4.355 1.276 0.437 0.392 0.458 0.448 0.495 0.926 HB 4.504 1.557 0.426 0.372 0.394 0.464 0.449 0.470 0.853 A 4.820 1.264 0.504 0.457 0.384 0.509 0.522 0.464 0.539 0.905 PR 4.505 1.438 0.106 0.085 0.078 0.094 0.111 0.028 0.103 0.107 0.845 PTS 3.518 1.432 0.121 0.092 0.257 0.096 0.105 0.262 0.213 0.371 ‐0.003 0.889 BI 5.203 1.452 0.569 0.474 0.395 0.576 0.530 0.434 0.705 0.663 0.122 0.134 0.921 U 5.752 1.487 0.445 0.482 0.285 0.603 0.441 0.330 0.540 0.549 0.164 0.016 0.607 0.934 Notes: 1. PE (Performance Expectancy); EE (Effort Expectancy); SI (Social Influence); FC (Facilitating Conditions); HM (Hedonic Motivation); PV (Price Value); HB (Habit); A (Attitude); PR (Privacy Risk); PTS (Perceived Technology Security); BI (Behavioural Intention); U (Use) 2. Diagonal elements are square root of AVEs, and off‐diagonal elements are correlations
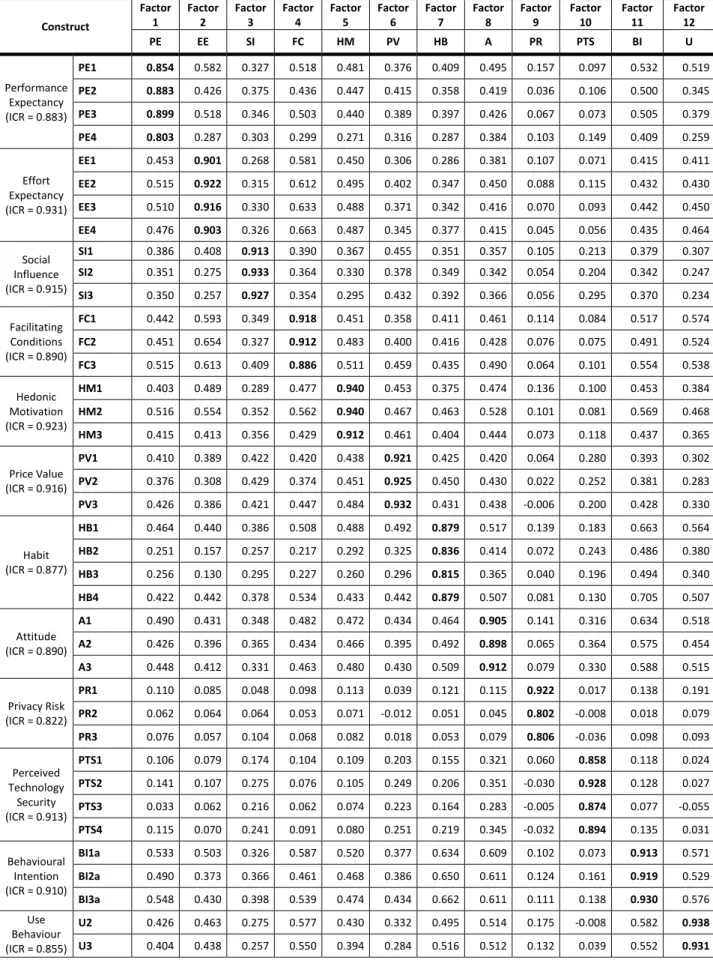
Table 5.2 – PLS‐loadings and cross‐loadings Construct Factor 1 Factor 2 Factor 3 Factor 4 Factor 5 Factor 6 Factor 7 Factor 8 Factor 9 Factor 10 Factor 11 Factor 12
PE EE SI FC HM PV HB A PR PTS BI U
Performance Expectancy (ICR = 0.883) PE1 0.854 0.582 0.327 0.518 0.481 0.376 0.409 0.495 0.157 0.097 0.532 0.519 PE2 0.883 0.426 0.375 0.436 0.447 0.415 0.358 0.419 0.036 0.106 0.500 0.345 PE3 0.899 0.518 0.346 0.503 0.440 0.389 0.397 0.426 0.067 0.073 0.505 0.379 PE4 0.803 0.287 0.303 0.299 0.271 0.316 0.287 0.384 0.103 0.149 0.409 0.259 Effort Expectancy (ICR = 0.931) EE1 0.453 0.901 0.268 0.581 0.450 0.306 0.286 0.381 0.107 0.071 0.415 0.411 EE2 0.515 0.922 0.315 0.612 0.495 0.402 0.347 0.450 0.088 0.115 0.432 0.430 EE3 0.510 0.916 0.330 0.633 0.488 0.371 0.342 0.416 0.070 0.093 0.442 0.450 EE4 0.476 0.903 0.326 0.663 0.487 0.345 0.377 0.415 0.045 0.056 0.435 0.464 Social Influence (ICR = 0.915) SI1 0.386 0.408 0.913 0.390 0.367 0.455 0.351 0.357 0.105 0.213 0.379 0.307 SI2 0.351 0.275 0.933 0.364 0.330 0.378 0.349 0.342 0.054 0.204 0.342 0.247 SI3 0.350 0.257 0.927 0.354 0.295 0.432 0.392 0.366 0.056 0.295 0.370 0.234 Facilitating Conditions (ICR = 0.890) FC1 0.442 0.593 0.349 0.918 0.451 0.358 0.411 0.461 0.114 0.084 0.517 0.574 FC2 0.451 0.654 0.327 0.912 0.483 0.400 0.416 0.428 0.076 0.075 0.491 0.524 FC3 0.515 0.613 0.409 0.886 0.511 0.459 0.435 0.490 0.064 0.101 0.554 0.538 Hedonic Motivation (ICR = 0.923) HM1 0.403 0.489 0.289 0.477 0.940 0.453 0.375 0.474 0.136 0.100 0.453 0.384 HM2 0.516 0.554 0.352 0.562 0.940 0.467 0.463 0.528 0.101 0.081 0.569 0.468 HM3 0.415 0.413 0.356 0.429 0.912 0.461 0.404 0.444 0.073 0.118 0.437 0.365 Price Value (ICR = 0.916) PV1 0.410 0.389 0.422 0.420 0.438 0.921 0.425 0.420 0.064 0.280 0.393 0.302 PV2 0.376 0.308 0.429 0.374 0.451 0.925 0.450 0.430 0.022 0.252 0.381 0.283 PV3 0.426 0.386 0.421 0.447 0.484 0.932 0.431 0.438 ‐0.006 0.200 0.428 0.330 Habit (ICR = 0.877) HB1 0.464 0.440 0.386 0.508 0.488 0.492 0.879 0.517 0.139 0.183 0.663 0.564 HB2 0.251 0.157 0.257 0.217 0.292 0.325 0.836 0.414 0.072 0.243 0.486 0.380 HB3 0.256 0.130 0.295 0.227 0.260 0.296 0.815 0.365 0.040 0.196 0.494 0.340 HB4 0.422 0.442 0.378 0.534 0.433 0.442 0.879 0.507 0.081 0.130 0.705 0.507 Attitude (ICR = 0.890) A1 0.490 0.431 0.348 0.482 0.472 0.434 0.464 0.905 0.141 0.316 0.634 0.518 A2 0.426 0.396 0.365 0.434 0.466 0.395 0.492 0.898 0.065 0.364 0.575 0.454 A3 0.448 0.412 0.331 0.463 0.480 0.430 0.509 0.912 0.079 0.330 0.588 0.515 Privacy Risk (ICR = 0.822) PR1 0.110 0.085 0.048 0.098 0.113 0.039 0.121 0.115 0.922 0.017 0.138 0.191 PR2 0.062 0.064 0.064 0.053 0.071 ‐0.012 0.051 0.045 0.802 ‐0.008 0.018 0.079 PR3 0.076 0.057 0.104 0.068 0.082 0.018 0.053 0.079 0.806 ‐0.036 0.098 0.093 Perceived Technology Security (ICR = 0.913) PTS1 0.106 0.079 0.174 0.104 0.109 0.203 0.155 0.321 0.060 0.858 0.118 0.024 PTS2 0.141 0.107 0.275 0.076 0.105 0.249 0.206 0.351 ‐0.030 0.928 0.128 0.027 PTS3 0.033 0.062 0.216 0.062 0.074 0.223 0.164 0.283 ‐0.005 0.874 0.077 ‐0.055 PTS4 0.115 0.070 0.241 0.091 0.080 0.251 0.219 0.345 ‐0.032 0.894 0.135 0.031 Behavioural Intention (ICR = 0.910) BI1a 0.533 0.503 0.326 0.587 0.520 0.377 0.634 0.609 0.102 0.073 0.913 0.571 BI2a 0.490 0.373 0.366 0.461 0.468 0.386 0.650 0.611 0.124 0.161 0.919 0.529 BI3a 0.548 0.430 0.398 0.539 0.474 0.434 0.662 0.611 0.111 0.138 0.930 0.576 Use Behaviour (ICR = 0.855) U2 0.426 0.463 0.275 0.577 0.430 0.332 0.495 0.514 0.175 ‐0.008 0.582 0.938 U3 0.404 0.438 0.257 0.550 0.394 0.284 0.516 0.512 0.132 0.039 0.552 0.931