ORIGINAL ARTICLE
The dynamics of the pulmonary microbiome during
mechanical ventilation in the intensive care unit and
the association with occurrence of pneumonia
Tetyana Zakharkina,
1Ignacio Martin-Loeches,
2Sébastien Matamoros,
1Pedro Povoa,
3Antoni Torres,
4Janine B Kastelijn,
1Jorrit J Hofstra,
5B de Wever,
5Menno de Jong,
6Marcus J Schultz,
1Peter J Sterk,
8Antonio Artigas,
7Lieuwe D J Bos
1,8▸ Additional material is published online only. To view please visit the journal online (http://dx.doi.org/10.1136/ thoraxjnl-2016-209158).
1
Intensive Care, Academic Medical Center, Amsterdam, Netherlands
2Intensive Care, St James
Hospital, Dublin, Ireland
3Intensive Care, Centro
Hospitalar de Lisboa Central, Lisbon, Portugal
4
Department of Pneumology, Hospital Clinic i Provincial, Barcelona, Spain
5Clinical Microbiology,
Academic Medical Center, Amsterdam, Netherlands
6
Department of Microbiology, Academic Medical Center, Amsterdam, Netherlands
7Critical Care Centre,
Corporació Sanitària I Universitaria Parc Taulí— Hospital De Sabadell-Ciber Enfermedades Respiratorias, Sabadell, Spain
8Department of Respiratory
Medicine, Academic Medical Center, Amsterdam, Netherlands Correspondence to Dr Lieuwe DJ Bos, University of Amsterdam, Meibergdreef 9, room M0-127, Amsterdam 1105AZ, The Netherlands; L.d. [email protected] Received 11 July 2016 Revised 7 December 2016 Accepted 10 December 2016 To cite: Zakharkina T, Martin-Loeches I, Matamoros S, et al. Thorax Published Online First: [ please include Day Month Year] doi:10.1136/thoraxjnl-2016-209158
ABSTRACT
Rationale Ventilator-associated pneumonia (VAP) is the most common nosocomial infections in patients admitted to the ICU. The adapted island model predicts several changes in the respiratory microbiome during intubation and mechanical ventilation.
Objectives We hypothesised that mechanical ventilation and antibiotic administration decrease the diversity of the respiratory microbiome and that these changes are more profound in patients who develop VAP.
Methods Intubated and mechanically ventilated ICU-patients were included. Tracheal aspirates were obtained three times a week. 16S rRNA gene sequencing with the Roche 454 platform was used to measure the
composition of the respiratory microbiome. Associations were tested with linear mixed model analysis and principal coordinate analysis.
Measurements and main results 111 tracheal aspirates were obtained from 35 patients; 11 had VAP, 18 did not have VAP. Six additional patients developed pneumonia within thefirst 48 hours after intubation. Duration of mechanical ventilation was associated with a decrease inα diversity (Shannon index; fixed-effect regression coefficient (β): −0.03 (95% CI −0.05 to −0.005)), but the administration of antibiotic therapy was not (fixed-effect β: 0.06; 95% CI −0.17 to 0.30). There was a significant difference in change of β diversity between patients who developed VAP and control patients for Bray-Curtis distances ( p=0.03) and for Manhattan distances ( p=0.04). Burkholderia, Bacillales and, to a lesser extent, Pseudomonadales positively correlated with the change inβ diversity. Conclusion Mechanical ventilation, but not antibiotic administration, was associated with changes in the respiratory microbiome. Dysbiosis of microbial
communities in the respiratory tract was most profound in patients who developed VAP.
INTRODUCTION
Ventilator-associated pneumonia (VAP) is a frequent complication of mechanical ventilation1 and has a considerable morbidity and mortality.2 Microaspiration from oropharyngeal microbes seems to play a role in the aetiology of VAP.3This claim is supported empirically by the effectiveness of topical antibiotics, aimed to prevent pneumonia
through prevention of oral colonisation.4 Notably, the respiratory tract of many intubated and mech-anically ventilated patients gets colonised with microorganisms without development of VAP.5
During the past 10 years the paradigm of a ‘healthy lung is a sterile lung’ was challenged.6–10 The healthy lung appeared to be populated by mul-tiple resident bacterial species, that migrate to the distal airways from the oral cavity.7According to the adapted island model the respiratory microbiome represents a dynamic community, where the equilib-rium point is achieved by the balance between immi-gration and elimination mechanisms.11
Mechanical ventilation is assumed to imbalance this equilibrium due to several factors. On one hand, disabled cough reflex, impaired mucociliary clearance and presence of endotracheal tube (ETT) decrease the bacterial extinction from lower airways. Potential pathogens may cause pneumonia once a certain bacterial load is achieved as a result of the right growth conditions due to an altered lung physiology (decreased pH, presence of sputum).12
Key messages
What is the key question?
▸ Do mechanical ventilation; antibiotic exposure and the development of ventilator-associated pneumonia influence the composition of the respiratory microbiome?
What is the bottom line?
▸ Duration of mechanical ventilation was associated, but exposure to antibiotic therapy was not associated with dysbiosis of the respiratory microbiome and this was related to the development of ventilator-associated pneumonia.
Why read on?
▸ The respiratory microbiome may play an important role in the development of lung disease. This study is thefirst to describe the dynamics of the composition of the microbial communities during mechanical ventilation.
The above-described ecological perspective predicts several changes in the lung microbiome during mechanical ventilation. In this study, we aimed to test the validity of these predictions. Our primary hypothesis (1) was that bacterial diversity lowers with continued endotracheal intubation and mechanical ventila-tion, and as antibiotics are administrated. Our secondary hypotheses were that (2) duration of mechanical ventilation is associated with dysbiosis of the microbiome and (3) that these changes are more profound in patients who develop VAP. We also postulated that (4) bacteria that are relatively independent from the rest of the microbiome in a co-occurrence network are the ones that are recognised as potential pathogenic microorgan-isms, as has been shown for cysticfibrosis previously.13
METHODS Design and setting
This is a post hoc analysis of tracheal aspirates of patients who were originally included in an international multicentre pro-spective observational cohort study of the predictive value of biological markers for development of VAP.14 The study proto-col was reviewed and approved by the Medical Ethical Committee of Parc Tauli, Sabadell, Spain (IRB: 2008/524). Written informed consent was obtained from all patients or their legally authorised surrogates in accordance with local requirements.
Inclusion and exclusion criteria
We recruited patients on invasive mechanical ventilation for a non-infectious cause of respiratory failure between September 2008 and September 2010, without evidence of pneumonia on the chest radiograph at admission to the ICU (ie, absence of new or persistent consolidations). Patients were not receiving antimicrobial therapy within the 5 days preceding ICU admis-sion, even though prophylactic antimicrobial therapy (long-term therapy for the immunocompromised host) was allowed. Patients were expected to require mechanical ventilation for more than 48 hours. Exclusion criteria were age less than 18 years, pregnancy or lactation, fulminant hepatic failure, pan-creatitis and disseminated cancer. Patients expected to die or undergo withdrawal of treatment within 72 hours after enrol-ment were also excluded. We also excluded patients of whom sufficient clinical data or microbiological data were lacking and if less than two airway samples of sufficient quality were avail-able or if they were ventilated for less than 7 days.
Diagnostic definitions and patient selection
Patients were classified into four groups (table 1). VAP was diag-nosed using consensus criteria;15a new and persistent radiographic infiltrate plus at least two of the following criteria: (a) temperature >38°C or <36°C; (b) leucocytes >10 or <4×10³/mm3; (c)
puru-lent tracheal aspirate16but always needed quantitative microbio-logical confirmation to fulfil the diagnosis of ‘VAP’ (>103or >106
colony forming units (CFU)/mL in bronchoalveolar lavage (BAL) fluid or endotracheal aspirate (ETA), respectively. Patients who met these clinical and microbiological criteria, but were intubated and mechanically ventilated for less than 48 hours were classified as having hospital-acquired pneumonia or community-acquired pneu-monia (H/CAP; these patients were not excluded because they did fulfil the criteria for pneumonia at admission). Patients not fulfilling the abovementioned criteria for VAP but of whom microbiological culture revealed presence of bacteria in BAL or ETA were classified as ‘colonised patients without VAP’. Patients not fulfilling the abovementioned criteria for VAP with negative cultures were classi-fied as ‘non-colonised patients without VAP’.
Data and sample collection
Patient demographics, primary (and admission) diagnosis, Simplified Acute Physiology Score II,17 Acute Physiology and Chronic Health Evaluation II score18 and ICU mortality were recorded for all patients. Administrated antibiotics were recorded daily. ETA samples were collected at ICU admission and subsequently twice a week (Mondays–Thursdays or Tuesdays–Fridays). Bronchoscopic BAL was performed on the day of clinical suspicion of VAP. Isolates were characterised by colony morphology and Gram stains. The remaining portions of ETA samples were stored at−80°C.
DNA extraction and amplicon library preparation
Total DNA was extracted from 127 ETA samples using the PowerSoil DNA Isolation kit (Cat. No. 12888-100, MoBio, USA) following the user manual guide. Details on DNA extrac-tion and amplicon library preparaextrac-tion are given in the online supplement.
454-sequencing of bacterial community 16S rRNA gene
Emulsion PCR was performed according to the protocol (emPCR Method Manual—Lib-A SV January 2010) supplied with the GS FLX Titanium XLR 70 Sequencing kit (Roche, Branford, Connecticut, USA) and processed for sequencing on a 454 GS FLX+ (454 Life Science, Branford, Connecticut, USA) according to manufacturer’s instructions (V.02), as published previously.19 Data analysis were performed using the software ‘Quantitative Insights into Microbial Ecology’ (QIIME) V.1.9.20 Reads were removed if they were <200 and >500 nucleotides (nt) in length, if there were mismatches in the barcodes or primers, if ambiguous nucleotides were present or if the read quality score was <25. Chimeric sequences were filtered out using ChimeraSlayer.21 Then we clustered the sequences into operational taxonomical units (OTU’s) based on 97% sequence similarity (Uclust). The resulting OTU table was then condensed by removing all OTUs representing less than 0.005% of the total number of sequences. Rarefaction was done by random subsampling with 2315 reads as threshold. More details can be found in the online supplement. Data were processed with default settings except when stated otherwise. All sequences were submitted to the European Nucleotide Archive under the study submission number PRJEB13056 (required clinical data as supplementalfile).
Data analysis
Statistical analysis was performed in R (V.3.2.3) via the R-studio interface and topological analysis was performed in Cytoscape (V.3.3.0).22The relative abundance table ranked by order and a correlation matrix for the abundances of the selected taxonomic orders were imported into R and used for the downstream ana-lysis. A p value of less than 0.05 was considered significant.
α diversity was expressed as the Shannon index for normal-ised numbers of sequences for each sample. β diversity was given as weighted UniFrac distances and summarised using prin-cipal coordinate (PCo) analysis of Bray-Curtis and Manhattan distances, as these three combined represent most features ofβ diversity.23 Antibiotic exposure and the composition of the respiratory microbiome was visualised per day, per patient. Antibiotics exposure was dichotomised; a patient did or did not receive antibiotics on the day of sampling. The sample size was deemed too small for more indepth analysis of the influence of antibiotics.
Table 1 Patient characteristics
Patients without VAP with non– colonised airways (n=9)
Patients without VAP with colonised airways (n=9)
Patients with VAP (n=11)
Patients with HAP or
CAP (n=6) p Value
Age, years 71 (64–75) 60 (41–76) 53 (38–62) 73 (66.2–77) 0.13
Male, N(%) 5 (55.6) 3 (33.3) 5 (45.5) 4 (66.7) 0.70
APACHE II 23 (19–26) 20 (13–31) 24 (17–30) 26 (24–34) 0.60
SAPS II 51 (45–61) 65 (37–69) 56 (43–72) 44 (20–66) 0.64
Day of event (pneumonia/ colonisation)
4 (2–4) 8 (5–16) 1 (0–1) <0.001
First day of antibiotic therapy 1 (0–1) 1 (0–1) 1 (1–2) 1 (0–5) 0.75
Reason for MV Resp. failure 1 (11.1) 1 (11.1) 2 (18.2) 2 (33.3) 0.82 Shock 2 (22.2) 2 (22.2) 2 (18.2) 0 (0) Coma 5 (55.6) 6 (66.7) 7 (63.3) 3 (50) Other 1 (11.1) 0 (0) 0 (0) 1 (16.7) Culture result Acinetobacter baumannii 0 (0) 2 (18.2) 0 (0) Candida albicans 4 (44.4) 0 (0) 0 (0) Escherichia coli 0 (0) 1 (9.1) 1 (16.7) Enterobacteriaceae 1 (11.1) 0 (0) 0 (0)
Gram negative rods, not further specified 0 (0) 1 (9.1) 0 (0) Haemophilus influenzae 0 (0) 4 (36.4) 2 (33.4) Klebsiella pneumoniae 0 (0) 0 (0) 1 (16.7) Moraxella catarrhalis 1 (11.1) 0 (0) 0 (0) Neisseria meningitidis 1 (11.1) 0 (0) 0 (0) Pseudomonos aeruginosa 0 (0) 0 (0) 1 (16.7) Staphylococcus aureus 2 (22.2) 3 (27.3) 3 (50) Streptococcus pneumoniae 0 (0) 0 (0) 1 (16.7)
ICU length of stay 15 (8–19) 12 (10–19) 21 (17–31) 11 (6–15) 0.05
28 days mortality 2 (22.2) 1 (11.1) 3 (27.3) 3 (50) 0.50
Continuous variables are shown as median with inter quartile range, categorical variables as number with percentages. p Values are generated by Kruskal-Wallis test for continuous variables and by Fisher’s exact test for categorical variables.
The first day of antibiotic therapy is given in this table; more details on what antibiotics were used in the groups can be found in the online supplement.
APACHE, Acute Physiology and Chronic Health Evaluation; CAP, community-acquired pneumonia; HAP, hospital-acquired pneumonia; MV, mechanical ventilation; SAPS, Simplified Acute Physiology Score; VAP, ventilator-associated pneumonia.
Figure 1 Control patients were only included if they were intubated and mechanically ventilated for 7 or more days. Patients with less than two airway samples with DNA of sufficient quality were excluded. H/CAP, hospital or community-acquired pneumonia (admitted without pneumonia but developed pneumonia in thefirst 2 days of mechanical ventilation, thus not fulfilling the criteria for VAP); VAP, ventilator-associated pneumonia.
All sequenced samples were used to study the influence of duration of mechanical ventilation and the administration of antibiotics in a linear mixed effect model. Thefixed-effect inde-pendent variables were the total number of days of mechanical ventilation at the moment of sampling and if a patient received antibiotics or not at the day the sample was taken. α diversity was used as dependent variable. A per-patient random intercept was used, which takes differences between patients at the start of mechanical ventilation into account.
In order to see if the pulmonary microbial composition was different between patients who did and did not develop pneu-monia or were colonised, two clinically relevant time points were selected per patient. Thefirst was the sample taken directly after the start of mechanical ventilation. The second was the last sample taken before extubation, or the first sample taken after VAP diagnosis in those patients who went on to develop VAP. This did not lead to a match in duration of mechanical ventila-tion for the second sample between patients who did and did not develop VAP (5 vs 10 days, p<0.02). Changes between these time points were calculated for the variables of interest (indices ofα and β diversity described above) per patient and a Mann-Whitney U test or a logistic regression model (for multi-variate analyses such as PCo) was used to test statistical signi fi-cant differences between patients who did and did not develop VAP.
To get an insight into the community structure and analyse the interactions between different members we performed the topological analysis by computing a microbial network, calculat-ing Pearson’s and Spearman’s correlation coefficients, and apply-ing Markov cluster algorithm.
PCo analysis using biodiversity indexes generated PCos. Logistic regression was used to test differences in changes in PCos between patients who did and did not develop VAP. Topological analysis was performed using theCoNet plugin of Cytoscape. All analysis parameters were set according to the user manual that was published by Faust et al.24 The final network was visualised with organic layout and treated as undir-ected. Average cluster coefficient, node degree distribution, diameter and other parameters were calculated using NetworkAnalyzer, a built-in Cytoscape plugin. Following this step the network was clustered by Markov cluster algorithm, which is a part ofclusterMaker plugin.
RESULTS
Patient description
Thirty-five patients were included in three hospitals in Spain and Portugal (figure 1). Eleven patients (31%) were classified as having VAP, 9 (26%) as patients without VAP but with colonised airways and 9 (26%) as patients without VAP and without colo-nised airways. Additionally, six patients (17%) that developed pneumonia within the first 48 hours after intubation were included (H/CAP). Table 1 shows the patient characteristics. Twenty-seven patients received antibiotics at some point during their stay in the ICU (also see online supplementary table S1 andfigure S1). A total of 111 samples were sequenced. Details on the sequencing results can be found in the online supplement.
Dynamics in the composition of the microbiome
Online supplementaryfigure S2 in the online supplement shows per patient changes in relative abundances and microbial relative abundance. The cultured pathogen was not always found to be highly abundant in the microbiome as measured by amplicon sequence analysis (see online supplementary table S2).
Change in diversity during mechanical ventilation and antibiotic therapy
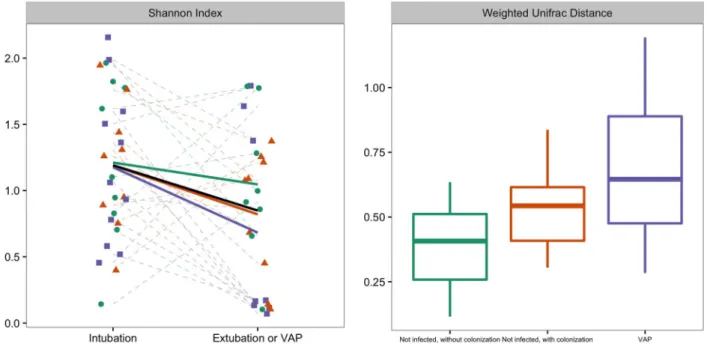
The changes in diversity over time are represented infigure 2; diversity decreased in all but six patients (83%) during mechan-ical ventilation. Duration of mechanmechan-ical ventilation was asso-ciated with a decrease in Shannon diversity (fixed effect regression coefficient (β): −0.03 (95% CI −0.05 to −0.005)), but the administration of antibiotic therapy was not (fixed-effect β: 0.06; 95% CI −0.17 to 0.30). Online supplementary figure S1 shows the antibiotic exposure per patient.
Association of changes in microbiome with the development of VAP
The changes inα diversity did not differ between patients who did and did not develop VAP (figure 2). There was a statistical difference in Weighted UniFrac distance between patients who developed VAP and control patients without colonised airways (figure 2; p=0.02), but not between patients who developed VAP and patients with colonised airways ( p=0.24). β-diversity was further studied by PCo analysis of Bray-Curtis and Manhattan distances. There was a significant difference in change of PCo1 between patients who developed VAP and control patients for Bray-Curtis distances (N=25; p=0.03, respectively; see figure 3), and for PCo1 and PCo2 for Manhattan distances (N=25; p=0.04 and p=0.03, respectively; see also figure 4). Burkholderia and Bacillales (with Staphylococcus aureus as most important species) and, to a lesser extent,Pseudomonadales positively correlated with these PCos (figures 3 and4). The other taxonomic units were nega-tively correlated with the indices (figures 3and4).
Potential pathogens tend to mutually exclude other community members
To reveal ecological interactions within pulmonary communities of intubated and mechanically ventilated patients the OTUs were used as an input for topographical analysis (figure 5). The resulting network had a diameter of 7 with an average clustering coefficient of 0.38 and an average number of neighbours of 4.5. Some bacterial representatives were negatively connected with other species. Among them such confirmed VAP triggers as Pseudomonadales (genera Acinetobacter (topological coeffi-cient=0.22) and Pseudomonas (topological coefficient=0.27)), Bacillales (genus Staphyloccoccus (topological coef fi-cient=0.18)) and Burkholderiales (genus Burkholderia (topo-logical coefficient=0.20)) demonstrated also decreased neighbourhood connectivity. Bacteroidetes (genera Prevotella, Porphyromonas), some Bacillales (genus Gemella) and several other OTUs had the highest connectivity (at least 10 neigh-bours) indicating a high prevalence and cooperative strategy.
DISCUSSION
The data presented in this study support the adapted island model, which predicts changes in the respiratory microbiome after intubation and start of mechanical ventilation. However, antibiotic treatment did not lower the diversity. In line with our hypothesis, we found a difference in the dynamics of the respiratory microbiome between patients who did and did not develop pneumonia during mechanical ventilation. Dysbiosis in the respiratory tract seems to be more profound in patients who develop VAP than in patients who do not develop pneumonia.
Duration of mechanical ventilation was found to be associated with a decrease in α diversity of the respiratory microbiome. These results are in line with previousfindings using molecular
microbial detection methods.25This study differs from previous attempts as we quantified the change in diversity per patient, rather than on a population basis. The spectrum of detected species and their diversity was not associated with antimicrobial treatment, even though all patients were treated with moderate-spectrum or broad-moderate-spectrum antibiotics at some point of mech-anical ventilation. This result supports previous findings obtained in intubated patients.25 Sample collection from the trachea, very close to ETT may explain these findings and we
speculate that the measured microbiome at least partly reflects the biofilm of microbes formed on the surface of the tube. ETTs are known to provide a mechanical barrier between bacteria and host circulatory system and as a consequence may limit the access of antibiotics.26 In addition, bacteria recovered from ETTs show increased antibiotic resistance.27 Another explan-ation is that some classes of antibiotics impact the respiratory microbiome, while others do not. The sample size of this study was insufficient for the separate analysis of different types of Figure 2 Left graph: Changes in diversity between two time points; sample just taken after initiation of mechanical ventilation and before extubation or at the development of VAP, whatever camefirst. Shannon diversity is a measure of α diversity. Right graph: weighted UniFrac distance between these two samples, represented per group. There was a statistical difference in weighted UniFrac distance between patients who developed VAP and control patients without colonised airways ( p=0.02), but not between patients who developed VAP and patients with colonised airways ( p=0.24). The trend lines per patient group are visualised in dark green for non-infected patients without colonisation, in red for non-infected patients with colonisation and in purple for patients who developed VAP. Box plot: the box indicates medians with IQRs and the lines reach the minimum and maximum values. VAP, ventilator-associated pneumonia.
Figure 3 The x-axis shows PCo 1 and the y-axis PCo 2 form Bray-Curtis distances forβ-diversity. The changes per patient are visualised in as dashed lines dark green for non-infected patients without colonisation, in red for non-infected patients with colonisation and in purple for patients who developed VAP. The grey arrows give the relative contribution of the taxonomic units to the PCos. The black arrow gives the mean change for all patients between the two time points. Logistic regression analysis showed that the change of PCo1 was significantly lower in patients who developed VAP ( p=0.03; for PCo2 p=0.13). PCo, principal coordinate; VAP, ventilator-associated pneumonia.
antibiotics. Therefore, we cannot exclude that our conclusion is an oversimplification and that some antibiotics indeed decrease the diversity of the respiratory microbiome. However, we must note that to our best knowledge this selectivity of antibiotics has not been described before for bacteria in the lung, although it has been for the gut.28
The results of this study imply that the dysbiosis in patients with VAP is more profound than in patients who did not develop pneumonia. This is in line with previous studies that report that the respiratory microbiome is disturbed markedly during pneumonia.29 30 We extend the finding of the limited studies done in ICU-patients,25 31 32 as no control group was Figure 4 The x-axis shows PCo 1
and the y-axis PCo 2 form Manhattan distances forβ-diversity. The changes per patient are visualised in as dashed lines dark green for non-infected patients without colonisation, in red for non-infected patients with colonisation and in purple for patients who developed VAP. The grey arrows give the relative contribution of the taxonomic units to the PCos. The black arrow gives the mean change for all patients between the two time points. Logistic regression analysis showed that the change of PCo1 and PCo2 were significantly higher in patients who developed VAP ( p=0.04 and p=0.03, respectively). PCo, principal coordinate; VAP, Ventilator-associated pneumonia.
Figure 5 The microbial network of intubated patients consisted of 84 nodes and 184 edges. Node size is proportional to the neighbourhood connectivity of corresponding OTUs, node colour matches to taxonomical orders. The nodes representing opportunistic pathogens are marked in red. The edges show the associations with FDR q-values below 0.05, with directionality, and more than two supporting pieces of evidence based on correlation and distances between samples. All edges represent significant correlation between OTUs and are coloured in grey when positive and in red when negative. For an exact description of the definitions, see Faust et al.24FDR, false discovery rate; OUT, operational taxonomical unit.
included in those studies and thus it was previously unknown what the‘normal’ dynamics in the respiratory microbiome were during mechanical ventilation. One excellent study that did include a control group was performed in young and elderly non-critically ill patients.29 They found profound differences between non-critically ill patients with and without pneumonia. As in our studies, they used samples obtained from the trachea. Our results imply that dysbiosis also plays a role in the develop-ment of VAP, but other species were involved than in study on CAP.29Steenhuijsenet al found an increase in Lactobacillus and Rothia species, while these were negatively associated with the microbiome we found in patients VAP. We identified Burkholderia, Bacillales (with Staphylococcus aureus as most important species) and to a lesser extend Pseudomonadales as important players in the development of VAP. We feel that this resembles the unique pathogenesis of VAP. Indeed, the few patients who developed pneumonia within thefirst 48 hours of mechanical ventilation, showed very different changes in the pulmonary microbiome than the patients who developed VAP (see online supplementary figures S5 and S6), although these differences could not be quantified due to the small sample size. Several strengths and weaknesses could be noted in the present study. The most important strength was repeated sam-pling. This provides deeper insights into the respiratory micro-biome, since microbial communities are naturally very dynamic and highly interactive.25 33 34This allowed us to investigate the effect of antibiotic use and trends in respiratory microbial com-munity richness and composition during the mechanical ventila-tion. However, this approach did not allow for repeated BAL and therefore ETAs were used. The trachea may not be the ideal location to study pneumonia, as this disease is defined by the infection of the bronchia and alveoli. Indeed, ETA cultures have a limited predictive value for VAP compared with BAL.35 This might also explain that the sequencing results did not corres-pond to the culture results, although this was observed previ-ously in other studies that used BAL fluid as well.25 36 In the adapted island model, the trachea is seen as thefirst island close to the continent (the mouth) and every species present further down should pass here.7 Therefore, it is the most appropriate sample to investigate the influence of mechanical ventilation on the respiratory microbiome. In addition, the constitution of the microbiome in the lung was found to be relatively homogenous in healthy volunteers.6 Another strength is that we combined various statistical approaches and consistently took the between-patient variation into account. Several other studies have per-formed longitudinal analysis of the microbiome,25 37 but the majority assumed independence between sequential samples within the same patients. The most important weakness of this study is the small sample size. This was especially true for the evaluation of the effects of antibiotics on the pulmonary micro-biome. Therefore, we do not reject the hypothesis that antibio-tics influence the pulmonary microbiome, although we can state that the influence is not as overwhelming as might be expected. This is also exemplified in a recent animal study, in which treat-ment of rats with imipenem led to little disturbance.38 Despite the small sample size, a statistically significant effect for duration of mechanical ventilation was found and several differences were identified between patients who did and did not develop pneumonia.
Pathogens that were found in patients with microbiologically confirmed VAP (eg, Acinetobacter, Pseudomonas, Staphylococcus) mutually excluded other representatives of the community, as shown in the topological analysis. This implies that respiratory pathogens should be viewed as aggressors for
the host and for the other bacterial community members. Further research should decipher the metabolic pathways, which are involved in the overgrowth and suppression of the rest com-munity species. This approach together with characterisation of the host adaptive and innate immune factors has a potential to deliver new insights into dysbiosis of the respiratory microbiome during mechanical ventilation. Such mediating effects have recently been shown for Mycoplasma species that, generally, were not considered to be pathogenic.39 Another recent study described that the relative abundance of Bacteroidales species positively correlated with a systematic inflammatory response, measured by the concentration of tumour necrosis factor α in plasma, in patients with acute respiratory distress syndrome (ARDS).38 These two papers exemplify the importance of a integrative approach for future studies, taking microbiome, metabolome and inflammatory mediators into account.
CONCLUSION
The adapted island model correctly predicts loss of diversity and increased relative abundance of well-adapted microbes during intubation and mechanical ventilation. Dysbiosis of the respiratory microbiome is more profound in patients who develop VAP than in those that do not develop pneumonia. This seems to be related positively associated with the relative abun-dance ofBurkholderia, Bacillales (with Staphylococcus aureus as most important species) and, although less convincingly, Pseudomonadales.
Contributors TZ: Literature search, data collection, data analysis, data interpretation and writing. IM-L: Study design, data collection, data interpretation and writing. SM: Data collection, data analysis, data interpretation and writing. PP: Study design, data collection, data interpretation and writing. AT: Study design, data collection, data interpretation and writing. JBK: Data collection, data interpretation and writing. JJH: Data collection, data analysis, data interpretation and writing. BdW: Data collection, data interpretation and writing. MdJ: Data collection, data interpretation and writing. MJS: Study design, data interpretation and writing. PJS: Study design, data interpretation and writing. AA: Study design, data collection, data interpretation and writing. LDJB: Study design, literature search, data collection, data analysis, data interpretation and writing.
Funding Grant by the Instituto de Salud Carlos III (ISCIII) (ISCIII/FIS-PI 12/01815) Spanish Government and Institut Merieux Research grant.
Competing interests None declared. Patient consent Obtained.
Ethics approval Parc Tauli, Sabadell, Spain (IRB: 2008/524).
Provenance and peer review Not commissioned; externally peer reviewed.
REFERENCES
1 Vincent JL, Lobo S, Struelens M. Ventilator associated pneumonia: risk factors and preventive measures.J Chemother2001;13:211–17.
2 Nguile-Makao M, Zahar JR, Français A, et al. Attributable mortality of ventilator-associated pneumonia: respective impact of main characteristics at ICU admission and VAP onset using conditional logistic regression and multi-state models.Intensive Care Med2010;36:781–9.
3 Rello J, Diaz E. Pneumonia in the intensive care unit.Crit Care Med 2003;31:2544–51.
4 Price R, Maclennan G, Glen J. Selective digestive or oropharyngeal decontamination and topical oropharyngeal chlorhexidine for prevention of death in general intensive care: systematic review and network meta-analysis.BMJ2014;348:g2197. 5 De Latorre FJ, Pont T, Ferrer A, et al. Pattern of tracheal colonization during
mechanical ventilation.Am J Respir Crit Care Med1995;152:1028–33. 6 Dickson RP, Erb-Downward JR, Freeman CM, et al. Spatial Variation in the Healthy
Human Lung Microbiome and the Adapted Island Model of Lung Biogeography. Ann Am Thorac Soc2015;12:821–30.
7 Bassis CM, Erb-downward JR, Dickson RP, et al. Analysis of the upper respiratory tract microbiotas as the source of the lung and gastric microbiotas in healthy individuals.MBio2015;6:e00037.
8 Morris A, Beck JM, Schloss PD, et al. Lung HIV Microbiome Project. Comparison of the respiratory microbiome in healthy nonsmokers and smokers.Am J Respir Crit Care Med2013;187:1067–75.
9 Zakharkina T, Heinzel E, Koczulla RA, et al. Analysis of the airway microbiota of healthy individuals and patients with chronic obstructive pulmonary disease by T-RFLP and clone sequencing.PLoS ONE2013;8:e68302.
10 Segal LN, Rom WN, Weiden MD. Lung microbiome for clinicians. New discoveries about bugs in healthy and diseased lungs.Ann Am Thorac Soc2014;11:108–16. 11 Dickson RP, Erb-Downward JR, Martinez FJ, et al. The microbiome and the
respiratory tract.Annu Rev Physiol2016;78:481–504.
12 Chastre J, Fagon JY. Ventilator-associated pneumonia.Am J Respir Crit Care Med 2002;165:867–903.
13 Coburn B, Wang PW, Diaz Caballero J, et al. Lung microbiota across age and disease stage in cysticfibrosis.Sci Rep2015;5:10241.
14 Póvoa P, Martin-Loeches I, Ramirez P, et al. Biomarker kinetics in the prediction of VAP diagnosis: results from the BioVAP study.Ann Intensive Care2016;6:32. 15 Niederman M, Craven DE, Bonten MJ, et al. Guidelines for the management of
adults with hospital-acquired, ventilator-associated, and healthcare-associated pneumonia.Am J Respir Crit Care Med2005;171:388–416.
16 Canadian-Critical-Care-Trials-Group. A randomized trial of diagnostic techniques for ventilator-associated pneumonia.N Engl J Med2006;355:2619–30.
17 Le Gall JR, Lemeshow S, Saulnier F. A new Simplified Acute Physiology Score (SAPS II) based on a European/North American multicenter study.JAMA1993;270:2957–63. 18 Knaus WA, Draper EA, Wagner DP, et al. APACHE II: a severity of disease
classification system.Crit Care Med1985;13:818–29.
19 Hofstra JJ, Matamoros S, van de Pol MA, et al. Changes in microbiota during experimental human Rhinovirus infection.BMC Infect Dis2015;15:336. 20 Caporaso JG, Kuczynski J, Stombaugh J, et al. QIIME allows analysis of
high-throughput community sequencing data. 2011;7:335–6.
21 Edgar RC, Haas BJ, Clemente JC, et al. UCHIME improves sensitivity and speed of chimera detection.Bioinformatics2011;27:2194–200.
22 Shannon P, Markiel A, Ozier O, et al. Cytoscape: a software Environment for integrated models of biomolecular interaction networks.Genome Res 2003;13:2498–504.
23 Barwell LJ, Isaac NJB, Kunin WE. Measuring B-diversity with species abundance data.J Anim Ecol2015;84:1112–22.
24 Faust K, Sathirapongsasuti JF, Izard J, et al. Microbial Co-occurrence Relationships in the Human Microbiome.PLoS Comput Biol2012;8:e1002606.
25 Kelly BJ, Imai I, Bittinger K, et al. Composition and dynamics of the respiratory tract microbiome in intubated patients.Microbiome2016;4:7.
26 Adair CG, Gorman SP, Byers LM, et al. Implications of endotracheal tube biofilm for ventilator-associated pneumonia.Intensive Care Med1999;25:1072–6.
27 Vandecandelaere I, Coenye T. Microbial composition and antibiotic resistance of biofilms recovered from endotracheal tubes of mechanically ventilated patients.Adv Exp Med Biol2015;830:137–55.
28 Francino MP. Antibiotics and the human gut microbiome: Dysbioses and accumulation of resistances.Front Microbiol2016;6:1–11.
29 de Steenhuijsen Piters WAA, Huijskens EGW, Wyllie AL, et al. Dysbiosis of upper respiratory tract microbiota in elderly pneumonia patients.ISME J 2016;10:97–12.
30 Dickson RP, Martinez FJ, Huffnagle GB. The role of the microbiome in exacerbations of chronic lung diseases.Lancet2014;384:691–702.
31 May AK, Brady JS, Romano-Keeler J, et al. A pilot study of the noninvasive assessment of the lung microbiota as a potential tool for the early diagnosis of ventilator-associated pneumonia.CHEST J2015;147:1494.
32 Toma I, Siegel MO, Keiser J, et al. Single-molecule long read 16S sequencing to characterize the lung microbiome from mechanically ventilated patients with suspected pneumonia.J Clin Microbiol2014;52:3913–21.
33 Carmody LA, Zhao J, Kalikin LM, et al. The daily dynamics of cysticfibrosis airway microbiota during clinical stability and at exacerbation.Microbiome2015;3:12. 34 Poretsky R, Rodriguez-R LM, Luo C, et al. Strengths and limitations of 16S rRNA
gene amplicon sequencing in revealing temporal microbial community dynamics. PLoS ONE2014;9:e93827.
35 Luna CM, Sarquis S, Niederman MS, et al. Is a strategy based on routine endotracheal cultures the best way to prescribe antibiotics in ventilator-associated pneumonia?Chest2013;144:63–71.
36 Dickson RP, Erb-Downward JR, Prescott HC, et al. Analysis of culture-dependent vs. culture-independent techniques for the identification of bacteria in
clinically-obtained bronchoalveolar lavagefluid.J Clin Microbiol2014;52:3605–13. 37 Huang YJ, Sethi S, Murphy T, et al. Airway microbiome dynamics in exacerbations
of chronic obstructive pulmonary disease.J Clin Microbiol2014;52:2813–23. 38 Dickson RP, Singer BH, Newstead MW, et al. Enrichment of the lung microbiome
with gut bacteria in sepsis and the acute respiratory distress syndrome.Nat Microbiol2016;1:16113.
39 Nolan TJ, Gadsby NJ, Hellyer TP, et al. Low-pathogenicity Mycoplasma spp. alter human monocyte and macrophage function and are highly prevalent among patients with ventilator-acquired pneumonia.Thorax2016;71:594–600.