Accepted Manuscript
Genetic diversity of Lusitano horse in Brazil using pedigree information
Ricardo António da Silva Faria, António Pedro Andrade Vicente, Rute Isabel Duarte Guedes dos Santos, Amanda Marchi Maiorano, Rogério Abdallah Curi, Luis Artur Loyola Chardulo, Josineudson Augusto Vasconcelos Silva, II
PII: S0737-0806(18)30135-7 DOI: 10.1016/j.jevs.2018.07.009 Reference: YJEVS 2566
To appear in: Journal of Equine Veterinary Science
Received Date: 21 March 2018 Revised Date: 12 July 2018 Accepted Date: 14 July 2018
Please cite this article as: António da Silva Faria R, Andrade Vicente AP, Duarte Guedes dos Santos RI, Maiorano AM, Curi RA, Loyola Chardulo LA, Vasconcelos Silva JA II, Genetic diversity of Lusitano horse in Brazil using pedigree information, Journal of Equine Veterinary Science (2018), doi: 10.1016/ j.jevs.2018.07.009.
This is a PDF file of an unedited manuscript that has been accepted for publication. As a service to our customers we are providing this early version of the manuscript. The manuscript will undergo copyediting, typesetting, and review of the resulting proof before it is published in its final form. Please note that during the production process errors may be discovered which could affect the content, and all legal disclaimers that apply to the journal pertain.
M
AN
US
CR
IP
T
AC
CE
PT
ED
Genetic diversity of Lusitano horse in Brazil using pedigree information 1
2
Autores: Ricardo António da Silva Fariaa*, António Pedro Andrade Vicentec,d,
3
Rute Isabel Duarte Guedes dos Santose,f, Amanda Marchi Maioranoa, Rogério
4
Abdallah Curib, Luis Artur Loyola Chardulob, Josineudson Augusto II
5
Vasconcelos Silvab
6 7
a
Universidade Estadual Paulista (Unesp), Faculdade de Ciências Agrárias e
8
Veterinárias, CEP 14.884-900, Jaboticabal, São Paulo, Brazil
9 b
Universidade Estadual Paulista (Unesp), Faculdade de Medicina Veterinária e
10
Zootecnia, CEP 18.618-307 - Botucatu, São Paulo, Brasil
11 c
Escola Superior Agrária do Instituto Politécnico de Santarém, Apartado 310,
12
2001-904 Santarém, Portugal.
13 d
CIISA - Faculdade de Medicina Veterinária, Universidade de Lisboa, 1300-477
14
Lisboa, Portugal.
15 e
Instituto Politécnico de Portalegre - Escola Superior Agrária de Elvas,
7350-16
903 Elvas, Portugal.
17 f
VALORIZA - Centro de Investigação para a Valorização de Recursos
18
Endógenos, 7300- 555 Portalegre, Portugal
19 20
Corresponding author: Ricardo António Silva Faria 21
*E-mail: fariasky@gmail.com 22
Postal Address: FMVZ - Unesp, DMNA - Fazenda Experimental Lageado 23
Rua José Barbosa de Barros, nº 1780 CEP: 18.618-307 - Botucatu - SP - Brasil
24 25
E-mails of the co-authors in the same order of publication: 26
António Pedro Andrade Vicente: apavicente@gmail.com
27
Rute Isabel Duarte Guedes dos Santos: rutesantos@esaelvas.pt
28
Amanda Merchi Maiorano: amanda_maiorano@hotmail.com
29
Rogério Abdallah Curi: rogcuri@fmvz.unesp.br
30
Luis Artur Loyola Chardulo: chardulo@fmvz.unesp.br
31
Josineudson Augusto II Vasconcelos Silva: jaugusto@fmvz.unesp.br
32 33
M
AN
US
CR
IP
T
AC
CE
PT
ED
Abstract – This study aimed to evaluate population parameters and to describe 34
the genetic diversity of the Lusitano breed in Brazil using pedigree data. Two
35
populations evaluated: total population (TP) containing 18,922 animals, and
36
reference population (RP) composed of a part of TP containing 8,329 animals,
37
representing the last generation. The generation interval (10.1 ± 5.1 years) was
38
in the range for horse populations. Pedigree completeness in RP shows almost
39
100% filling in the three most recent generations, indicating improvement in the
40
pedigree data and accuracy of the results. The inbreeding coefficient (4.46%)
41
and average relatedness (5.97%) for RP, indicating control on the part of
42
breeders. The effective population size was 89 (TP) and 90 (RP). The effective
43
number of founders (fe) of 33 and 29, effective number of ancestors (fa) of 30
44
and 26, and effective number of founder genomes (fg) of 19 and 15 for TP and
45
RP, respectively, indicating a reduction of genetic variability in the last
46
generations. The total number of ancestors that explains 100% of the genetic
47
diversity in the Lusitano breed in Brazil was 427 (TP) and 341 (RP). The
48
reproductive parameters, probabilities of gene origin showing loss of variability
49
in the last generations and the genetic contributions of ancestors suggest the
50
need to monitor genetic diversity over time in breeding programs in order to
51
allow control of the next generations and to increase their variability.
52 53
Keywords: ancestors; demographic characterization; effective population size; 54 founders; inbreeding. 55 56 57 58 59 60 61 62 63 64 65 66 67
M
AN
US
CR
IP
T
AC
CE
PT
ED
1. Introduction 68The Puro Sangue Lusitano (PSL), also known as the Lusitano horse,
69
represents a breed with a rich and ancient history, originated in southern
70
Portugal on the Iberian Peninsula. Its evolution is essentially due to their use for
71
working cattle and cutting bulls [1]. Although records date back to 1824, the
72
studbook of the Lusitano breed was officially established in 1967 [2], a time
73
when the main Iberian breeds, Portuguese and Spanish, were separated and
74
received the denomination PSL in Portugal and Pura Raza Española (PRE) in
75
Spain.
76
The main studbook of the Lusitano breed is managed in Portugal by the
77
Portuguese Lusitano Horse Breeder Association (APSL in the Portuguese
78
acronym), which has the largest number of birth records of the breed in the
79
world [2]. Brazil is the country with the second largest number of animal records
80
of this breed. This statistic was determined after the reciprocity partnership
81
between APSL and the Brazilian Lusitano Horse Breeder Association (ABPSL
82
in the Portuguese acronym) was established in 1991. This agreement permitted
83
all Lusitano horses registered in the Brazilian studbook to be equally registered
84
in the Portuguese studbook, which contains the birth records of all countries.
85
Studies investigating population parameters of the Lusitano breed have been
86
conducted only with data from the APSL studbook (Portugal) for all Lusitano
87
horses registered in the world [2,3]. Thus, data on the population statistics and
88
genetic diversity of the Lusitano breed in Brazil are lacking.
89
Parameters such as pedigree completeness [4], generation interval,
90
inbreeding coefficient [5], and probability of gene origin [6] are important to
91
design strategies for the selection and improvement of animals. The data
92
generated permit to verify genetic diversity and its changes over time [7]. The
93
complete or partial results of genetic diversity and population parameters are
94
reported in the literature for various horse breeds, including Andalusian [8] ,
95
Holstein [9], Paint-Horse [10], Hanoverian [11], Spanish Arab Horse [12],
96
Lipizzaner [13] and Old Kladruber [14]. In Brazil, studies were conducted on the
97
Pantaneiro [15], Mangalarga [16] Campolina [17], Brazilian Sport Horse [18]
98
and Quarter Horse [19] breeds.
99
This study aimed to evaluate the population parameters of the Lusitano horse
100
in Brazil in order to observe the genetic diversity and to contribute to the
M
AN
US
CR
IP
T
AC
CE
PT
ED
knowledge and development of this breed in Brazil and to compare our results
102
with the ones obtained by different authors for the worldwide population [2,3],
103
providing the information necessary to implement a breeding program of the
104
breed in Brazil.
105 106
2. Material and methods 107
2.1. Data and computer programs 108
The pedigree file of the Lusitano breed containing information about the
109
animal’s name, sire and dam, sex, date of birth and origin was provided by
110
ABPSL. Animals born and registered in Brazil between 1912 and 2012 were
111
considered and made up the total population (TP) of 18,922 animals (48.1%
112
males, stallions and geldings) and the reference population (RP) consisting of
113
8,329 animals (51.0% males, stallions and geldings), corresponding to the birth
114
records from 2003 to 2012. RP was used as the reference of the active
115
population, representing the last generation, which was equal to one mean
116
generation interval (10.1 years) and contained animals (stallions and mares)
117
that potentially could transmit their genes to the next generation.
118
Data preparation and statistical analysis were performed with the MEAN and
119
FREQ procedures of the SAS program [20]. The population and reproductive
120
parameters, probability of gene origin and genetic diversity were obtained with
121
the ENDOG V4.8 program [21].
122
123
2.2. Reproductive parameters and Generation interval 124
The existence of imported animals registered in the studbook of ABPSL
125
permitted to observe their use as breeding stock and to compare it with that of
126
sires and dams born in Brazil. The coefficients of variation for the mean number
127
of offspring, age at first and last progeny and time in reproduction obtained for
128
stallions and mares explain the high standard deviation between the different
129
parameters analyzed. These parameters were not calculated for RP because of
130
the small number of imported breeding animals during this period and because
131
the population is still in reproduction.
132
The generation interval (GI) was obtained based on the mean age of the
133
parents at the birth of offspring that reproduced [22], and was calculated for the
M
AN
US
CR
IP
T
AC
CE
PT
ED
four different paths of selection: father-son, father-daughter, mother-son and
135
mother-daughter and total parent-offspring.
136 137
2.3. Quality of pedigree data 138
The quality of the information in the ABPSL studbook is reported in two ways:
139
1) pedigree completeness summarizes the proportion of known ancestors in
140
each ascending generation per descendant and was calculated as proposed by
141
MacCluer et al [4], in which ancestors without progenitors in the pedigree were
142
considered founders [21]; 2) based on the mean number of generation
143
equivalents (GE), computed over the sum of all known ancestors by calculating
144
(½)n, where n is the number of generations between the animal and each
145
known ancestor [7].
146 147
2.4. Parameters related to the inbreeding coefficient 148
The inbreeding coefficient (F) defines the probability that an individual has
149
two identical alleles by descent and was calculated using the algorithm
150
proposed by Meuwissen and Luo [23].
151
The average relatedness (AR) coefficient of each animal was described by
152
Gutiérrez and Goyache [21] as the representation of a given animal in the
153
pedigree and was obtained based on the probability that a randomly selected
154
allele of the population belongs to a given animal.
155
The increase in inbreeding (∆F) for each generation was obtained as follows:
156
∆F = F − / 1 − (1) where and are the average inbreeding
157
in generations and − 1, respectively.
158
According to Falconer and Mackay [24], the effective size of a population (Ne) 159
is defined as the number of individuals of a population with a non-ideal structure
160
that would give origin to a certain rate of consanguinity if its structure were ideal
161
(e.g., equal number of males and females, absence of selection, random
162
matings, etc.). Using ∆F, Ne was estimated considering Ne = 1/2∆F, which 163
represents the number of animals that equally contribute to the next generation
164
and that would promote a similar increase in inbreeding in the population
165
studied [21]. In addition, Ne was also calculated based on the individual 166
increase in inbreeding as suggested by Gutiérrez et al [25] and was used for the
167
calculation of genetic drift.
M
AN
US
CR
IP
T
AC
CE
PT
ED
1692.5. Probability of gene origin and genetic drift 170
The effective number of founders (fe) is obtained by measuring the 171
contributions of the most influential founders. Lacy [26] defines fe as the 172
expected number of founders that contribute equally and produce the same
173
genetic diversity in the population studied. This parameter was calculated using
174
the formula
175
= 1/ ∑ (2) where is the probability of gene origin of founder k.
176
The effective number of ancestors (fa) represents the minimum number of 177
ancestors (founders or not) necessary to explain the full genetic diversity of the
178
population [6]. This parameter was calculated as
179
= 1/ ∑ (3) where is the marginal contribution of ancestor j. The
180
marginal contribution is the additional genetic contribution made by an ancestor
181
that was not explained by another previously chosen ancestor [6].
182
The effective number of founder genomes (fg) is defined as the number of 183
sires and dams that contribute equally to the population structure and produce
184
identical genetic diversity without the loss of alleles [27]. This parameter was
185
estimated as proposed by Caballero and Toro [28] using the formula
186
= 1 2⁄ (4) where C is the average coancestry between individuals of the
187
population.
188
Genetic drift is the random change in allele frequencies in a population,
189
which occurs at a higher intensity when the population undergoes a drastic
190
reduction in its effective size [24]. According to Sørensen et al [29], a ratio of
191
fe/Ne > 0.5 in a population indicates the occurrence of changes in genetic drift. 192
One approach to evaluate genetic drift is the observation of bottleneck effects.
193
The fe/fa ratio should be close to 1 if important bottlenecks have not occurred in 194
the population [6]. Stabilization of genetic drift in a population can be observed
195
when fe is close to Ne/2, suggesting a greater representation of founders [28]. 196
197
2.6. Genetic conservation index 198
The number of founders represented in the contributions received by an
199
individual and the balance between them were evaluated by computing the
200
genetic conservation index (GCI) of all animals [30]. It is supposed that higher
M
AN
US
CR
IP
T
AC
CE
PT
ED
indices correspond to animals with a more balanced representation from a large
202
number of founders, i.e., greater genetic conservation of the breed. The GCI
203
was computed for each animal using the formula
204
= 1/ ∑ ! (5) where ! is the proportion of genes of founder animal i in
205
the pedigree [21]. The mean of the populations was then calculated.
206 207
3. Results 208
3.1. Data analysis and distribution of birth records 209
In TP, 87.3% of the animals were born in Brazil after 1967 and 4.0% were
210
imported. The remaining animals are ancestors of both origins, which are
211
registered only as parents in the database of ABPSL. In RP, 99.6% of the
212
animals studied were born in Brazil and the remaining 0.4% are derived from
213
imported animals and ancestors.
214
The first birth registered by ABPSL and recognized by APSL was the female
215
Azambuja in 1967 and the first male was Zapata in 1969, both half-sibs of the
216
mare Zaza. Between 1967 and 1985, the births of only 305 animals were
217
recorded (Figure 1). A constant increase was observed after 1986 and the
218
number of registered births per year reached three digits for the first time.
219
Stabilization of the growth trend occurred in 2002, with reduced oscillations
220
(approximately 5%) in the following eight years. The largest number of
221
registered births was observed in 2006 (966 animals). A marked decline in the
222
number of births was seen in the last three years (2010 to 2012) of the study
223
(Figure 1).
224
Births were observed in all months but there was wide oscillation. In TP, only
225
4.6% of births occurred in the ideal month (July). The months with the largest
226
number of births were October (16.5%), September (15.7%), and November
227
(15.3%). The first, second and last quarter of the year concentrated 17%, 5%
228
and 45% of births, respectively.
229 230
3.2. Reproductive parameters and Generation interval 231
In the database, there were 16,511 (50.4% males, stallions and geldings)
232
Lusitano horses born in Brazil (national) and 781 (32.9% males, stallions and
233
geldings) imported animals (e.g., Portugal and Mexico). Of the 8,319 national
234
males, only 10.1% had offspring, while 257 (72.2%) of the imported males were
M
AN
US
CR
IP
T
AC
CE
PT
ED
used as stallions. Of the 8,192 national females, 37.7% had offspring and
236
96.2% of the 524 imported females were used as mares.
237
All animals born in Brazil (16,511) were sired by 1,115 stallions; 57.5% of the
238
offspring had a sire of Brazilian origin, 40.8% had an imported sire, 1.6% were
239
obtained by artificial insemination, and the sire was unknown in 0.1%. Among
240
the 3,594 breeding mares that contributed to the Brazilian population, 77.2% of
241
the offspring had a dam of Brazilian origin, 22.6% had an imported dam, 0.1%
242
were obtained by embryo transfer, and the dam was unknown in the remaining
243
0.1%.
244
There was a greater utilization of females, with a ratio of 3.1 mares (4,644)
245
per stallion (1,507). This ratio was 4.5 mares per stallion (210 stallions and 946
246
mares) in the most productive year (2006). The mean number of offspring
247
(Table 1) considering only breeding animals was 12.3 and 4.0 for stallions and
248
mares, respectively. Considerable differences were observed in the maximum
249
number of offspring, with stallion Afiançado de Flandes having 419 offspring
250
registered, the largest number for the whole breed worldwide.
251
The mean age of stallions at the birth of their first progeny was 7.0 years and
252
mares had their first foal at 5.9 years (Table 1). The mean age at the birth of the
253
last progeny was similar in stallions and mares, with a difference of 0.2 years
254
(Table 1). The difference between the birth of the first and last offspring,
255
indicating the time in reproduction, was 3.7 ± 5.0 years for stallions and 4.6 ±
256
5.1 years for mares.
257
High standard deviations were observed for all reproductive parameters
258
analyzed (Table 1). A standard deviation higher than the mean was found for
259
the number of offspring per stallion, which was almost the double of the mean
260
value. The coefficients of variations indicated a high level of dispersion, which
261
were 199.1% (number of offspring), 54.3% (age at first progeny), 53.3% (age at
262
last progeny) and 135.1% (time in reproduction) for stallions, and 85.0%
263
(number of offspring), 52.5% (age at first progeny), 50.5% (age at last progeny)
264
and 110.9% (time in reproduction) for mares.
265
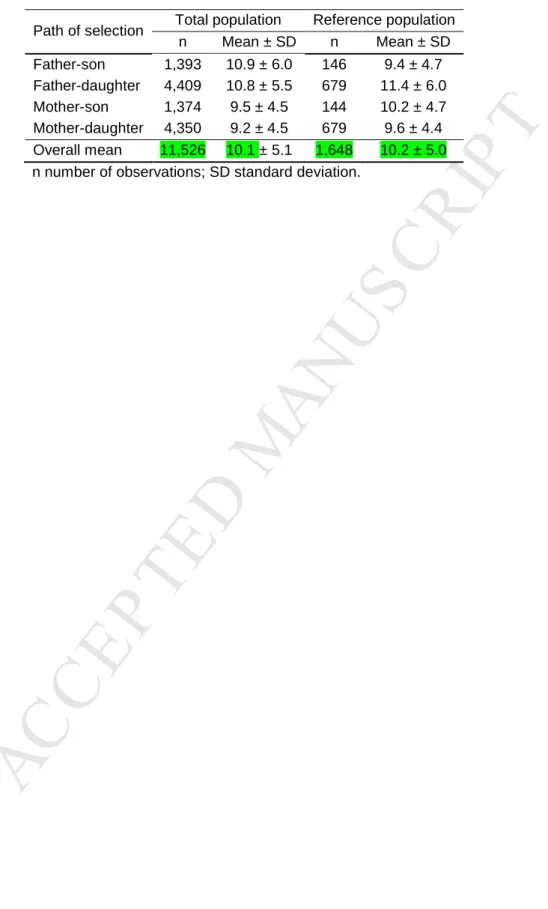
The overall mean GI was 10.1 ± 5.1 and 10.2 ± 5.0 years for TP and RP,
266
respectively (Table 2). When the four paths of selection were considered,
267
shorter GIs were observed for the mother-offspring paths in TP. The same trend
268
was not found in RP, with longer and shorter GIs between fathers and their
M
AN
US
CR
IP
T
AC
CE
PT
ED
offspring. The standard deviations were high (Table 2) and an approximate
270
dispersion of the results was observed in both populations studied.
271 272
3.3. Quality of pedigree data 273
The quality of the information of the ABPSL studbook based on average
274
pedigree completeness (Figure 2) was close to zero from the 15th (oldest) to the
275
11th generation in both populations and in the three most recent generations
276
(1st, 2nd and 3rd), with pedigree completeness of 97.7%, 95.4% and 92.2% in
277
TP, respectively, and of 99.8%, 99.5% and 98.2% in RP. The number of GE
278
was 5.7 ± 1.4 and 6.4 ± 0.7 for TP and RP, respectively.
279 280
3.4. Parameters related to the inbreeding coefficient 281
There were 14 matings between full-sibs, 607 between half-sibs, and 149
282
between parents and offspring. The F value was 4.06% ± 4.94% in TP and a
283
slight increase of 0.40% to 4.46% ± 4.34% was observed in RP. The AR
284
coefficient was 5.41% ± 1.69% in TP and increased by 0.56% to 5.97% ±
285
1.20% in RP. The ∆F per generation was 0.96% ± 2.09% in TP, while a lower
286
value (0.85% ± 0.90%) was observed in RP (Table 3). The percentage of
287
animals with F different from zero was 88.7% in TP and 98.0% in RP (Table 3).
288
Only two non-inbred animals were born in the last year evaluated (2012).
289
The Ne obtained based on ∆F is the most common parameter in the literature 290
and was 89 and 90 in TP and RP, respectively. Using the individual increase in
291
inbreeding, Ne values of 52 (TP) and 59 (RP) were obtained. 292
293
3.5. Probability of gene origin and genetic drift 294
The genetic variability of the populations demonstrated by the probability of
295
gene origin (Table 3) indicated an effective number of founders (fe) of 33, 296
ancestors (fa) of 30, and founder genomes (fg) of 19 in TP. These values 297
decreased to 29, 26 and 15, respectively, in RP.
298
Analysis of possible genetic drift in the populations showed an fe/Ne ratio of 299
0.64 in TP and of 0.49 in RP (Table 3). When the absence of bottleneck effects
300
was evaluated, fe/fa ratios of 1.10 (TP) and 1.12 (RP) were obtained. The fe ~ 301
(Ne/2) values were 33 ~ 26 and 29 ~ 30 for TP and RP, respectively. 302
M
AN
US
CR
IP
T
AC
CE
PT
ED
3.6. Genetic conservation index 304
The GCI indicated a mean number of founders per individual of 9.6 ± 2.9 and
305
9.7 ± 2.9 in TP and RP, respectively, with a maximum GCI of 22.1 founders. In
306
RP, GCI values less than 7.7 and higher than 11.7 corresponded to the 25th and
307 75th percentiles, respectively. 308 309 3.7. Genetic contributions 310
The total number of founders (Table 3) of the Lusitano breed in Brazil
311
represents 2.7% (TP) and 5.4% (RP) of each population and the total number of
312
ancestors 2.3% (TP) and 4.1% (RP). The cumulative genetic contribution (Table
313
3) of the 10, 50 and 100 most influential founders exhibited a reduced increase
314
in RP by 0.8%, 3.9% and 3.0%, respectively, compared to TP. The cumulative
315
marginal genetic contributions of ancestors were also slightly increased in RP
316
by 5.4%, 2.6% and 1.4% for the 10, 50 and 100 major ancestors (Table 3).
317
Figure 3 shows the genetic contributions of the 10 most influential founders
318
of the Lusitano Breed in Brazil since the first birth registered (1967) until 2012,
319
which are Agareno, Destinado IV, Príncipe VIII, Primoroso, Cartujano,
320
Jamonero III, Innato, Mejicano, Habanero VIII, and Carocha III.
321
The marginal genetic contributions of the 15 most influential ancestors,
322
founders or not, responsible for the presence of the breed in Brazil are shown in
323
Table 4 for TP and RP. The ancestors that increased their marginal
324
contributions in RP were Agareno, Príncipe VIII, Afiançado de Flandes,
325
Estribilho, Whisky, Bailador, Quimono, and Sultão I. Ancestors Cartujano and
326
Viscaina were replaced in RP by Hucharia and Guizo.
327 328
4. Discussion 329
330
4.1. Data analysis and distribution of birth records 331
In RP, only 0.2% of the animals were imported, indicating the sustainability of
332
Brazilian breeding. These findings show that animals born in Brazil have the
333
capacity to influence the future of the Lusitano breed in the world, with the
334
possibility of Brazilian breeders becoming an exporter of Lusitano horses.
335
Similar onsets of birth records have been reported in the literature for the
336
Brazilian Campolina [17] and Mangalarga Marchador [31] horse breeds. A
M
AN
US
CR
IP
T
AC
CE
PT
ED
decline in the registration of births was observed in the 1990s for the Brazilian
338
horse breeds Mangalarga [16], Campolina [17], Brazilian Sport Horse [18] and
339
Mangalarga Marchador [31]. According to the last authors, the reduction in the
340
number of registered births can be explained by the implementation of the
341
economic plan of the Brazilian government that resulted in a cause-effect
342
relationship due to the oscillations in the Brazilian economy. In contrast, the
343
annual number of registered births increased in the Lusitano breed during this
344
period (1990s) (Figure 1), possibly because it is not a native Brazilian breed and
345
was in a phase of importation and expansion in the country during that phase.
346
According to the Anualpec yearbook [32], the number of horses decreased
347
between 2002 and 2009 in Brazil, with a reduction of 278,375 births, while the
348
number of Lusitano horses was stable during this period. The decline that
349
started in 2010 (Figure 1) was the result of the serious economic-financial crisis
350
in Europe and the United States, which caused a deceleration in horse breeding
351
after 2008 in various parts of the world. A similar trend has been described in
352
studies on the Lusitano [2], Old Kladruber [14] and Pantaneiro [15] breeds. The
353
Lusitano breed in Brazil exhibited resistance to the decrease in equine records
354
more than once, but the downward trend that started in 2010 (Figure 1) has
355
become a matter of concern for the evolution of the breed. However, it is
356
possible that some of the animals born in 2012 had not yet appeared in the
357
database when it was consulted for the present study.
358
The importance of the month of birth is related to the fact that July is
359
considered the ideal month for the birth of sporting animals in the southern
360
hemisphere. Competitions start in July, i.e., animals born in this month have a
361
competitive advantage over animals born in subsequent months because they
362
are older and therefore exhibit greater physiological and sport development.
363
This applies particularly to the classes of younger animals. Studies involving
364
animals born in the southern hemisphere indicated the same trend observed for
365
Lusitano horses registered in Brazil for the Mangalarga Marchador breed [31],
366
with a concentration of birth (> 85%) between September and March. In the
367
Mangalarga breed [16], a peak was found in November (17.4%) and a higher
368
concentration between September and January (78.5%). A better but far from
369
desired distribution was observed in Thoroughbreds [33], with 20.2% of births in
370
the ideal month (July) and a larger number of births in August (24.1%), followed
M
AN
US
CR
IP
T
AC
CE
PT
ED
by September (23.0%). The distribution of births over the year in Brazil can be
372
explained by the abundance of feed (pastures) throughout all quarters of the
373
year and by the higher nutritional value in the last quarter (spring), a fact that
374
leads Brazilian breeders to opt for the quality of their pastures at the expense of
375
the ideal month. Since the Lusitano horse is mainly a sporting animal, the best
376
choice is that a larger number of births should occur in the third quarter of the
377
year. To help comparing the results and their discussion with several different
378
horse breeds a supplementary table can be consulted online (Supplementary
379
material - Table A ).
380 381
4.2. Reproductive parameters and Generation interval 382
The differentiated values of breeding animals that left descendants
383
(progenies) by national and imported origins are also observed in the literature.
384
In the study of Cervantes et al [12] on Spanish Arab Horses, the contribution of
385
imported individuals was high, corresponding to 47.9% of all descendants of the
386
breed’s studbook. Koenen et al [34], providing an overview of the breeding
387
objectives for sport horses, reported percentages of mares covered by an
388
imported stallion of 74% for Danish Warmblood, 62% for Swedish Warmblood,
389
32% for Irish Horse Board, 31% for Royal Dutch Sport Horse, and 6% for Selle
390
Français. The percentage of use of imported Lusitano breeding animals among
391
those imported to Brazil can be explained by the choices of breeders who
392
purchased these animals from foreign populations mainly for breeding, with
393
dams being used almost exclusively for this purpose. Despite the greater
394
utilization within the origin of imported animals, the percentage of offspring with
395
Lusitano parents born in Brazil was higher, demonstrating the reproductive
396
sustainability on the American continent of the responsibility of Brazilian horse
397
farms.
398
The percentages of breeding animals that left descendants are 3.3%
399
(stallions) and 22.6% (mares) for the Mangalarga Marchador breed [31], and
400
8.3% (stallions) and 22.2% (mares) for the world Lusitano population [3]. These
401
values are lower than those obtained in the present study, indicating greater
402
utilization of breeding animals in the formation of the Lusitano population in
403
Brazil and consequent higher genetic diversity. The smaller number of stallions
404
in all studies reported may be due in part to the greater difficulty of approval in
M
AN
US
CR
IP
T
AC
CE
PT
ED
the studbook and their reproductive superiority, in which a single stallion can
406
have dozens of offspring while a natural limit exists for mares. The low breeding
407
stallion-to-mare ratio reduces the intensity of selection, which may result in less
408
genetic progress of the population [35].
409
For the world Lusitano population, Vicente et al [2] indicated that the ratio of
410
5 mares per sire (lower than in the present study) impairs selection of the
411
Lusitano breed. The small number of mares per stallions observed in the
412
present study, similar to Quarter Horse in Brazil [19], should be taken into
413
consideration by the association and by breeders, which can be modified and
414
improved, increasing genetic progress to the levels (mares per stallion) of other
415
breeds such as Thoroughbreds in New Zealand (43 to 1) [36] and Hanoverians
416
(45 to 1) [11].
417
Vicente et al [2] reported mean numbers of offspring similar to those of the
418
present study (Table 1) for the Lusitano breed, with a mean number of offspring
419
of 13.1 for stallions and of 4.0 for mares, suggesting identical reproductive
420
guidelines on Brazilian horse farms and in the remaining countries where
421
Lusitanos are reared. The numbers of offspring observed in the literature were
422
different (stallions) and similar (mares) compared to those of the Lusitano
423
population in Brazil (Table 1), with 22.2 (stallions) and 3.1 (mares) offspring for
424
the Campolina breed [17],10.7 (stallions) and 3.7 (mares) offspring for the
425
Quarter Horse [19], and 23.8 (stallions) and 4.4 (mares) offspring for the
426
Mangalarga breed [16]. Reproductive inequalities between sexes in horses can
427
be seen in all breeds (Supplementary material - Table A ), indicating greater
428
participation of dams in the maintenance of the genetic diversity of each breed.
429
The age at birth of the first foal indicates the onset of reproductive life and,
430
considering that horses are able to breed at 2 years of age [37], this did not
431
influence the age at first foal since horses exhibit a late mean age at birth of
432
their first progeny [2,38]. The main causes of this event as reported in various
433
studies include differences in reproductive strategies between breeds and farms
434
(high standard deviations in the results of Table 1), after functional performance
435
and credits established in their sports career. Another factor are the regulations
436
of the associations, which only permit the registry of animals in the studbook at
437
certain ages and riding classes, a fact resulting in the approval of animals at
438
older ages. Other factors include hormonal disorders, genital and parasite
M
AN
US
CR
IP
T
AC
CE
PT
ED
infections, and inadequate management practices before the breeding season,
440
interfering with the onset of reproductive life of horses. An almost identical
441
mean age at first progeny (Table 1) was reported for stallions of the world
442
Lusitano population [2], with a difference of only 0.3 years. The delay in the age
443
at first progeny in the Lusitano breed may be explained by the regulations of
444
their association, which only permit the application of stallions after 4 years of
445
age and of recommended or merit stallions (animals recommended by APSL for
446
breeding can have an unlimited number of offspring) at a minimum age of 6
447
years. Many breeders who wish their mares covered by these stallions wait to
448
perform matings or use the semen of these animals, consequently increasing
449
the age at birth of the first foal. However, the mean age of mares (Table 1) of
450
the present study was not far from the ideal proposed by Davies Morel et al
451
[39]. These authors described the ideal age of mares to start breeding to be
452
between 5 and 6 years, a period when they will have reached the final mature
453
size.
454
The age at birth of the last progeny (Table 1) was similar to that reported by
455
Vicente et al [2], who estimated a mean age of 10.5 years for sires and dams.
456
The end of reproductive life of horses has been little studied and the age at last
457
progeny is less reported than the age at first progeny. Further studies are
458
necessary to understand the reasons for at age last progeny.
459
The coefficients of variation for all reproductive parameter indicate high
460
dispersion of the results among animals, which was greater in stallions for all
461
parameters, demonstrating an imbalance in the utilization of males and females.
462
The results suggest different objectives within the Lusitano breed in Brazil, with
463
the observation of sires and dams with a small or large number of offspring, late
464
age at first progeny, and a reduced mean number of dams per sire. The values
465
observed are common among some equine breeds, but are in contrast to the
466
balanced values of cattle for which studies have already determined, for
467
example, the ideal number of cows per bull [40].
468
Scientific studies have not shown the same influence on horse breeds as
469
studies involving other livestock species (e.g., cattle, pigs, and small ruminants).
470
The difficulty in designing the same experiments is mainly due to the
471
peculiarities of horses and to the fact that, unlike in the case of other livestock
472
species, the access of the scientific community to horse farms is limited,
M
AN
US
CR
IP
T
AC
CE
PT
ED
impairing the approximation between researchers and breeders. Breeders of
474
the Lusitano horse in Brazil should increase and balance the number of dams
475
per sire (genetic evolution), begin the reproductive life of animals earlier
476
(decrease in GI), and collaborate more actively with researchers to establish
477
new selection programs, which would permit to observe reproductive
478
parameters that contribute to the genetic evolution of horses as observed for
479
other livestock species.
480
Vicente et al [2], evaluating Lusitano horses using data collected throughout
481
the world, obtained a GI that was similar to (TP) and the same as (RP) that of
482
Lusitano in Brazil, indicating a possible influence of animals born in Brazil on
483
the values of the world population. Although long, the GI is similar for all breeds
484
in Brazil, such as Mangalarga (9.5 years) [16], Campolina (8.7 years) [17],
485
Brazilian Sport Horse (10.8) [18] and Quarter Horse (9.6 years) [19]. The GI
486
obtained in Europe for Andalusian (10.1 years) [8], Holstein (10.3 years) [9]
487
and Old Kladruber (11.3 years) [14] was the same as those estimated for the
488
Lusitano horse (Supplementary material - Table A ) . A long GI is the result of
489
different factors such as the late selection of stallions and mares and long
490
reproductive life. Consequently, since the GI is present in the denominator of
491
the formula used to calculate genetic gain, it will act inversely proportional,
492
reducing the expected response to selection. The reduction in genetic gain due
493
to a long GI in the Lusitano breed is supported by the high standard deviations,
494
indicating that some breeders are concerned about the GI of their populations,
495
while a large number of breeders who are not concerned are responsible for
496
decelerating the evolution of the Lusitano breed in Brazil.
497 498
4.3. Quality of pedigree data 499
The mean values of pedigree completeness (Figure 2) tended to increase
500
over time and the loss of data was lower when compared to a study on Spanish
501
Arab horses [12], which reported percentages of 92.0%, 86.6% and 80.8% for
502
the three most recent generations. For Lipizzan [40] and Old Kladruber [14], the
503
authors indicated high values of completeness around 100% for the last five
504
and six generations, respectively. In the study of the world Lusitano population,
505
the percentages of pedigree completeness obtained for the whole population of
506
98.8%, 97.8% and 97.1% [2] indicate that the APSL data are slightly more
M
AN
US
CR
IP
T
AC
CE
PT
ED
complete than the whole data of ABPSL, with more in-depth pedigree
508
knowledge. The estimation of pedigree completeness is important since the
509
parameters related to the inbreeding coefficient, probability of gene origin and
510
genetic drift of a given individual depends on how much of his ancestry is
511
known. The moderate values of the present study can be improved, the greater
512
this knowledge, the more reliable will be the estimated values in relation to the
513
base population studied.
514
When compared to the literature, the number of GE (5.7 in RP) can be
515
considered low, but was higher than that reported in studies on Pantaneiro (0.7
516
GE) [15], Brazilian Sport Horse (1.7 GE) [18], Paint-Horse (4.8 GE) [10],
517
Quarter Horse (5.1) [19] and equal to Holstein (5.6 GE) [9]. However, the GE
518
was lower than in Purebred Lusitano (9.9 GE) [2] and Old Kladruber (15.1 GE)
519
[14]. Similar to the literature (Supplementary material - Table A), the increase in
520
the amount of pedigree data in RP indicates improvement in the quality of
521
pedigree information in the studbook of ABPSL. However, we must always
522
analyze and compare these results with care since they depend on the quality
523
and degree of completion of the pedigrees, so the values obtained for GE may
524
have a direct influence on inbreeding, fe and fa estimates.
525 526
4.4. Parameters related to the inbreeding coefficient 527
The main effect of F (Table 3) is an increase in homozygosity as a result of
528
more closely related animals. A higher inbreeding coefficient (9.4%) has been
529
reported by Vicente et al [2] for the whole population of Lusitano horses
530
registered in the world when a period of 5 years (2005 to 2009) was analyzed.
531
An even higher value (11.3%) was obtained by the authors for a reference
532
population. An inbreeding coefficient (F) of 4.6% was observed exclusively for
533
Lusitano born in Brazil and for the same period (2005 to 2009). Considering the
534
values reported by Vicente et al [2], Lusitano horses born in Brazil contribute to
535
an overall decrease of inbreeding in the breed. This fact may indicate that farms
536
have been introducing different lineages of less related Lusitano horses in Brazil
537
over the years. On the other hand, this reduction in the inbreeding coefficient of
538
animals reared in Brazil may also be explained in part by the lower level of
539
pedigree knowledge compared to the Lusitano studbook of APSL. The
540
maintenance of a low level of inbreeding in Brazilian Lusitano horses may
M
AN
US
CR
IP
T
AC
CE
PT
ED
contribute in the future to the export of breeding animals in order to reduce
542
inbreeding on Lusitano horse farms around the world. Other authors reported
543
higher value of F for Andalusian (8.5%) [8] Lipizzaner (10.8%) [13] and Old
544
Kladruber (13.0%) [14]. Low levels of F are observed for Brazilian breeds,
545
including Campolina (1.3%) [17], Brazilian Sport Horse (0.24%) [18] and
546
Mangalarga Marchador (5.7%) [31] (Supplementary material - Table A). Low
547
levels of F are an indicator that the breeds are organized in an open studbook
548
system, which permits the utilization of sires and dams from other breeds with a
549
consequent reduction in inbreeding.
550
∆F was reduced (Table 3), with a small decrease in RP, despite the
551
observation of a larger number of mating among related animals compared to
552
TP. An increase in consanguinity was observed among annual births, finishing
553
2012 with 99.5% of births of related animals. The standard deviations obtained
554
(Table 3) are not of major concern since they remained within acceptable levels
555
for inbreeding parameters. High standard deviations were also observed in the
556
study of Vicente et al [2]. Despite the lower dispersions in the present study, the
557
results should not be overlooked because the small number of Lusitano horses
558
compared to other breeds or species may, at any time, change the F values to
559
less desired levels.
560
Values of Ne have been reported for Hanoverian (372) [11], Spanish Sport 561
Horse (226) [41], Brazilian Sport Horse (223) [18], Holstein (55) [9], and Old
562
Kladruber (53) [14] breeds. Studies that obtained high values of Ne suggest, by 563
definition, reduced inbreeding levels because of the direct relationship between
564
Ne and inbreeding rate [24]. This is obviously also related to the fact that most 565
of these breeds have open studbooks, thus permitting the introduction of new
566
genes and a consequent reduction in inbreeding. The small increase of Ne in 567
RP (Table 3) is related to the fact that the increase in inbreeding was lower in
568
the last generation, and possibly to the introduction of new lineages and
569
different utilizations of major ancestors, either founders or not (Figure 3; Table
570
4). However, and according to Caballero and Toro [42], the comparison of
571
different Ne values is problematic since the true value is unknown and the Ne 572
obtained depends in part on the effect of changes in mating policies (level of
573
inbred animals).
M
AN
US
CR
IP
T
AC
CE
PT
ED
For the world Lusitano population, Vicente et al [2] reported that the Ne of 41 575
obtained for a period of 5 years (2005 to 2009) is a matter of concern for the
576
maintenance of genetic diversity. The Ne observed in the present study for the 577
same period and using the same method as those authors (individual increase
578
in inbreeding) was 57. Considering the minimum Ne (50) recommended by the 579
FAO [43], the value obtained in this study is less worrisome for the maintenance
580
of genetic diversity, and Lusitano horses born in Brazil may therefore assist in
581
maintaining the diversity of the world population.
582 583
4.5. Probability of gene origin and genetic drift 584
Lower probabilities of gene origin are reported in the literature for the
585
Lusitano breeds (fe of 28, fa of 12 and fg of 6) [2], Holstein (fe of 50, fa of 29 and 586
fg of 17) [9] and Old Kladruber (fe of 93, fa of 17 and fg of 5) [14] and, while 587
higher values were found for Paint-Horse (fe of 561, fa of 208 and fg of 139) [10], 588
Brazilian Sport Horse (fe of 466, fa of 274 and fg of 224) [18], Quarter Horse (fe 589
of 1,045, fa of 156 and fg of 105) [19] and Spanish Sport Horse (fe of 963, fa of 590
407 and fg of 254) [41] (Supplementary material - Table A ). Higher values 591
suggest the use of a larger number of animals in the formation of the breeds.
592
The genetic variability of breeds observed in the literature, as demonstrated by
593
the results of the probability of gene origin, is a matter of concern in horse
594
breeding. However, the variation in the three parameters of gene origin
595
probability obtained in the present study was lower than that described in the
596
literature. The effective number of founders in both populations, comparing the
597
number of founders (Table 3), indicates the preferential use of certain lineages
598
of founders. Since each population has its own characteristics, comparison with
599
the literature should be done with caution and within each breed, considering
600
the three parameters for each population.
601
Genetic drift is approaching stability in the Brazilian Lusitano breed (Table 3),
602
with a progressive increase in the representation of founders [28,29] in RP as
603
indicated by fe/Ne > 0.5 and fe ~ (Ne/2), which are close to the desired. The fe/fa 604
ratio (Table 3) confirms the absence of worrisome bottleneck effects in the
605
population despite the increase of 0.02 in RP. Different results are observed in
606
the literature, with the loss of genetic variability due to the utilization of lineages
607
with a reduced number of founders and worrisome bottleneck effects; for
M
AN
US
CR
IP
T
AC
CE
PT
ED
example, fe/fa ratios of 1.69 for the Brazilian Sport Horse [18], 1.72 for the 609
Holstein [9], 2.34 for Lusitano using world data [2], 2.37 for the Spanish Sport
610
Horse [41], 2.70 for the Paint-Horse [10], 5.47 for the Old Kladruber [14], and
611
Quarter Horse 6.70 [19].
612
.The persistence of the founder lines is observed in several breeds
613
throughout the world, being lower in the present study. It should be noted that,
614
the values of each breed may vary due to different qualities of Studbook data
615
information (Pedigree completeness and GE).
616 617
4.6. Genetic conservation index 618
In the literature, mean GCIs of 1.3, 9.5 and 14.8 and maximum values of 7.2,
619
19.2 and 31.2 have been reported for the Pantaneiro [15] Lusitano [2] and
620
Quarter Horse [19] breeds, respectively (Supplementary material - Table A ).
621
The small differences between the world Lusitano population and the present
622
study are visible in the maximum values and are explained by the
623
heterogeneous importation of genetic lineages of Lusitano into Brazil.
624
Consequently, different sires and dams were used over time, which resulted in
625
slightly higher GCI values.
626
Animals with higher indexes exhibit greater conservation, i.e., a greater
627
balance in the number of founders, and should be used (preferentially in the
628
choice of breeding animals) in genetic selection programs to maintain the genes
629
transmitted by founders [30]. Brazilian farms are a good choice for breeding
630
animals of the Lusitano breed or of world breeds with origin in the Lusitano
631
horse, with the Mangalarga Marchador, Campolina, Andaluz Brasileiro or
632
Iberian breeds (e.g. Portuguese and Spanish Sport Horses), in order to
633
introduce founder genes of the Lusitano breed.
634 635
4.7. Genetic contributions 636
A slight increase in the genetic contributions explained by the 10, 50 and 100
637
most influential founders was observed from TP to RP (Table 3), indicating a
638
similar use of lineages as the major founders in RP. This change contributed to
639
maintaining the genetic diversity of the Lusitano breed in Brazil over the last 10
640
years (2003-2012) evaluated. The marginal genetic contributions of ancestors,
641
with a small increase in RP (Table 3), suggest that ancestors contributed
M
AN
US
CR
IP
T
AC
CE
PT
ED
equally in TP and RP, demonstrating the maintenance of alleles of ancestral
643
sires and dams in the last generation.
644
The marginal genetic contribution of the 15 most influential ancestors in the
645
present study (Table 4) was higher than that reported for Hanoverians (34.9%)
646
[11]. Considering the 10 most influential ancestors with the greatest marginal
647
genetic contributions to the world Lusitano population reported in the study of
648
Vicente et al [2], half of these animals were also ancestors of the Brazilian
649
population (Table 4), represented by Agareno, Príncipe VIII, Destinado IV,
650
Primoroso and Cartujano, at different proportions and maintaining only the order
651
of the marginal genetic contribution of the most influential ancestor (Agareno).
652
Although these authors studied the same breed as in the present study, the
653
data used refer to the period from 2005 to 2009, with a much larger sample of
654
data and the approaches taking place in different populations. Consequently,
655
the observation of differences in the parameters between the two studies was
656
expected.
657
In the study on the world Lusitano population [2], the number of founders was
658
14 and 99, corresponding to 50% and 90% of the genetic contribution of
659
founders, respectively. The Brazilian Lusitano population exhibited variations in
660
founder lineages (Figure 3) and, consequently, greater genetic diversity of the
661
animals born on Brazilian farms. These differences may help explain the lower
662
inbreeding and greater genetic diversity of Lusitano horses born in Brazil.
663 664
5. Conclusion 665
The inbreeding and relatedness coefficients demonstrate some control on the
666
part of Brazilian breeders, suggesting that Lusitano horses born in Brazil can be
667
introduced as breeding animals in the world Lusitano population in order to
668
increase the genetic diversity of the breed. The long GI obtained indicates a
669
delay in annual genetic gain and the lack of speedy decision-making about the
670
appropriate use of sires and dams. Although the absence of bottleneck effects
671
is evident and positive, the low probabilities of gene origin and the high genetic
672
contribution of a small number of animals suggest that Brazilian breeders need
673
to monitor the genetic diversity of the Lusitano horse in next generations
674
through breeding programs.
675 676
M
AN
US
CR
IP
T
AC
CE
PT
ED
Acknowledgments 677The authors thank the Associação Brasileira de Criadores do Cavalo
Puro-678
Sangue Lusitano (ABPSL) for providing the data used in this study. We are also
679
grateful to the anonymous reviewers for their helpful comments. We
680
acknowledge the invaluable contribution of the late Professor Dr. Marcílio Dias
681 Silveira da Mota. 682 683 Funding 684
Productivity grant attributed to Professor Dr. J. Augusto II, by Conselho
685
Nacional de Desenvolvimento Científico e Tecnológico (CNPq - Brazil).
686 687
References 688
[1] Luís C, Cothran EG, Oom MDM. Inbreeding and genetic structure in the
689
endangered Sorraia horse breed: Implications for its conservation and
690
management. J Hered 2007;98:232–7. doi:10.1093/jhered/esm009.
691
[2] Vicente AA, Carolino N, Gama LT. Genetic diversity in the Lusitano horse
692
breed assessed by pedigree analysis. Livest Sci 2012;148:16–25.
693
doi:10.1016/j.livsci.2012.05.002.
694
[3] Vicente AA, Carolino N, Gama LT. Demographic parameters in Lusitano
695
horse. Arch Zootec 2009;58:501–4.
696
[4] MacCluer JW, Boyce AJ, Dyke B, Weitkamp LR, Pfenning DW, Parsons
697
CJ. Inbreeding and pedigree structure in Standardbred horses. J Hered
698
1983;74:394–9. doi:10.1093/oxfordjournals.jhered.a109824.
699
[5] Wright S. Evolution in Mendelian populations. Genetics 1931;16:97–159.
700
doi:10.1016/S0092-8240(05)80011-4.
701
[6] Boichard D, Maignel L, Verrier É. The value of using probabilities of gene
702
origin to measure genetic variability in a population. Genet Sel Evol
703
1997;29:5–23. doi:10.1186/1297-9686-29-1-5.
704
[7] Maignel L, Boichard D, Verrier E. Genetic Variability of French Dairy
705
Breeds Estimated From Pedigree Infonnation. Interbull Bull, vol. 14, 1996,
706
p. 48–56.
707
[8] Valera M, Molina A, Gutiérrez JP, Gómez J, Goyache F. Pedigree
708
analysis in the Andalusian horse: population structure, genetic variability
709
and influence of the Carthusian strain. Livest Prod Sci 2005;95:57–66.
M
AN
US
CR
IP
T
AC
CE
PT
ED
doi:10.1016/j.livprodsci.2004.12.004. 711[9] Roos L, Hinrichs D, Nissen T, Krieter J. Investigations into genetic
712
variability in Holstein horse breed using pedigree data. Livest Sci
713
2015;177:25–32. doi:10.1016/j.livsci.2015.04.013.
714
[10] Siderits M, Baumung R, Fuerst-Waltl B. Pedigree analysis in the German
715
Paint Horse: Genetic variability and the influence of pedigree quality.
716
Livest Sci 2013;151:152–7. doi:10.1016/j.livsci.2012.10.018.
717
[11] Hamann H, Distl O. Genetic variability in Hanoverian warmblood horses
718
using pedigree analysis. J Anim Sci 2008;86:1503–13.
719
doi:10.2527/jas.2007-0382.
720
[12] Cervantes I, Molina A, Goyache F, Gutiérrez JP, Valera M. Population
721
history and genetic variability in the Spanish Arab Horse assessed via
722
pedigree analysis. Livest Sci 2008;113:24–33.
723
doi:10.1016/j.livsci.2007.02.011.
724
[13] Zechner P, Sölkner J, Bodó I, Druml T, Baumung R, Achmann R, et al.
725
Analysis of diversity and population structure in the Lipizzan horse breed
726
based on pedigree information. Livest Prod Sci 2002;77:137–46.
727
doi:10.1016/S0301-6226(02)00079-9.
728
[14] Vostrá-Vydrová H, Vostrý L, Hofmanová B, Krupa E, Zavadilová L.
729
Pedigree analysis of the endangered Old Kladruber horse population.
730
Livest Sci 2016;185:17–23. doi:10.1016/j.livsci.2016.01.001.
731
[15] McManus C, Santos SA, Lima Dallago BS, Paiva SR, Saraiva Martins RF,
732
Neto JB, et al. Evaluation of conservation program for the pantaneiro
733
horse in Brazil. Rev Bras Zootec 2013;42:404–13.
doi:10.1590/S1516-734
35982013000600004.
735
[16] Mota MDS, Prado RSA, Sobreiro J. Characterization of the Mangalarga
736
horse population in Brazil. Arch Zootec 2006;55:31–7.
737
[17] Procópio AM, Bergmann JAG, Costa MD. Formação e demografia da
738
raça Campolina. Arq Bras Med Vet e Zootec 2003;55:361–5.
739
doi:10.1590/S0102-09352003000300018.
740
[18] Medeiros BR, Bertoli CD, Garbade P, McManus CM. Brazilian Sport
741
Horse: pedigree analysis of the Brasileiro de Hipismo breed. Ital J Anim
742
Sci 2014;13:657–64. doi:10.4081/ijas.2014.3146.
743
[19] Faria RAS, Maiorano AM, Bernardes PA, Pereira GL, Silva MGB, Curi
M
AN
US
CR
IP
T
AC
CE
PT
ED
RA, et al. Assessment of pedigree information in the Quarter Horse:
745
Population, breeding and genetic diversity. Livest Sci 2018;214:135–41.
746
doi:10.1016/j.livsci.2018.06.001.
747
[20] SAS. SAS/STAT 9.3. SAS Inst Inc, Cary, NC 2011.
748
[21] Gutiérrez JP, Goyache F. A note on ENDOG: A computer program for
749
analysing pedigree information. J Anim Breed Genet 2005;122:172–6.
750
doi:10.1111/j.1439-0388.2005.00512.x.
751
[22] James JW. Computation of genetic contributions from pedigrees. Theor
752
Appl Genet 1972;42:272–3. doi:10.1007/BF00277555.
753
[23] Meuwissen the, Luo Z. Computing inbreeding coefficients in large
754
populations. Genet Sel Evol 1992;24:305–13.
doi:10.1186/1297-9686-24-755
4-305.
756
[24] Falconer D, Mackay T. Introduction to Quantitative Genetics. vol. 4th Ed.
757
1996.
758
[25] Gutiérrez JP, Cervantes I, Goyache F. Improving the estimation of
759
realized effective population sizes in farm animals. J Anim Breed Genet
760
2009;126:327–32. doi:10.1111/j.1439-0388.2009.00810.x.
761
[26] Lacy RC. Analysis of founder representation in pedigrees - founder
762
equivalents and founder genome equivalents. Zoo Biol 1989;8:111–23.
763
doi:10.1002/zoo.1430080203.
764
[27] Ballou JD, Lacy RC. Identifying genetically important individuals for
765
management of genetic diversity in captive populations. In: Ballou JD,
766
Gilpin M, Foose TJ, editors. Popul. Manag. Surviv. Recover. Anal.
767
Methods Strateg. Small Popul. Conserv., New York: Columbia University
768
Press; 1995, p. 76–111.
769
[28] Caballero A, Toro M. Interrelations between effective population size and
770
other pedigree tools for the management of conserved populations. Genet
771
Res 2000;75:331–43. doi:10.1017/S0016672399004449.
772
[29] Sørensen a C, Sørensen MK, Berg P. Inbreeding in Danish dairy cattle
773
breeds. J Dairy Sci 2005;88:1865–72.
doi:10.3168/jds.S0022-774
0302(05)72861-7.
775
[30] Alderson L. A system to maximize the maintenance of genetic variability
776
in small populations. In: Alderson L, Bodo I, editors. Genet. Conserv.
777
Domest. Livest., Wallingford: CABI Publishing; 1992, p. 18–29.
M
AN
US
CR
IP
T
AC
CE
PT
ED
[31] Costa MD, Bergmann JAG, Resende ASC, Fonseca CG. Análise
779
temporal da endogamia e do tamanho efetivo da população de eqüinos
780
da raça Mangalarga Marchador. Arq Bras Med Vet e Zootec
781
2005;57:112–9. doi:10.1590/S0102-09352005000100015.
782
[32] Informa Economics IEG | FNP. ANUALPEC 2012.
783
http://www.anualpec.com.br/.
784
[33] Mota MDS, Abrahão AR, Oliveira HN. Genetic and environmental
785
parameters for racing time at different distances in Brazilian
786
Thoroughbreds. J Anim Breed Genet 2005;122:393–9.
787
doi:10.1111/j.1439-0388.2005.00551.x.
788
[34] Koenen EPC, Aldridge LI, Philipsson J. An overview of breeding
789
objectives for warmblood sport horses. Livest Prod Sci 2004;88:77–84.
790
doi:10.1016/j.livprodsci.2003.10.011.
791
[35] Vicente AA, Carolino N, Ralão-Duarte J, Gama LT. Selection for
792
morphology, gaits and functional traits in Lusitano horses: I. Genetic
793
parameter estimates. Livest Sci 2014;164:1–12.
794
doi:10.1016/j.livsci.2014.01.020.
795
[36] Rogers CW, Gee EK, Firth EC. A cross-sectional survey of Thoroughbred
796
stud farm management in the North Island of New Zealand. N Z Vet J
797
2007;55.
798
[37] Langlois B. Estimation de quelques parametres demographiques du Pur
799
Sang anglais en France. Ann Genet Sel Anim 1976;8:315–29.
800
[38] Mota, M. D.S. and Regitano LCA. World ’ s largest Science , Technology
801
& Medicine Open Access book publisher c. RFID Technol Secur
802
Vulnerabilities, Countermeas 2012:75–100. doi:10.5772/711.
803
[39] Davies Morel MCG, Newcombe JR, Holland SJ. Factors affecting
804
gestation length in the Thoroughbred mare. Anim Reprod Sci
805
2002;74:175–85. doi:10.1016/S0378-4320(02)00171-9.
806
[40] Goddard MG, Smith C. Optimum Number of Bull Sires In Dairy Cattle
807
Breeding. J Dairy Sci 1990;73:1113–22.
doi:10.3168/jds.S0022-808
0302(90)78771-1.
809
[41] Bartolomé E, Cervantes I, Valera M, Gutiérrez JP. Influence of foreign
810
breeds on the genetic structure of the Spanish Sport Horse population.
811
Livest Sci 2011;142:70–9. doi:10.1016/j.livsci.2011.06.021.
M
AN
US
CR
IP
T
AC
CE
PT
ED
[42] Cervantes I, Goyache F, Molina a., Valera M, Gutiérrez JP. Application of
813
individual increase in inbreeding to estimate realized effective sizes from
814
real pedigrees. J Anim Breed Genet 2008;125:301–10.
815
doi:10.1111/j.1439-0388.2008.00755.x.
816
[43] FAO. Secondary guidelines for development of national farm animal
817
genetic resources management plans: management of small populations
818
at risk. Roma, Italy: 1998.
819 820
M
AN
US
CR
IP
T
AC
CE
PT
ED
Figure captionsFigure 1. Number of births (males, females, and all animals) registered in the Studbook of the Lusitano horse breed in Brazil by year of birth.
Figure 2. Completeness of pedigree information per generation for both
populations (total and reference) of Lusitano horses in Brazil (15th generation of older animals).
Figure 3. Evolution of the genetic contribution of the 10 most influential founders of the Lusitano breed in Brazil from the first record in 1967 to 2012, during five different periods.
M
AN
US
CR
IP
T
AC
CE
PT
ED
TablesTable 1. Summary descriptive statistics of reproductive parameters of Lusitano stallions and mares in Brazil
Total population
Item Stallion Mare
Offspring Total (n) 18,515a 18,436b Mean ± SD (n) 12.3 ± 24.5 4.0 ± 3.4 Maximum (n) 419 20 Stallions/mares Total (n) 1,507 4,644
Age at first progeny (years) 7.0 ± 3.8 5.9 ± 3.1 Age at last progeny (years)c 10.7 ± 5.7 10.5 ± 5.3 N number of the respective observation; SD, standard deviation. a offspring with known father (independently of knowing the mothers). b offspring with known mother (independently of knowing the father). c Only calculated for animals with two or more offspring.