Genetic diversity of Brazilian Brahman cattle by pedigree analysis
Ligia Cavani(1), Rafael Medeiros de Oliveira Silva(2), Luis Orlando Duitama Carreño(2), Rafael Keith Ono(2),
Tássia Souza Bertipaglia(2), Michel Marques Farah(2), Danilo Domingues Millen(1) and Ricardo da Fonseca(1)
(1)Universidade Estadual Paulista (Unesp), Rodovia Comandante João Ribeiro de Barros, Km 651, CEP 17900-000 Dracena, SP, Brazil. E-mail: ligiacavani@hotmail.com, danilomillen@dracena.unesp.br, ricardo@dracena.unesp.br (2)Unesp, Via de Acesso Professor Paulo Donato Castellane, s/no, CEP 14884-900 Jaboticabal, SP, Brazil. E-mail: rafael.zte@gmail.com, lorlando82@hotmail.com, keith@zootecnista.com.br, tassia_bertipaglia@hotmail.com, michelmfarah@gmail.com
Abstract – The objective of this work was to evaluate the genetic diversity of Brahman cattle in Brazil with pedigree analysis. Genealogical records of a subpopulation were used considering all pedigree information (Pt) and the pedigree information divided into two periods (P1, from 1994 to 2004; and P2, from 2005 to 2012) or according to the raising system (Ppt, animals on pasture; or Pst, on stable). Estimates were obtained for average inbreeding coefficients, generation intervals (GI), number of equivalent known generation (CGE), number of founders (Nf), effective number of founders (fe), effective number of ancestors (fa), and founder genome equivalents (fg). The average inbreeding coefficients were 11.97, 7.79, 11.95, 11.74, and 11.31% for Pt, P1, P2, Ppt, and Pst, respectively. Average GI was 4.4 years, whereas CGE was 3.18. The fe values were similar to those of fa, which were greater than those of fg. The fe/fa and fg/fe ratios were close to 1, which indicates no genetic bottleneck and small losses by genetic drift. The genetic diversity in the Brazilian population of Brahman breed is not significantly reduced.
Index terms: beef cattle, founders, genetic bottleneck, inbreeding.
Diversidade genética de bovinos Brahman no Brasil
por meio da análise de pedigree
Resumo ‒ O objetivo deste trabalho foi avaliar a diversidade genética de bovinos da raça Brahman no Brasil com análise de pedigree. Registros genealógicos de uma subpopulação foram usados, tendo-se considerado toda a informação de pedigree (Pt) e a informação de pedigree dividida em dois períodos (P1, de 1994 a 2004; e P2, de 2005 a 2012) ou de acordo com sistema de criação (Ppt, animais a pasto; ou Pst, estabulados). Foram obtidas as estimativas de coeficientes médios de endogamia, intervalos de geração (IG), número equivalente de gerações conhecidas (EGC), número de fundadores (Nf), número efetivo de fundadores (fe), número efetivo de ancestrais (fa) e número efetivo de genomas remanescentes (fg). Os coeficientes médios de endogamia foram de 11,97, 7,79, 11,95, 11,74 e 11,31% para Pt, P1, P2, Ppt e Pst, respectivamente. O IG médio foi de 4,4 anos, enquanto o EGC médio foi de 3,18. O fe foi próximo de fa, cujos valores foram maiores que os de fg. As razões fe/fa e fg/fe foram próximas de 1, o que indica ausência de gargalo genético e pequenas perdas por deriva genética. A diversidade genética na raça Brahman no Brasil não está significativamente reduzida. Termos para indexação: bovino de corte, fundadores, gargalo genético, endogamia.
Introduction
Beef cattle breeding programs are important and have been used either to select straightbred animals or to produce cattle for crossbreeding. However, some technologies that contribute to increase selection intensity, such as artificial insemination, multiple ovulations, and embryo transfer, may decrease genetic gain when the same sires remain for a long time at the centers for semen collection, which results in a reduction in genetic diversity. This may also be related to the increased inbreeding coefficients in a given population (Weigel, 2001; Scraggs et al., 2014).
The objective of this work was to evaluate the genetic diversity of Brahman cattle in Brazil with pedigree analysis.
Materials and Methods
The initial data set used was provided by Associação
Brasileira de Criadores de Zebu and comprised 207,747 Brahman animals, born between 1994 and 2012, from the states of Espírito Santo, Goiás, Mato Grosso, Mato
Grosso do Sul, Minas Gerais, Rio de Janeiro, and São
Paulo, and from Distrito Federal, Brazil.
For estimates of the population parameters related to genetic diversity, the following information for each animal was considered: sire, dam, birth year, and sex. Based on this data set, pedigree was analyzed according to the genealogical records of the reference population, including: all pedigree information (Pt) from cattle born between 1994 and 2012; pedigree data divided into two periods, i.e., containing information of cattle born between 1994 and 2004 (P1) and of cattle born between 2005 and 2012 (P2); and pedigree data divided according to raising system, either on pasture (Ppt) or stabled (Pst). Animals either without information on the raising system (Ppt or Pst) or raised in both systems were not included in the analysis. Only animals whose minimum number of complete generation equivalents (CGE) was two or higher were
used (Gutiérrez et al., 2008). Data related to each
pedigree analysis are shown in Table 1.
The pedigree data were divided into two periods because the level of inbreeding increased considerably from 2005 onwards (Figure 1), probably because P1 was when the Brahman breed was introduced in Brazil and P2, the period of expansion. In addition, the Pst system included cattle used in livestock shows, whereas the Ppt system included animals raised on pasture in commercial herds for beef production. Therefore, considering the two distinct beef cattle production systems in Brazil, it is possible to evaluate the genetic diversity of Brahman animals in both of them.
The pedigree package (Coster, 2013) of the R software (R Core Team, 2011) was used to check data consistency and split the pedigree data set into Pt, P1, P2, Ppt, and Pst. Estimates of inbreeding coefficients, generation intervals (GIs), CGE, and parameter results based on the probability of gene origin (number of founders, effective number of founders, effective
number of ancestors, and founder genome equivalents) were calculated by the Pedig software (Boichard, 2002).
The inbreeding coefficient represents the probability that two alleles on a locus are identical by descent (Wright, 1922; Falconer & Mackay, 1996). The algorithm proposed by Meuwissen & Luo (1992) was used to calculate the inbreeding coefficients.
The GI was defined as the average age of the parents at the birth time of their progenies kept for reproduction (Falconer & Mackay, 1996). It was computed by averaging the following four gametic pathways: sire to son (Lss), sire to daughter (Lsd), dam to son (Lds), and dam to daughter (Ldd). The average GI was computed as follows: GI = (Lss + Lsd + Lds + Ldd) / 4.
Pedigree knowledge was assessed by the CGE, which summarizes the quantity of genealogical information known in a pedigree. For a given animal, it was calculated as the sum of proportions of known ancestors over all traced generations (Boichard et al., 1997).
The parameters calculated based on the probability of gene origin, according to Boichard et al. (1997), are detailed below. The number of founders (Nf) assumes that all founders are animals with unknown parents. In turn, the effective number of founders (fe) denotes the numbers of equally contributing founders that would result in the same level of genetic diversity in the current population, obtained according to Lacy (1989):
fe qk k
f
=
=
∑
1 2 1
where qk is the expected proportional genetic contribution of founder k, computed by the average relationship of the respective founder and each
Table 1. Number of pedigree records (n), number of sires and dams, and number of males and females, considering all pedigree information (Pt) and the pedigree information for the periods from 1994 to 2004 (P1) and from 2005 to 2012 (P2), as well as for cattle raised on pasture (Ppt) or stabled (Pst), in a Brazilian Brahman breed population.
animal in the population. The effective number of ancestors (fa), which is the minimum number of ancestors, not necessarily founders, explaining the complete genetic diversity of the current population, was also obtained according to Lacy (1989):
fa
q
kjj a
=
=
∑
1
1
where qj is the marginal contribution of an ancestor and j is the genetic contribution made by an ancestor that is not explained by the other ancestors chosen before. The number of ancestors (fa) accounts for recent bottleneck and, therefore, partially explains the loss of allelic diversity in the descendant population (Boichard et al., 1997). The founder genome equivalents (fg), considered the number of founders that would be expected to give the same level of genetic diversity in the population under study if the founders were equally represented and no loss of alleles occurred (Lacy, 1989), was computed as:
fg
p
r
j
j j Nf
=
=
∑
1
2
1
where Nf is the number of founders, pj is the contribution of founder j, and rj is the retention of alleles. The fg account for unequal contributions of
founders, bottleneck, and random loss of alleles due to genetic drift (Lacy, 1995).
The loss of genetic diversity due to unequal contributions of founders was estimated by 1 - GD*, where GD* = 1 - (1/2fe) (Caballero & Toro, 2000). Moreover, the loss of genetic diversity due to the genetic drift that had accumulated since the founding of the population was obtained by GD* - GD, where GD = 1 - (1/2fg) (Lacy, 1989, 1995).
Results and Discussion
Initially, the data base contained 207,747 animals, the mean CGE known was 2.36, and the average number of known ancestors per animal was 11.8, which reveals some failures in the pedigree records. After the selection of animals whose CGE was two or higher, the database was reduced to 94,369 animals, the mean CGE was 3.18, and the average number of known ancestors per animal was 22.7.
The results obtained for the CGE were similar for all groups formed considering all pedigree information, except in P1, which had lower mean CGE and average number of known ancestors per animal: 2.65 and 13.4, respectively (Table 2). This shows an increase in pedigree knowledge over the years and in the Brahman population as well, which agrees with Piccoli et al. (2014), who studied British breeds raised in Brazil. A small CGE was also reported by Faria et al. (2009) for Nellore, Gir and Guzera, which indicates that concern with genealogical records seems to be recent in Brazil. Gaps in pedigree data might decrease the precision of inbreeding coefficient estimates. Boichard et al. (1997) found that 10% of missing pedigree data are sufficient to underestimate the inbreeding coefficient; however, according to the same authors, the theory of the probability of gene origin to analyze genetic diversity is less sensitive to incomplete pedigree information.
The final genealogical record used in the present study contained information of 94,369 animals, and 86,801 (92%) presented some level of inbreeding, resulting in average coefficients of inbreeding for the whole population (inbred and noninbred animals) and for the inbred population of 11.97 and 13.02%, respectively. The maximum inbreeding coefficient observed for an animal was 40.62%. Inbreeding coefficients for the whole population (inbred and noninbred animals) were low for most of the inbred
Figure 1. Comparison between average inbreeding coefficients of the whole population (inbred and noninbred animals), expressed as percentage, and number of inbred animals between 1994 and 2012 in the Brazilian Brahman breed population.
0 2,000 4,000 6,000 8,000 10,000 12,000
0 2 4 6 8 10 12 14
1994 1996 1998 2000 2002 2004 2006 2008 2010 2012
Number of inbred animals
F mean
Year of birth F mean
animals: 5 to 10% for n=51; 10 to 15% for n=81,253; 15 to 20% for n=3,646; 20 to 25% for n=1,566; 25 to 30% for n=54; 30 to 35% for n=227; 35 to 40% for n=3; and 40 to 45% for n=1. Faria et al. (2010) and Santana Jr. et al. (2016) observed lower inbreeding coefficients for a Brazilian population of Brahman cattle: 0.49 and 2.10% respectively. However, other studies also showed increased inbreeding coefficients through the years (Faria et al., 2002, 2009; Brito et al., 2013).
The inbreeding coefficients considering the whole population, i.e., inbred and noninbred animals (Table 2) were close for Pt, P2, Ppt, and Pst (about 11%). However, the inbreeding coefficient was lower (7.79%) for P1 due to a smaller proportion of inbred animals. P1 comprises the period of Brahman breed introduction in Brazil, which resulted in a smaller proportion of related animals, leading to a shorter mean GI (Table 3). The inbreed coefficient values considering only inbred animals were also similar, ranging from 12.75 to 13.02%. These results may cause important losses, because the animal’s performance may be compromised by increasing inbreeding (Santana Jr. et al., 2010; Pereira et al., 2016).
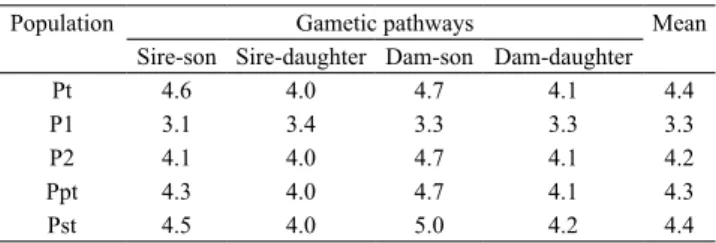
The GI is important because it measures how long the same sires or dams stay in a given population. The shorter the GI is, the greater the genetic gain becomes. In the present study, the average GI for Pt, P1, P2, Ppt, and Pst was 4.4, 3.3, 4.2, 4.3, and 4.4 years, respectively. In all analyzed situations, the GI increased through the years, which is an indication that older sires and dams stay in the herd for longer periods. The same was observed by Faria et al. (2010) and Santana Jr. et al.
(2016), although the average GI was longer: 5.5 and 6.95 years, respectively. In 2012, the mean GI was about 6 years, which was close to 7 years when only Pst was considered. The breeders’ choice for older animals is based on the greater accuracy in estimating genetic values, which may partially explain the results obtained in the present study. A shorter average GI was observed in P1, probably due to the initial period of Brahman breed introduction in Brazil. Using the GI estimates for the four gametic pathways, however, no major GI variation was found between gametic pathways in Pt, P1, P2, Ppt, and Pst (Table 3).
In all cases, the values for fe were similar to those of fa, which were greater than those of fg; furthermore, there was an increase in the values of the estimated parameters between the periods evaluated (1994 to 2004 and 2005 to 2012) and a decrease between Ppt and Pst, which is an indication of reduced genetic diversity in P1 and Pst.
The fe value was higher because it considers only the contribution of founders in the genetic diversity of the population. According to Boichard et al. (1997), fe may be overestimated when pedigree information is missing. However, fa is not overestimated in the same magnitude as fe, because it considers the number of ancestors (founders or not) needed to explain the total genetic diversity of the population. In this study, the estimative of fe was similar to that of fa, probably due to the pedigree consistency obtained when subjects with CGE of 2 or greater were included. Moreover, one of the most accurate parameters to explain genetic diversity in a given population is fg, because it considers alleles that were maintained in the population and takes into account the loss of alleles
Table 2. Estimates of average inbreeding coefficients considering all pedigree information and only inbred animals, as well as the number of complete generation equivalents (CGE), for the whole population (Pt), for cattle born between 1994 and 2004 (P1), for cattle born between 2005 and 2012 (P2), and for animals raised either on pasture (Ppt) or stabled (Pst), in a Brazilian Brahman breed population.
Item Pt P1 P2 Ppt Pst
All animals
Number of records (n) 94,369 16,312 91,606 51,343 20,766
Inbreeding coefficient (%) 11.97 7.79 11.95 11.74 11.31 Inbred animals
Number of records (n) 86,801 10,044 84,098 46,614 18,432
Inbreeding coefficient (%) 13.02 12.655 13.02 12.94 12.75 CGE 3.18 2.65 3.18 3.15 3.04
Table 3. Generation intervals for four gametic pathways and average generation interval in years, considering the whole population (Pt), cattle born between 1994 and 2004 (P1), cattle born between 2005 and 2012 (P2), and animals raised either on pasture (Ppt) or stabled (Pst), in a Brazilian Brahman breed population.
Population Gametic pathways Mean Sire-son Sire-daughter Dam-son Dam-daughter
Pt 4.6 4.0 4.7 4.1 4.4
P1 3.1 3.4 3.3 3.3 3.3
P2 4.1 4.0 4.7 4.1 4.2
Ppt 4.3 4.0 4.7 4.1 4.3
by segregation. According to these definitions, despite the slight differences in fg observed in the different situations evaluated, the genetic diversity in P1 and Pst is explained by a smaller number of animals (Table 4).
The larger the fe is, the greater the fe/fa ratio becomes; this means that, at some point, only few founders were chosen to be the parents of the next generation, which resulted in genetic bottleneck. However, according to the fe/fa ratios found in the present study, there was no genetic bottleneck, because values were equal to 1. The fg/fe ratio represents the magnitude of genetic drift, which means that the lower the fg/fe ratio is, the larger the genetic drift effect becomes. In this case, the fe is larger than fg, which shows that some sires in a given population are not used as often as others, and only those that have a larger number of progeny are capable of preserving their genome across generations. Therefore, the loss due to the unequal contribution of founders (1 - GD*), even if small, was greater than that of genetic diversity due to the genetic drift accumulated over nonfounder generations (GD* - GD) (Table 4). This shows that, in the present study, the effect of genetic drift was greater in Pt and P2, but, in general, this effect had little impact on all populations formed from the pedigree data set. When Pst and Ppt were compared, a lower fg/fe ratio was observed for Ppt, with 25% allelic loss by genetic drift, which may be explained by the greater availability of sires genetically
evaluated, resulting in the use of some sires more often than others in the same population; for Pst, the numbers of sires genetically evaluated was not large and, as a result, sires were used at similar frequencies.
In studies conducted in Brazil, a reduction in genetic diversity over the years has been detected in several breeds, such as Polled Nellore, Indubrasil, Gir, and Guzera, by pedigree analysis using estimates based on the theory of the probability of gene origin (Faria et al., 2002, 2009; Vozzi et al., 2006; Brito et al., 2013). A similar response – i.e., genetic bottleneck – regarding genetic drift, but at a lower intensity, was also observed by Faria et al. (2010) and Santana Jr. et al. (2016) for a Brahman population in Brazil. In addition, previous studies reported the use of some sires more often than others, including Brahman cattle; however, for the reference populations used in the present study, there was no evidence of genetic bottleneck. This divergence of results may be explained by the differences in the size and structure of the reference populations used.
Conclusions
1. The genetic diversity in the evaluated Brazilian population of Brahman breed is not significantly reduced.
2. Losses by genetic drift in the studied Brazilian population of Brahman breed are small.
Acknowledgments
To Fundação de Amparo à Pesquisa do Estado de São Paulo (Fapesp), for grants (No. 2014/09468-8); and to Associação Brasileira de Criadores de Zebu
(ABCZ), for data provided.
References
BOICHARD, D. Pedig: a fortran package for pedigree analysis suited for large populations. In: WORLD CONGRESS ON GENETICS APPLIED TO LIVESTOCK PRODUCTION, 7., 2002, Montpellier. Proceedings. Montpellier: INRA, 2002. p.13-28.
BOICHARD, D.; MAIGNEL, L.; VERRIER, É. The value of using probabilities of gene origin to measure genetic variability in a population. Genetics Selection Evolution, v.29, p.5-23, 1997. DOI: 10.1186/1297-9686-29-1-5.
BRITO, F.V.; SARGOLZAEI, M.; BRACCINI NETO, J.; COBUCI, J.A.; PIMENTEL, C.M.; BARCELLOS, J.; SCHENKEL, F.S. In-depth pedigree analysis in a large Brazilian Nellore herd. Table 4. Parameters based on the probability of gene origin
considering the whole population (Pt), cattle born between 1994 and 2004 (P1), cattle born between 2005 and 2012 (P2), and animals raised either on pasture (Ppt) or stabled (Pst) in a Brazilian Brahman breed population.
Parameter(1) Pt P1 P2 Ppt Pst RP 51,585 7,540 50,783 30,509 12,907 fe 5.40 4.50 5.40 5.10 4.6 fa 5.40 4.50 5.40 5.10 4.56 fg 3.84 3.84 3.85 3.84 3.83
Na 50% 5 3 5 5 3
fe/fa 1 1 1 1 1.01
Genetics and Molecular Research, v.12, p.5758-5765, 2013. DOI: 10.4238/2013.November.22.2.
CABALLERO, A.; TORO, M.A. Interrelations between effective population size and other pedigree tools for management of conserved populations. Genetics Research, v.75, p.331-343, 2000. DOI: 10.1017/S0016672399004449.
COSTER, A. Pedigree: pedigree functions. 2013. R package
version 1.4. Available at: ˂http://CRAN.R-project.org/
package=pedigree˃. Accessed on: Dec. 20 2014.
FALCONER, D.S.; MACKAY, T.F.C. Introduction to Quantitative Genetics. 4th ed. Harlow: Pearson, 1996. 371p.
FARIA, F.J.C.; VERCESI FILHO, A.E.; MADALENA, F.E.;
JOSAHKIAN, L.A. Estrutura populacional da raça Nelore Mocho.
Arquivo Brasileiro de Medicina Veterinária e Zootecnia, v.54, p.501-509, 2002. DOI: 10.1590/S0102-09352002000500008.
FARIA, F.J.C.; VERCESI FILHO, A.E.; MADALENA, F.E.; JOSAHKIAN, L.A. Pedigree analysis in the Brazilian Zebu breeds. Journal of Animal Breeding and Genetics, v.126, p.148-153, 2009. DOI: 10.1111/j.1439-0388.2008.00767.x.
FARIA, L.C. de; QUEIROZ, S.A. de; VOZZI, P.A.; LÔBO, R.B.; MAGNABOSCO, A. de U.; OLIVEIRA, J.A. de. Variabilidade
genética da raça Brahman no Brasil detectada por meio de
análise de pedigree. Pesquisa Agropecuária Brasileira, v.45, p.1133-1140, 2010. DOI: 10.1590/S0100-204X2010001000012. FERNÁNDEZ, J.; VILLANUEVA, B.; PONG-WONG, R.; TORO, M.A. Efficiency ofthe use of pedigree and molecular marker information in conservation programs. Genetics, v.170, p.1313-1321, 2005. DOI: 10.1534/genetics.104.037325.
GUTIÉRREZ, J.P.; CERVANTES, I.; MOLINA, A.; VALERA, M.; GOYACHE, F. Individual increase in inbreeding allows estimating effective sizes from pedigrees. Genetics Selection Evolution, v.40, p.359-378, 2008. DOI: 10.1186/1297-9686-40-4-359.
LACY, R.C. Analysis of founder representation in pedigrees: founder equivalents and founder genome equivalents. Zoo Biology, v.8, p.111-123, 1989. DOI: 10.1002/zoo.1430080203.
LACY, R.C. Clarification of genetic terms and their use in the management of captive populations. Zoo Biology, v.14, p.565-578, 1995. DOI: 10.1002/zoo.1430140609.
MEUWISSEN, T.; LUO, Z. Computing inbreeding coefficients in large populations. Genetics Selection Evolution, v.24, p.305-313, 1992. DOI: 10.1186/1297-9686-24-4-305.
PEREIRA, R.J.; SANTANA JR, M.L.; AYRES, D.R.; BIGNARDI, A.B.; MENEZES, G.R.O.; SILVA, L.O.C.; MACHADO, C.H.C.; JOSAHKIAN, L.A.; ALBUQUERQUE, L.G. Inbreeding depression in Zebu cattle traits. Journal of Animal Breeding and Genetics, v.133, p.523-533, 2016. DOI: 10.1111/jbg.12219. PICCOLI, M.L.; BRACCINI NETO, J.; BRITO, F.V.; CAMPOS, L.T.; BÉRTOLI, C.D.; CAMPOS, G.S.; COBUCI, J.A.; MCMANUS, C.M.; BARCELLOS, J.O.J.; GAMA, L.T. Origins and genetic diversity of British cattle breeds in Brazil assessed by pedigree analyses. Journal of Animal Science, v.92, p.1920-1930, 2014. DOI: 10.2527/jas.2013-7283.
R CORE TEAM. R: a language and environment for statistical computing. Vienna: R Foundation for Statistical Computing,
2011. Available at: ˂http://www.R-project.org/˃. Accessed on: Aug. 30 2014.
SANTANA JR., M.L.; OLIVEIRA, P.S.; ELER, J.P.; GUTIÉRREZ, J.P.; FERRAZ, J.B.S. Pedigree analysis and inbreeding depression on growth traits in Brazilian Marchigiana and Bonsmara breeds. Journal of Animal Science, v.90, p.99-108, 2010. DOI: 10.2527/jas.2011-4079.
SANTANA JR., M.L.; PEREIRA, R.J.; BIGNARDI, A.B.; AYRES, D.R.; MENEZES, G.R.O.; SILVA, L.O.C.; LEROY, G.; MACHADO, C.H.C.; JOSAHKIAN, L.A.; ALBUQUERQUE, L.G. Structure and genetic diversity of Brazilian Zebu cattle breeds assessed by pedigree analysis. Livestock Science, v.187, p.6-15, 2016. DOI: 10.1016/j.livsci.2016.02.002.
SCRAGGS, E.; ZANELLA, R.; WOJTOWICZ, A.; TAYLOR, J.F.; GASKINS, C.T.; REEVES, J.J.; AVILA, J.M. de; NEIBERGS, H.L. Estimation of inbreeding and effective population size of fullblood wagyu cattle registered with the American Wagyu Cattle Association. Journal of Animal Breeding and Genetics, v.131, p.3-10, 2014. DOI: 10.1111/jbg.12066.
VOZZI, P.A.; MARCONDES, C.R.; MAGNABOSCO, C. de U.; BEZERRA, L.A.F.; LÔBO, R.B. Structure and genetic variability in Nellore (Bos indicus) cattle by pedigree analysis. Genetics and Molecular Biology, v.29, p.482-485, 2006. DOI: 10.1590/S1415-47572006000300014.
WEIGEL, K.A. Controlling inbreeding in modern breeding programs. Journal of Dairy Science, v.84, p.177-184, 2001. Supplement. DOI: 10.3168/jds.S0022-0302(01)70213-5.
WRIGHT, S. Coefficients of inbreeding and relationship.
American Naturalist, v.56, p.330-338, 1922. DOI: 10.1086/279872.