WATER RESOURCES RESEARCH, VOL. 32, NO. 12, PAGES 3553-3570, DECEMBER 1996
Contributions of water-rock interactions to the composition
of groundwater in areas with a sizeable anthropogenic input:
A case study of the waters of the Fundão area,
central Portugal
Fernando Pacheco
Secção de Geologia, Universidade de Trás-os-Montes c Alto Douro, Vila Real, Portugal
Corne
li
s
H.
van der Weijden
Dcpartment of Geochemistry, Institutc of Earth Scicnccs. Utrecht Univcrsity, Utrccht, Nctherlands
Abstract. We used
a combinalion of a gro
uping algorithm
and
a
weath
ering
algorithm
lo
asscss
the
contributions
made
by chemical wca
th
e
ring
and
anthropogenic
inputs
to
thc
groundwater composition in
a granitoid area.
The
fi
rst a
lgorithm is
based
on
the
mathematical
concept of eq
uiva
lent relations
between
objects and
i
s
used
to find
groups of
water samples.
Using the grouping algori
thm, we identified groups with
similar chemistries
in
a
se
t
of
data rclating
to the water composition
in
160
springs and wel
ls
in
the
Fundão
area (Portugal). T
he second
a
lgorithm is
based
o
n
stoichiometries,
mass, and
chargc
balances
in
weathering
reaclions and is
uscd
to
re
l
ate
thc
watcr
composition of
each
identified
group
lo
water-m
incral interactions
in
lhe area
.
Background
informatio
n
o
n
the
p
etrology and
mineralogy
of the area allowed
us to
choose
the most realistic
water-mineral
interaclio
ns.
We also
had
information about
the
use and composition
of
fertilize
rs
in
this agricultura! area.
ln
applyi
ng
the
weather
ing algorithm
we considered
ati dissolved
sílica an
d
bicarbonate to
be
produccd
by
chemical
weathering
a
nd
ali
dissolved
chloride,
s
ulphate,
and
nit
rate to
be
derived from other
so
urces,
ma
inly
from fertilizcrs. T
he
a
nthropogenic
contributions to
the
water chemistries
in thc
area are
high.
Despite
thc
high
background concentrations derived from pollutio
n, we were able to assess the
conlribu
tion of weath
ering
to lh
e
water c
hcmislries. We obtained realistic results
with the
two algo
rithms,
s
upported
by
the
fact
that
thc
spatia
l
distribution of the
samples
belonging
to
the
vario
us groups shows a good corre
lalio
n with the gcology
and
pe
tro
logy
of
thc a
rea.
Introduction
The composition of natural watcrs is dctcrmined by a num-bcr of processes, which includc wct and dry deposition of atmospheric salts, evapotranspiration, and water-soil and watcr-rock interactions. Gan·els and Mackenzie [ 1967] pre-scnted a classical analysis of thc natural processes responsible for the composition of springs and groundwater in a pristine arca. First, they corrccted the water composition for atmo-spheric input and thcn, step by step, they used the cations, anions, and dissolved sílica to reconstruct the primary minerais from their seeondary weathering products until ali dissolved eomponents had bcen used. From the stoichiomctry of these reversc weathering reactions thcy estimated the mass of the primary minerais involved in the water-rock interactions. Quite a number of studics on the relation between groundwater composition and water-rock intcraction have been carried out since then. We refer to work published by Garrels [1967], Tardy [1971], Tardy e/ a/. [1973], Paces (1971, 1973], Drever [1988], Sverdrup and W(llfvinge (1991], and Velbe/ [1985a, b, 1989, 1992 J and rcferences therein. Thcse studies were carried out in arcas with a minimum anthropogcnic input. Such areas are Copyright 1996 by the American Gcophysical Union.
Papcr numbcr 96WR01683. 0043-1397/96/96WR-O t 683$09.00
becoming incrcasingly scarce, and in many areas the groun d-water eontains a considerable amount of ehemicals derived from human activities.
ln inhabitcd arcas, especially where therc is intensive agri-culture and/or industry, the water composition is usually af-fccted by fertilization and manuring, by leachatcs of solid waste, and by domestic and industrial effiucnts. ln general, thcre is no casy way to distinguish between the contributions made by natural sourccs and thosc made by anthropogenic sources. The only componcnts that in alllikclihood, are solely or at lcast predominantly derivcd from water-rock interactions are sílica and bicarbonate. ln this paper wc will discuss thc results of a mcthod that combines a mathematical algorithm (bascd on the concept of equivalcnt rclations) that can identify groups in a sct of groundwater analyses and a wcathering algorithm that relates the group medians to water-mineral intcractions. The watcr samplcs wcrc collected in the Fundão arca (Portugal), situated in a granitoid complcx intersected by a number of aplitcs and basic dikcs.
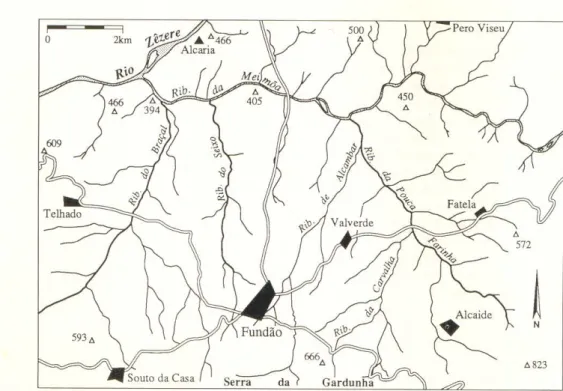
The Fundão
Area
Thc Fundão arca (Figures 1 a and lb) is situated in the province of Beira Baixa (central Portugal). The arca is located at thc confiuence of the Zêzere and Meimoa rivers. The lowcst part of the arca lics about 400 m above sea levei. The Serra da 3553
3554 PACHECO ANO VAN DER WEIJDEN: CONTRIBUTIONS OF WATER·ROCK INTERACTIONS
PORTUGAL
Fundão
•
Figure la. Geographical map of Portugal indicating the po-sition of thc Fundão area.
Gardunha, bordering the area in the south, has peaks between 1200 and 1300 m abovc sca levei. Hills bordering the area to the east and west have altitudes of between 500 and 600 m. This leads to a general drainage pattern in the NW direction, but the drainage pattern is also controlled by the SSW-NNE dircction of faults in this region. The strcamlets are intersected by the Rio da Meimoa, which crosses the area from east to west just south of Alcaria. The streamlets from the Serra da Gardunha are
pcrcnnial, but upon reaching the valley most of their water dis-appears into the weathered granitoid subsoil. During summer, water is transported mainly through streambed graveis.
The groundwater ftow in the area depends on the topogra-phy of the contact between fresh and weathered rocks. The system of joints does not have a large storage capacity. The arca, more specifically the southern part, has many springs, most of them perennial. Many wells have been dug in the area, mainly in the vallcy. Thc wclls that are dose to the streambeds give large yields, but farther from the beds the yields are small (a few cubic meters per day).
The climate is very good for agriculture; this is concentrated in the southern part, where there is a plentiful water supply. The poor granitic soil has to be fertilized. Besides the nutrients nitrate, ammonium, phosphate, and potassium, the locally ap-plied fertilizers also contain high amounts of calei um, chloride, and sulphate and minor amounts of sodium. Fertilizcrs high in magnesium are also frequently applied in apple and cherry orchards in the area. The fertilization has a large impact on the water chemistry. As a first-order working hypothesis, we as-sume that the application of fertilizers has resulted in a steady state occupancy of exchange sites by the major cations. The atmospheric input of carbonate particles is negligible and lim-ing of the soils in the area is only sporadic. Therefore one is justified in assuming that all bicarbonate is derived from water-rock interaction.
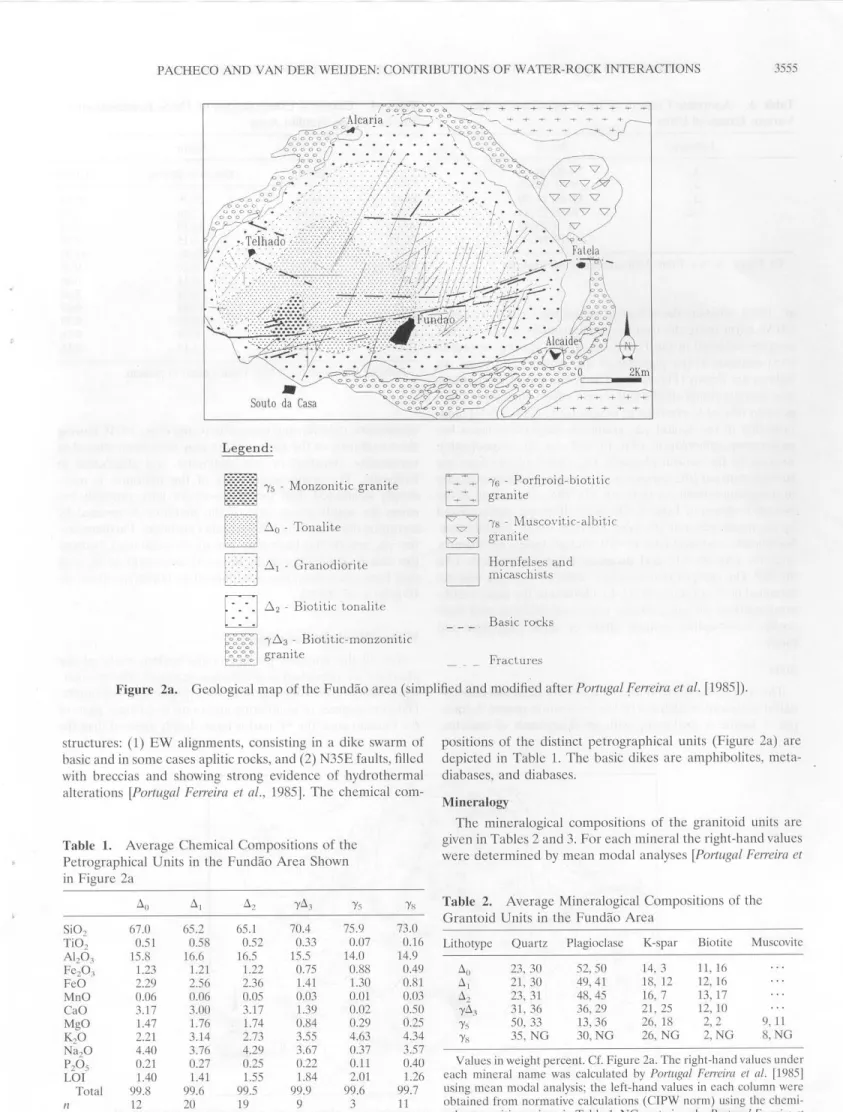
Petro
l
ogy
and
Mineralogy
PetrologyThe Fundão plutonite has an exposed area of approximately 100 km2. The main lithological types present (Figure 2a) are tonalites, although some granites and monzonitic granitcs ap-pear in places. Thesc units are cut by two dominant types of
Figure lb. Blow-up of thc Fundão area with the major villagcs (black polygons) and connecting roads ( double !ines), the rivers Zczcrc and Meimoa and their tributary streams and streamlets, topographical heights (triangles with altitudes in meters above sea levei), and the position of the Serra da Gardunha.
PACHECO ANO VAN DER WEIJDEN: CONTRIBUTIONS OF WATER-ROCK INTERACTIONS o o o o o o O ~ + +- + + + ~ + - + ~ ~ Alcaria J~~-00oo ~.,__,_+ -+- + +...,....-+-- -t oooo0~. ~. ~ . . . 0 0o0o ~ ... - -+ oooooooooot? • • • • • • • • ~ oooooo - . . . _ _ 0 0 0 0 0 0 ;. 0 0
000
°
0
°
0
~:•}_.·,•
'/0
··
;:·:::~:
~
0 0 {'7'7:'7:
ooo~r.'
,' · · · · t~~
· ; - \ . "Ç7 "Ç7 "Ç7 -~~ • .-• • - . • • • • • • • • • o " 'o o· ·
·.·~R·
·
·
~ 0 o0: 0 o0o o0o0:~a 2Km o o o o o oo0~;>S'?oooooo o o o o o o o o~C7'0 o o 6--&o(:::::...:('q"o o o o Sou lo da Casa o o o o o o o o o o o0o0o0~ 00 o0o0o0o0ouo
o + + + o o 00000 o + +- + + + -t-Legend: • "fs -Monzonitic granite[
:
::::
!l
~o
-
Tonalite!>>l
~
1
- Granodiorite:
:
:::
1
6.
2 - Biotilic tonalile§
"(6.3
-
Biotitic-monzonitic~ granite
"(6- Porfiroid-biotitic granitc
"fs - Muscovitic-albitic granile
Hornfelse~ and micaschists
Basic rocks
Fractures
Figure 2a. Geological map of the Fundão area (simplified and modified after Portugal feiTeira et al. [1985]). 3555
structurcs:
(1) EW
alignments, consisting in a dike swarm of basic and in some cases aplitic roeks, and (2) N35E faults, filled with breccias and showing strong evidence of hydrothermal alterations [Portugal Ferreira et al., 1985J
. The
chemicalcom-positions of the distinct petrographical units (Figure 2a) are depicted in Table 1. The basic dikcs are amphibolites,
mcta-diabases, and diabases. Mineralogy
Table 1. Average Chemical Compositions of the
Petrographical Units in the Fundão Area Shown in Figure 2a
Llu ll, Llz yil3 'Ys
Si02 67.0 65.2 65.1 70.4 75.9 Ti02 0.51 0.58 0.52 0.33 0.07 Alz03 15.8 16.6 16.5 15.5 14.0 Fe203 1.23 1.21 1.22 0.75 0.88 FeO 2.29 2.56 2.36 1.41 1.30 MnO 0.06 0.06 0.05 0.03 0.01 CaO 3.17 3.00 3.17 1.39 0.02 MgO 1.47 1.76 1.74 0.84 0.29 K20 2.21 3.14 2.73 3.55 4.63 Na20 4.40 3.76 4.29 3.67 0.37 PzÜs 0.21 0.27 0.25 0.22 0.11 LOI 1.40 1.41 1.55 1.84 2.01 Total 99.8 99.6 99.5 99.9 99.6 n 12 20 19 9 3
V alues given in percent; n, numbcr of samples.
'Ys 73.0 0.16 14.9 0.49 0.81 0.03 0.50 0.25 4.34 3.57 0.40 1.26 99.7 11
The mincralogical compositions of the granitoid units are given in Tablcs 2 and 3. For each mineral tbe right-hand values were determined by mcan modal analyses [Portugal Ferreira et
Table 2. Avcrage Mineralogical Compositions of tbe Grantoid Units in the Fundão Area
Lithotypc Quartz Plagioclase K-spar Biotite Muscovite
Llo 23, 30 52,50 ll, 21, 30 49,41 Llz 23, 31 48,45 yil3 31, 36 36,29 'Ys 50, 33 13,36 'YH 35, NG 30,NG 14, 3 18, 12 16, 7 21, 25 26, 18 26, NG li, 16 12, 16 13, 17 12, 10 2,2 2,NG 9, 11 8,NG V alues in weight percenl. Cf. Figure 2a. The right-hand valucs under each mineral name was calculated by Portugal Ferreira et a/. [1985] using mean modal analysis; the left-hand valucs in each column were obtained from normative calculations (CIPW norm) using lhe chemi-cal compositions givcn in Table I. NG, nol given by Portugal Fetreira et
3556 PACHECO AND VAN DER WETJDEN: CONTRfBUTIONS OF WATER-ROCK INTERACTJONS
Table 3. Anorthite Content of the Plagioclases in the
Various Grantoid Units
Lithotype An,% 25-30,20-33 8-32,20-33 11-45,24-30 6-20,22-44 0,20-45 0-17, NG
Cf. Figure 2a. Sce Table 2 for additional information.
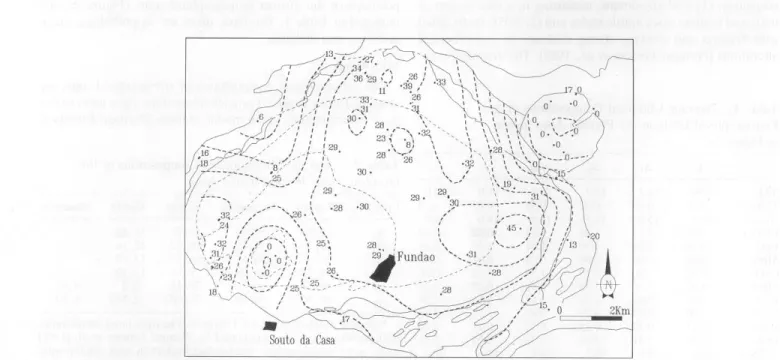
a!., 1985], whcrcas the left-hand values were calculated by a CIPW norm using the chemical compositions of the 74 rock samples collected in the Fundão area. The average anorthite (An) contcnts of the plagioclases are plotted, and some An isolines are drawn (Figure 2b ). CIPW norma tive calculations
give average compositions and do not reveal changes in com-position relatcd to zonation of plagioclases. Costa (1971]
men-tions that in thc y5 and yil3 granitoids plagioclasc has a
ho-mogeneous composition (An 10 and An 20, respectively), whereas in the central plutonite (il0_2 ) the plagioclases are
strongly zonated (the composition of single minerais may vary in composition from An 18 to An 37). The composition of the biotites is shown in Table 4. The basic dikes are characterized by thc major minerais [Portugal Ferreira, 1982]: amphibolites:
hornblende, andesine (An 40-50); metadiabases: hornblende,
andesine (An 40-50); and diabases: augite, labraclorite (An 50-70). Thc composition of aplitic clikcs in thc area was
cle-termined by Costa et al. [1971]. ln addition to the more
weath-ering-rcsistant minerais quartz, potassium feldspar, and mu s-covite, these aplites contain albitc or sodic oligoclasc anel
biotitc.
Soils
The soils in the Fundão arca havc a homogeneous mineral -ogical composition, defined by the association quartz
+
felds-par+
biotite+
halloysitc, with sma!J amounts of smectite,•
' ' ''
'
Souto da CasaTable 4. Chemical Compositions of Three Rcprescntativc
Biotites in the Fundão Area
Colo r
Brown Grccn to Brown Grecn
Si02 36.78 27.39 37.96 Ti02 2.68 2.66 2.98 Al203 15.75 16.19 15.01 Fe203 3.90 3.15 4.58 FcO 16.77 16.86 14.91 MnO 0.26 0.27 0.28 CaO 0.11 0.14 0.05 MgO 8.34 8.76 8.96
Kp
9.93 9.04 9.67 Na20 0.69 0.84 0.75 PzÜs 0.29 0.30 0.26 H2o+
3.60 3.12 3.16Portugal Ferreira et ai. 119851. Valucs givcn in pcrccnt.
vermiculite, chlorite, and muscovite [Costa et al., 1971]. During the weathering of the rocks, biotite may havc becn altcred to vermiculite, smectite, or even halloysite, and plagioclase to
halloysite. The southeastern part of the plutonite is more
cleeply weatherecl than the northwestcrn part, probably
be-cause the southcastcrn part of the plutonite is covcrcd by
torrcntial deposits from thc Serra da Gardunha. Furthermore, the yil3 granite has been very intensively weathered, because this unit is clenched between the more consistent schist rings that have oftcn bcen mctamorphozecl to hornfclses [Van der Weijden et al., 1983].
Water-Rock Interactions
Not all the minerais prescnt in thc various rocks of thc plutonite are important as wcathcring rcactants. Thc weather-ing products are mainly derived from plagioclase anel biotite. Different degrees of weathering are found in diffcrcnt parts of
the Fundão area: the
SE
part is more cleeply affectecl than the2Km
Figure 2b. Contours of iso-anorthite contents (5% increments) of plagioclases, catculatcd on thc basis of analyses of 74 rock samples collected in the Fundão area.
PACHECO AND VA DER WEIJDEN: CO TRIBUTIONS OF WATER-ROCK INTERACTIONS 3557
Table Sa. Assumed Weathering Model for the Plutonite
Major
Primary
Minerais
Weathcring Products/Proccsscs
Plagioclasc Plutonitc• Faultst Biotitc Plutonitc• Faults-t Light a b c e Modera te Jntcnsivc a a b b c! d c e
Plagioclasc: An 7 for y5 anel Ys; An 20 for y.l~; An 20-40 for .10 _2•
llcrc a, halloysite; b, (c 1 ) Ca-montmorillonitc
+
(I - c 1 ) halloysitc;c, unwcathcrccl; d, (c1 ) vermiculite + (1 - c1 ) halloysite; e, (c1) vcrmiculite + (I - c 1 ) halloysitc; O ~ c 1 ~ I.
Rclativcly gooel elrainage conelitions.
tMorc stagnant conelitions.
NW, and the 1'~3 granite has been intensively weathered. The
N35E fault system may also control the water chemistry by creating more stagnant conditions of flow. These aspects are consiclered in Table 5a. A similar dominance of reactions was
taken into account by Tardy e/ al. (1973] for the weathcring of granites intempera te di mates. Where dikcs cross the plutonite
thcy may also control thc water chemistry. Thc most probable
alteration processes that occur in the aplitic and basic dikcs are
reprcsented in Table 5b.
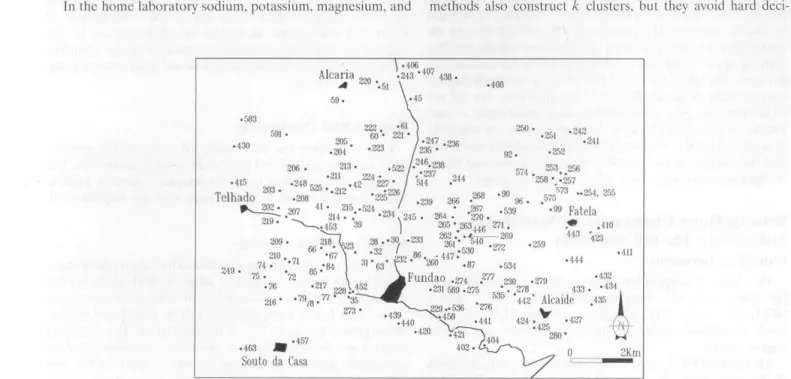
Sampling and
Analysis
Samplcs from springs anel wells in the Fundão arca were collected for severa! years in succession. The locations of
1
60
sampling sites are shown in Figure 3. The analytical methods
that were used have been described by Van der Weijden et ai. [ 1983
J.
These methods will be briefiy summarized here. Con -ductance (Ec) and pH were measured immediately at the sam-pling si te. ln a field laboratory alkalinity was determinecl, using the Gran plot method, within 24 hours after collecting the samples.ln the home laboratory sodium, potassium, magnesium, and
Table Sb. Assumed Weathering Model for the Dikcs Rock Typc
Aplites
Amphibolitcs anel
metaeliabases
Dia bases
Wcathcring Rcactions of thc Major Minerais
albitc -> halloysitc andcsinc -> (c1 ) MgCa-montmorillonitc
+
(I c 1) halloysitc hornblcndc --> (c 1) MgCa-montmorillonitc+
(I c 1) chio ri te lahradoritc --> (c 1 ) MgCa-montmorillonitc + (I c 1 ) halloysitc augitc --> (c 1 ) MgCa-montmorillonitc + (I - c1) chloritcPlagioclase: An 7 for thc aplitcs, An 40 for thc amphibolitcs anel
mctaeliabascs, anel An 60 for thc dia bases; O :!':: c 1 ~ I.
calcium were determincd by routinc atomic absorption (AAS)
or inductively coupled plasma spcctromctry (ICP-AES). Thc
sulphate concentration was dctcrmincd by turbidimetry or by
ICP-AES. The phosphate, silica, anel nitrate concentrations
were determined by colorimctry. House stanclards were used
for calibration. The relativc standard deviations for the indi-vidual conccntrations were in most cases less than 5%. Thc
cleviation of the charge balance was lcss than I 0% of the total
ionic charge. As onc might cxpect, thc highcr relativc dev
ia-tions within this range wcrc usually (ound for samples with low concentrations of dissolved components.
Grouping Water
Samples With Similar
Chemistries:
The
RST
Algorithm
Partitioning Methods
Conventional partitíoning methods [cf. Hartigan, 1975; E
ver-iii, 1977) construct clusters from a data sct. Thc number of clusters, k, is given by thc uscr. anel each objcct must belong to one group only. ln ordcr to obtain the k clusters, some meth-ods select k representativc objccts in the data sct, anel the corresponcling clusters are thcn founcl by assigning each
re-maining object to the ncarcst rcprcsentativc objcct. Fuzzy
methods also construct k clusters, but they avoid hard clcci
-·406 AI caria 220 ·243 •407 436. 591. 206. A '·51 ·408 59· 205. ·204 222. 60• ·223 213 • • 522 574 • 253.-256 5 ·211 224 • .244 258 • •257 ·4t 203• ·248525 •• 212.42 • ~~
.oo
;,
73 ..,, ""< Telhado ·208 225 •239 266 .268 96• 575 •• ..,.., <.oN ~ 207 41 • 2t5.·524 • ,2il7 ·539 • ·99 Falela 219 • -.... 214 • • •234 )245 • 2Jl4 • 270. • ...._,•453 39 265 ',263H6 '<ll. .• .410 30 233 262 •• ~269 443423
200. 66 ~t8. 28 ••I
·
261• 54o •272 •259 210 •67 •32 86. • 447:530 74 • '•71 '84 31. 63. • 260 ·87 ·534 ·444 ·4ll 249 • 75 •'
n
85 • Funda o•
'<~
4
:m
230 .279 '432 ·76 ·217 228 •• 452 ·231589·'<15 •• '<18 433··
4434
216 • ·79.16•n
·
'35 ·~ 535 '412' Alcaide ,435 273 • ..536 .,6 "' • 43?440 ~58 -441 424 • • 4'<1 • 420 :-421 • 425 280 • ·463 • ·457 404 Souto da Casa 402 • • O 2Km3558 PACHECO AND VAN DER WEIJDEN: CONTRIBUTIONS OF WATER-ROCK INTERACTIONS
sions by using the fuzziness principie. Instead of deciding that an objcct belongs to cluster 1, fuzzy methocls can, for example,
decide that 70% of an object belongs to clustcr I, 20% to cluster 2, and LO% to cluster 3. This mcans that thc object
should probably be assigncd to cluster 1 but that there is still doubt about whether it should be assigned to cluster 2 or 3
[Kaufman and Rousseeuw, 1990].
Convcntional anel fuzzy mcthods nced a priori good es ti-mares of the number of groups present in the data set. This is often impossible when one is dealing with grounclwatcr data
scts bccausc thc numbcr of groups that are present will depend
on (I) the number of rock types in the area, (2) the degree of chemical weathering of various rock types, and (3) inputs from
sources other than water-rock interactions. All these factors
affect the water composition and in combination may gencrate
a high numbcr of watcr groups. Thcsc clustcring mcthods also
assume that thc variables measured on each object (water sample) bclong to normal or lognormal populations, which in many cases might be a hard assumption.
Partitioning Using the Concept of Equivalent Relations ln ordcr to avoid the drawbacks of thc conventional cluster -ing methods, we were in need of a more powerful method to iclentify water samples with similar chemistries. ln mathemat
-ical terminology water samples within thcse groups will have equivalent rclations, meaning that they are in the sarne equiv-alence class of "sameness" by their chcmistrics. Thc rcftcxivc,
symmctric, and transitive (RST) algorithm has been developed
for finding groups of water samples with similar chemistries in
a data set. A full description of thc algorithm is givcn in
Appendix l.
Grouping the Water Samples From the Fundão Data Set
As mentioncd in Appcnclix 1, thc rcsults obtained with the
RST algorithm depcnd on thc scalc in which the data are cxprcsscd. Wc applied the algorithm to the data set in thc
micromoles per liter and microequivalents per liter scales, but we obtained the most meaningful results using thc micrograms
per li ter scalc. Thc bcttcr performance of the latter scale might
be clue to avoidancc of a closcd-sum effect by introducing the
charge balance condition using thc microequivalcnts per litcr scalc or approaching this conclition by using the micromoles
per liter scale. We also testecl the effect of standardizing the
data set prior to the application of the algorithm, but thc use
of the raw data gave geochemically more mcaningful results. Finally, we tested thc cffccts of changing the order in which the data are uscd in the third step of the RST algorithm and found that the changes in the grouping were only minor and that if
changes occurred, these wcrc bctwccn similar groups.
Relating Water Chemistries
to
Water-
Rock
Interactions: The
SiB A
l
gorit
hm
Water-Rock lnteractions
The chemical composition of groundwater, characterized by the major inorganic compounds Na+, K+, Mg2+, Ca2~,
HC03 , C!-, so~-, NO:) and clissolvecl sílica (H
2
Si0~), is thcrcsult of chemical weathering anel of atmosphcric and
anthro-pogenic inputs.
Ali elissolvecl HC03 and H2Si0~ are assumeel to be proclucts
of chemical weathering of autochthonous minerais. This
con-elition is not mct in areas with sizable input of Jimestone clust
or application of calcium carbonate on agricultura! !anel, which, as mcntioneel alreacly, can bc ncglcctecl in this arca. Wc
also have no inelications for seconelary precipitation of carbon -atc or sílica. Alkalinity of grounelwater may change, either by selective uptake of nitrate in exchange with bicarbonate or by
harvesting of crops which have taken up cations in excess over
anions from soil water in exchangc with protons. For a rcgion
with a mixture of agriculture, viniculture, fruit culture, forestry,
anel uncultivated areas with grasses and scrubs, it is impossible to quantify thc nct cffcct of such changcs in alkalinity. We
assume that in the Fundão region these processes have rel
a-tively little effect on the general leve! of alkalinity acquired by water-rock interactions uncler soil P co,· We also assume that loss of clissolveel silica by uptake in harvcstcel crops is negligi -ble. Garrels [1967] showcel that elissolvcel HCO:J anel H2Si0~ anel their ratios are goocl eliagnostic parameters for particular water-mineral interactions. As a working hypothcsis, dissolveel
C! , SO~ anel N03 are consiclercel to come from atmospheric
anel pollution sources. The presence of pyrite as a potential source of sulphate can be neglectecl in the area. The concen
-tration of each cation is separa teci in two partia! contributions,
one relatcel to thc wcathering reactions, anel the othcr rclatccl
to pollution. ln oreler to quantify these partia! contributions we
elevelopeel a weathering algorithm, which we calleel the SiB
(silica-bicarbonate) algorithm. This algorithm is elescribecl in eletail in Appenclix 2.
Relating Water Compositions to Chemical Weathering of Rock-Forming Minerais
Wc useel the SiB algorithm to relate water compositions to weathering reactions. ln brief, the assumption made in this algorithm is that elissolvcel sílica anel bicarbonatc are cx
clu-sivcly proeluccel by chemical weathering of the elominant pri -mary minerais into seconclary (clays) minerais. The other m
a-jor anions are considered to have come from atmospheric anel
anthropogenic sources. Knowing the principal primary rock -forming minerais in the area anel thcir most likcly weathcring proclucts, the SiB algorithm uses stoichiometries of the weath-ering reactions to relate thc chemistrics of groups of watcr, as
iclentifiecl using the RST algorithm, to the contributions of
watcr-rock interactions as well as of other sources. ln this
manncr we can make quantitative estimates of the contribu
-tions ma ele by water-mineral rcactions anel othcr sourccs to the watcr compositions.
Results
a
nd
Discussion
Figure 3 shows thc distribution of a set of 160 samples
collected from springs anel fresh wells in the Fundão area. The chcmical composition of the water samples is given in Table 6.
This information was compilcel from Van der Weijden et a!.
[19
83
]
.
Results of the RST Algorithm
The results of the procedure followecl to finei groups ofwater
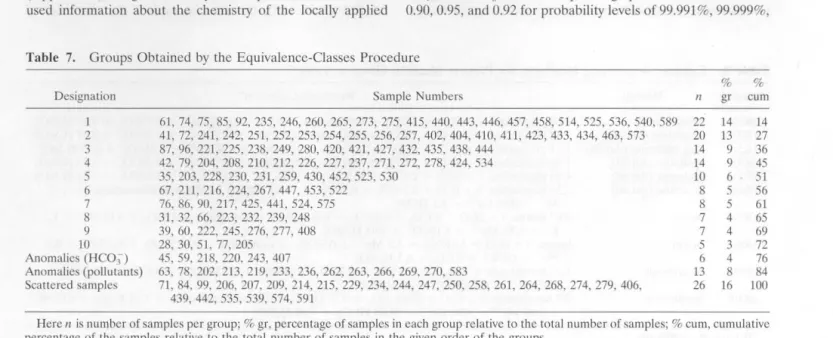
samples with similar chemistries using the RST algorithm are summarizecl in Table 7. Groups 1 to J O of Tablc 7 ( cquivalence
classes with tive or more samples) will be consiclerecl further. These groups represent 72% of the population. The remaining
samplcs are classifieel either as anomalics, because they havc abnormally high concentrations in one or more of the ions (12% of the population), oras scattereel samples, because they elo not show any remarkable characteristic (16% ). The ano
m-PACHECO AND VAN DER WEIJDEN: CONTRIBUTIONS OF WATER-ROCK INTERACT!ONS 3559
Table 6.
Da
t
a S
et
Nr T Na+ K' Mg2+ Ca2+ Cl- so~ N03 HCO] H2Si03
28 3 613 39 245 433 447 178 371 780 656 30 3 691 38 242 468 493 229 460 844 639 31 2 613 15 129 315 430 93 387 490 506 32 3 491 31 100 260 287 65 371 390 558 35 3 639 25 183 320 353 171 221 729 614 39 2 406 17 121 128 235 65 216 620 260 41 3 332 19 74 180 192 99 55 261 463 42 3 396 8 58 8 132 63 139 370 421 45 2 1070 55 387 488 680 232 121 1280 571 51 2 817 36 275 650 508 229 189 780 100 59 2 1683 52 683 1142 2152 318 150 2260 674 60 3 433 13 126 217 252 79 63 561 524 61 3 439 li 93 158 235 42 18 580 560 63 2 704 76 300 622 803 367 998 229 399 66 3 530 7 192 325 301 162 366 480 474 67 3 591 9 129 236 247 2 >>O 1052 684 71 3 470 16 192 199 186 217 5 639 626 72 3 330 6 19 13 166 28 I 239 478 74 3 424 14 80 146 152 22 32 661 609 75 2 313 7 105 88 141 31 1 480 399 76 2 374 11 150 200 158 46 5 810 503 77 3 792 20 204 405 560 119 258 851 499 78 2 1796 197 400 630 1693 236 875 918 438 79 3 407 11 113 136 184 63 121 410 634 84 3 509 7 171 221 313 161 211 451 426 85 3 425 9 88 221 172 47 82 590 606 86 3 570 25 183 200 284 18 60 870 663 87 3 470 2 92 123 247 89 L 451 613 90 3 535 11 150 181 252 63 47 761 506 92 2 452 14 92 145 189 58
»
O
580 552 96 2 591 11 75 73 341 29 32 480 652 99 2 752 21 171 248 577 183 37 600 353 202 2 856 43 419 708 1320 654 840 139 573 203 2 677 25 196 272 379 209 185 610 440 204 2 527 11 114 126 258 865 158 352 657 205 2 748 23 296 375 545 202 380 716 485 206 2 731 21 156 207 689 145 37 472 441 207 2 708 13 236 422 631 238 500 244 489 208 3 433 11 75 88 184 86 92 328 474 209 2 567 21 107 213 235 161 240 367 532 210 3 362 11 45 75 186 38 82 389 626 211 2 716 69 232 381 402 192 71 1080 587 212 3 397 27 70 130 86 86 143 357 603 213 2 830 32 337 556 703 216 855 429 405 214 3 528 11 112 229 224 219 203 215 437 215 3 457 345 125 170 123 87 18 690 564 216 3 518 14 213 356 192 113 53 1113 660 217 3 541 11 90 225 247 45 3 787 654 218 2 604 88 302 1306 493 114 181 2995 635 219 3 710 53 238 457 775 69 877 167 465 220 2 1968 155 2163 1133 2524 524 1081 3656 264 221 2 495 11 94 139 212 68 3 477 522 222 3 538 23 172 285 264 97 216 642 634 223 3 530 11 218 308 258 185 435 326 485 224 3 359 57 162 386 132 69 77 1156 411 225 3 393 15 71 155 135 113 58 372 472 226 2 387 16 132 66 114 79 85 436 545 227 3 409 27 80 186 126 77 226 367 581 228 3 667 41 201 328 272 171 177 836 750 229 3 880 40 140 230 545 81 205 557 666 230 3 666 11 136 210 206 159 21 664 546 231 3 592 15 127 330 181 224 124 626 508 232 2 565 33 75 213 178 40 435 334 745 233 2 1227 82 603 1165 803 257 2903 690 687 234 3 443 11 89 215 161 139 132 433 670 235 3 473 25 43 147 158 35 65 523 668 236 2 1265 74 503 1192 1377 572 1387 602 586 237 3 427 12 74 154 120 48 248 400 207 238 3 403 11 68 109 143 68 68 438 535 239 3 633 62 219 392 330 137 500 600 558 241 3 256 12 33 41 80 12 61 231 514 242 3 215 11 9 22 66 5 71 136 4453560 PACHECO ANO VAN DER WEIJDEN: CONTRIBUTIONS OF WATER-ROCK INTERACTIONS Table 6. ( continued)
Nr T Na+ K+ Mg2 Ca2+ CI so~- NO) HC03 H2Si0]
243 2 1097 109 486 763 890 258 435 1529 776 244 3 656 18 105 254 270 168 250 323 476 245 2 536 29 153 265 316 87 131 692 608 246 3 493 11 99 170 129 76 131 564 519 247 3 593 13 125 269 287 186 167 454 532 248 2 656 24 196 347 198 192 500 526 415 249 3 418 12 83 83 109 85 52 408 560 250 3 711 31 163 124 273 139 324 187 579 251 3 316 16 15 24 95 8 35 203 467 252 3 283 11 12 23 106 3 66 128 414 253 2 356 11 24 31 92 33 61 249 619 254 3 345 16 69 45 l18 37 29 296 600 255 3 383 11 66 47 126 36 66 293 672 256 3 385 11 38 32 132 38 35 236 520 257 3 474 11 72 60 146 50 140 243 613 258 3 184 11 12 14 98 5 66 59 237 259 3 635 29 210 234 267 87 190 723 740 260 3 481 12 102 140 143 31 43 648 760 261 2 1177 93 296 517 947 183 452 675 620 262 2 2312 113 700 1254 3385 375 1516 1048 617 263 2 1846 93 1051 1827 3213 725 1241 1724 740 264 3 549 16 114 252 338 102 250 451 550 265 3 407 11 59 90 155 22 9 567 697 266 2 1123 36 586 1018 1320 892 532 1278 486 267 2 938 46 294 78 574 56 182 1278 739 268 2 740 27 231 377 537 220 282 526 581 269 2 3889 193 663 1794 6886 559 1048 877 567 270 2 1016 55 799 855 1348 338 726 1169 452 271 3 481 18 72 856 218 25 139 449 842 272 3 365 26 85 126 264 6 187 367 573 273 3 359 19 65 144 166 12 4 554 723 274 3 492 11 108 105 310 52 150 470 530 275 3 417 27 89 107 287 13 105 516 662 276 3 547 15 135 223 488 35 176 531 615 277 3 447 49 143 191 367 59 113 606 736 278 3 359 li 54 75 207 18 113 375 760 279 3 690 22 158 212 602 67 118 688 692 280 3 271 43 43 90 155 11 13 434 583 402 3 165 24 25 34 116 7 22 150 211 404 3 266 24 43 105 192 lO 32 308 399 406 3 987 33 127 195 634 75 60 853 692 407 2 1152 67 446 676 757 200 106 2081 757 408 3 430 34 181 76 273 70 112 551 711 410 3 290 27 78 47 109 12 74 272 530 411 2 177 48 122 75 202 46 30 214 209 415 3 465 6 115 42 248 17 8 470 612 420 3 313 15 53 108 213 23 14 390 340 421 3 317 31 70 97 192 22 23 353 339 423 3 241 18 93 29 89 16 29 262 352 424 3 468 26 78 119 236 39 81 365 445 425 3 375 32 115 183 92 10 11 819 812 427 3 354 38 61 101 165 5 30 433 534 430 3 645 29 89 302 245 162 34 725 464 432 3 368 39 43 57 164 9 25 338 689 433 3 327 li 59 64 108 41 24 280 524 434 3 239 31 48 52 80 8 13 292 524 435 3 293 38 39 67 65 5 5 421 581 438 2 454 47 68 57 155 30 30 430 487 439 3 448 55 68 134 130 13 >>O 714 709 440 3 398 36 68 134 129 29 7 636 729 441 3 472 47 129 237 172 33 8 957 875 442 3 680 58 166 283 846 25 75 607 838 443 3 475 45 156 147 384 33 33 549 569 444 3 301 38 95 60 160 13 36 351 442 446 3 488 34 102 171 260 14 33 651 887 447 2 707 72 207 373 542 95 107 974 548 452 3 669 50 198 332 344 176 105 838 774 453 3 607 36 197 253 280 46 17 1124 752 457 3 304 36 62 146 94 1 1 566 568 458 3 330 35 66 148 196 9 22 526 670 463 2 313 37 71 82 245 33 31 231 366 514 2 371 31 96 188 164 66 27 558 497 522 2 442 30 241 294 184 47 32 1150 600
PACHECO ANO VAN DER WEIJDEN: CONTRIBUTIONS OF WATER-ROCK INTERACfiONS 3561 Table 6. ( continued) Nr T Na+ K+ Mg2+ Ca2· C! so~- N0 3 JlCO) H2Si0~ 523 2 600 39 118 282 307 149 34 650 860 524 2 576 63 145 293 252 114 21 919 679 525 2 400 47 86 142 128 69 48 503 554 530 2 669 37 168 316 462 178 62 643 742 534 2 471 36 95 150 281 81 100 310 604 535 2 548 113 245 404 737 143 lOS 625 568 536 2 370 41 99 254 240 55 42 529 431 539 2 566 SI 100 289 697 113 150 600 375 540 2 319 84 124 186 228 23 63 520 806 573 2 177 35 28 29 199 lO 19 96 280 574 3 634 80 223 241 930 95 29 652 515 575 2 596 81 223 224 433 130 30 876 514 583 2 880 166 738 452 2390 134 284 305 415 589 3 302 88 121 146 208 19 24 502 679 591 2 450 134 183 285 419 209 20 572 228
Chemical analyses (in ~-tM) of 160 water samples from the Fundão area. The sample numbers are given in the first eolumn; their loeations are shown in Figure 3. ln the second column (T) the type of sampled water is given: 2, fresh wells; 3, springs.
alies were divided into two groups, one containing the an om-alies in HC03 , and the othcr containing highly polluted sam
-pies (enriched in SO~ and/or Cl and/or N03 ).
Weathering Reactions Considered in the SiB Algorithm
The SiB algorithm was applied to water groups 1 to 10 (Table 7). The weathering reactions uscd in the calculations were the ones from the weathering models already defined for the plutonitc and for the dikes (Tables Sa and Sb ). Thc
as-sumed structural formulas of the primary minerais present in
these rocks and of the secondary minerais formed upon
chem-ical weathering are given in Table 8. The extreme weathering reactions (the ones that form just one weathering product) for
the plutonite and for the amphibolites are listed in Table
9.
The results of the analysis of the water-rock interactions are presented in Table 10.Possible and Best-Fit Solutions of the SiB Algoritbm
No information is availablc about the rela tive abundances of
the secondary minerais in the soils that have developed on the
various rocks in the area. For this reason the SiB algorithm
(Appendix 2) can generate only sets of possible solutions. We
used information about the chemistry of the locally applied
fertilizers to find a best-fit solution among the possible solu -tions. Chloride, sulphate, and nitrate are the major anionic constituents while calcium is a major cationic constituent of these fertilizers. As a best-fit solution among the possible
so-lutions, we selected the one with the most significant Spearman
rank-order correlation coefficient betwecn the sum of these anions (in microequivalents per liter) and Ca (in micr oequiva-lents per liter). For the best-fit solution high correlation coef
-fieients are also expected for Mg (fertilizers) and Na (mainly
domestic etfluents) because these cations are not taken up by
plants as effectively as K. Results of the SiB Algorithm
The best-fit weathering reactions, relating the water chem -istries to the various rocks, are given in the third row of Table
10. For groups 6 and 10 these reaetions are combinations of end-member reactions.
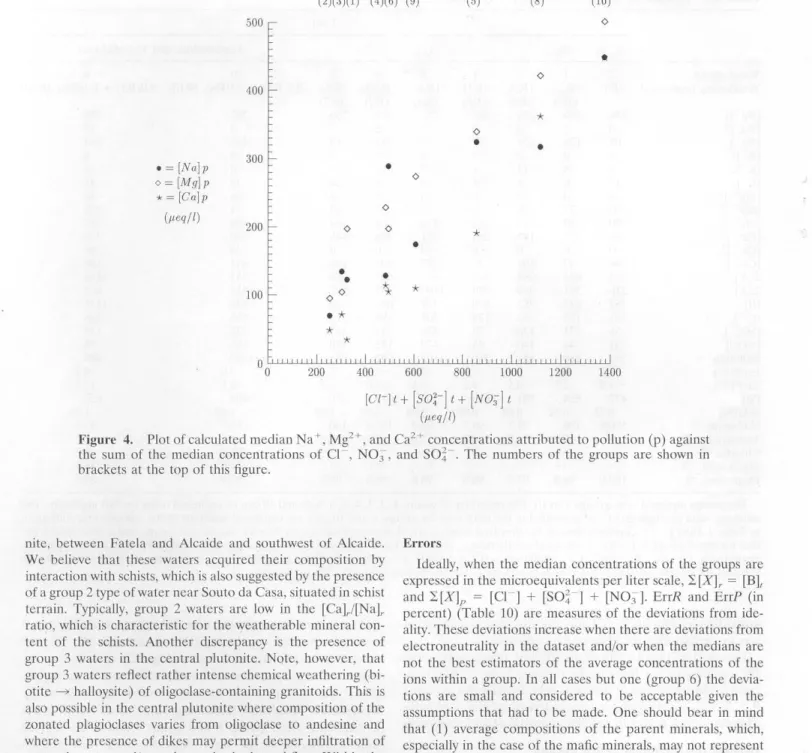
Figure 4 shows thc correlation between the median con cen-trations of Ca2+, Mg2+, and Na+ attributcd to pollution (de -noted by a "p" in Table lO, left-hand column) of groups 1 to 6
and
8
to10
and the sum of the medium concentrations ofC!
-
,
SO~-, and N03 . The corresponding Spearman coefficients are0
.
9
0
,
0
.95,
and0
.
92
for probability leveis of99.991
%,
99.999%,
Table 7. Groups Obtained by the Equivalence-Ciasses Procedure
Designalion I 2 3 4 5 6 7 8 9 10 Anoma1ies (I-IC03 ) Anomalies (pollulanls) Scattered samples Sample Numbers 61, 74, 75, 85, 92, 235, 246, 260, 265, 273, 275, 415, 440, 443, 446, 457, 458, 514, 525, 536, 540, 589 41, 72, 241,242, 251, 252,253, 254, 255,256, 257,402, 404, 410,411,423, 433,434, 463, 573 87, 96, 221,225, 238, 249,280, 420, 421,427,432,435, 438,444 42, 79, 204, 208, 210, 212, 226, 227, 237, 271, 272, 278, 424, 534 35, 203, 228, 230, 231, 259, 430, 452, 523, 530 67, 211, 216, 224, 267, 447, 453, 522 76, 86, 90, 217, 425, 441, 524, 575 31, 32, 66, 223,232,239, 248 39, 60, 222, 245, 276, 277, 408 28, 30, 51, 77, 205 45, 59, 218, 220, 243, 407 63, 78, 202, 213, 219, 233, 236, 262, 263, 266, 269, 270, 583 71, 84, 99, 206, 207, 209, 214, 215, 229, 234, 244, 247, 250, 258, 261, 264, 268, 274, 279, 406, 439, 442, 535, 539, 574, 591 % % 11 gr c um 22 14 14 20 13 27 14 9 36 14 9 45 10 6 51 8 5 56 8 5 61 7 4 65 7 4 69 5 3 72 6 4 76 13 8 84 26 16 100
Here n is number of samples per group; % gr, percentage of samples in each group rela tive to the total number of samples; % cum, cumulative
3562 PACHECO AND VAN DER WEIJDEN: CONTRTBUTIONS OF WATER-ROCK INTERACTIONS
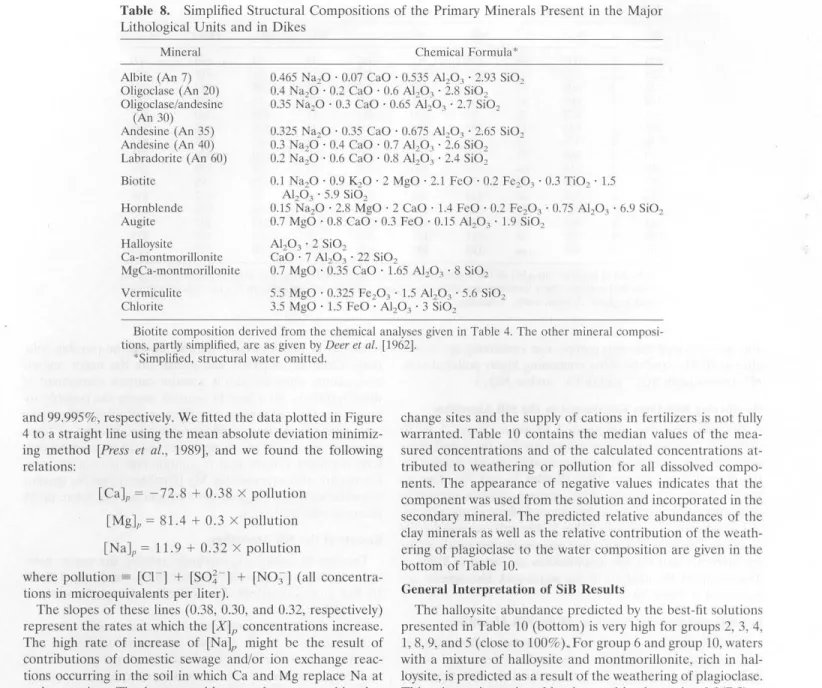
Table 8. Simplified Structural Compositions of the Primary Minerais Present in the Major
Lithological Units and in Dikes Mineral
Albite (An 7) Oligoclase (An 20) Oligoclasc/andesine (An 30) Andesine (An 35) Andesine (An 40) Labradoritc (An 60) Biotite Hornblcnde Augi te Halloysite Ca-montmorillonite MgCa-montmorillonite Vermiculite Chloritc Chemical Formula* 0.465 Na20 · 0.07 CaO · 0.535 Al203 • 2.93 Si02 0.4 Na20 · 0.2 CaO · 0.6 Al203 • 2.8 Si02 0.35 Na20 · 0.3 CaO · 0.65 Al203 • 2.7 Si02 0.325 Na20 · 0.35 CaO · 0.675 Al203 • 2.65 Si02 0.3 Na20 · 0.4 CaO · 0.7 AI203 • 2.6 Si02 0.2 Na20 · 0.6 CaO · 0.8 Al203 • 2.4 Si02 0.1 Na20 · 0.9 K20 · 2 MgO · 2.1 FcO · 0.2 Fc203 • 0.3 Ti02 • 1.5 Al203 • 5.9 Si02
0.15 Na20 · 2.8 MgO · 2 CaO · 1.4 FcO · 0.2 Fc203 · 0.75 Al203 · 6.9 Si02 0.7 MgO · 0.8 CaO · 0.3 FeO · 0.15 Al203 • 1.9 Si02
AI203 • 2 Si02
CaO · 7 AlzÜ3 • 22 Si02
0.7 MgO · 0.35 CaO · 1.65 Al203 • 8 Si02 5.5 MgO · 0.325 Fe203 · 1.5 Al203 · 5.6 Si02 3.5 MgO · 1.5 FeO · Al203 • 3 Si02
Biotite composition dcrived from the chemical analyses given in Table 4. The other mineral composi-tions, partly simplified, are as given by Deer et ai. [1962].
*Simplificd, structural watcr omittcd.
and 99.995%, respectively. We fitted the data plotted in Figure 4 to a straight line using the mean absolute deviation minimiz
-ing method [Press et al., 1989], and we found the following relations:
change sites and the supply of cations in fcrtilizcrs is not fully warrantcd. Table 10 contains the mcdian values of the mea-sured concentrations and of the calculated concentrations
at-tributed to weathering or pollution for all dissolved
compo-nents. The appearance of negative values indicares that the
component was uscd from the solution and incorporated in the
secondary mineral. The predicted relative abundances of the clay minerais as well as the relative contribution of the weath -cring of plagioclase to the water composition are given in the bottom of Table 10.
[Ca]p
=
-72.8+
0.38x
pollution [Mg]p = 81.4+
0.3 X pollution [Na]p = 11.9+
0.32 X pollutionwhere pollution
=
(cn
+
(So~-]+
(NO:J] (ali concentra-tions in microequivalents per liter). General Interpretation of SiB Results
The slopes of these !ines (0.38, 0.30, and 0.32, respectively) represent the rates at which the
[X]P
concentrations incrcasc. The high rate of increase of [Na]p might be the result ofcontributions of domestic sewage and/or ion exchange
reac-tions occurring in the soil in which Ca and Mg replace Na at exchange sitcs. The lattcr would mean that our working hy-pothesis of a steady state between the occupancy of the
ex-The halloysite abundancc predictcd by thc bcst-fit solutions
prescnted in Table 10 (bottom) is very high for groups 2, 3, 4, 1, 8, 9, and 5 ( close to 100% ).For group 6 and group 10, waters with a mixture of halloysite and montmorillonite, rich in
hal-loysite, is predicted as a result of thc wcathcring of plagioclase.
This mixture is produced by the combined reaction 0.9(R5)
+
0.1(R6) (Table 10). ln order to exp)ain the chemistry ofTable 9. Extreme Weathering Reactions for Primary Minerais Given in Table 8 Reaction (Rl) (R2) (R3) (R4) (RS) (R6) (R7) (RS) (R9) (R lO) Mineral albite (An 7) oligoclase (An 20) olig./andesine (An 30) andesine (An 35) andesine (An 40) andesine (An 40)
biotite biotite
hornblcndc hornblendc
*Round-olf coefficients.
Wcathcring Rcaction* 1.87 plagioclase + x H20 + 2 C02 ~ halloysite + 1.74 Na+ + 0.13 Ca
2
+ + 2 HCO:J + 3.48 H2Si0~ 1.67 plagioclasc + x H20 + 2 C02 ~ halloysite + 1.33 Na+ + 0.33 Ca2+ + 2 HCO:J + 2.67 H2Si0~ 1.54 plagioclase
+ x
H20+
2C02 ~ halloysite+
1.08 Na++
0.46 Ca2++
2 HC03+
2.15 H2Si03 1.48 plagioclase + x H20 + 2 C02 ~ halloysite + 0.96 Na+ + 0.52 Ca2+ + 2 IIC03 + 1.93 II2Si03 1.43 plagioclase+ x
H20+
2 C02 ~ halloysitc+
0.86 Na++
0.57 Ca2++
2 HCO:J+
1.71 H2Si0~2.36 plagioclase + x H20
+
1.2 C02+
0.7 Mg 2+
+
1.87 H2Si03 ~ MgCa-montmorillonite+
1.41 Na+ + 0.59 Ca2+ + 1.2 HCO:J0.67 biotite
+
x H20+
4 C02+
0.35 02 ~ halloysite+
0.84 Fe203+
0.2 Ti02+
0.13 Na++
1.2 K++
1.33 Mg2++
4 HCO:J+
1.93 H2Si03
biotite + x H20 + 5 I-ICO:J + 3.5 Mg2+ + 0.53 02 ~ vermiculite + 0.93 Fe203 + 0.3 Ti02 + 0.2 Na+ + 1.8 K+
+
5 C02 + 0.3 I-I2Si0~1.33 hornblende + x I-!20 + 6.2 C02 + 0.29 02 ~ chlorite + 0.77 Fe203 + 0.4 Na+ + 0.23 Mg2+ +
2.67 Ca2+
+
6.2 HCO:J + 6.2 I-I2Si0~2.2 hornblcndc +X HzO + 19.68
co2
+ 0.77 Üz ~ MgCa-montmorillonite + 1.98 Fe203 + 0.66 Na+PACHECO ANO VAN DER WEIJDEN: CONTRIBUTIONS OF WATER-ROCK INTERACTJONS 3563
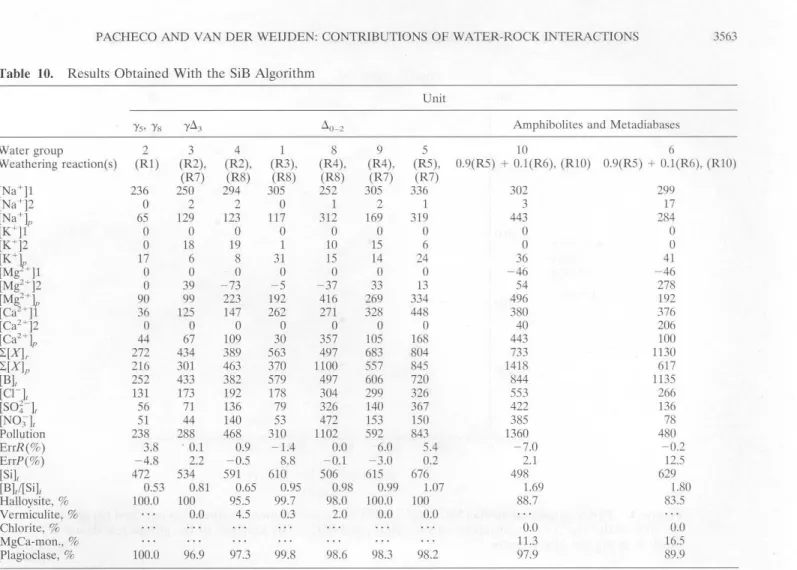
Table 10. Results Obtained With the SiB Algorithm
Unit
'Ys· 'Ys 'Yll3 llo_z Amphibolites and Metadiabases
Water group 2 3 4 1 8 9 5 10 6
Weathering reaction(s) (R1) (R2), (R2), (R3), (R4), (R4), (RS), 0.9(R5) + O.l(R6), (RIO) 0.9(R5) + 0.1(R6), (RIO)
(R7) (R8) (R8) (R8) (R7) (R7) [Na+J1 236 250 294 305 252 305 336 302 299 [Na')2
o
2 2o
1 2 1 3 17 [Na+)" 65 129 123 117 312 169 319 443 284 [K+)1o
o
o
o
o
o
o
o
o
[K+]2o
18 19 1 10 15 6o
o
[K+k 17 6 8 31 15 14 24 36 41 [Mg +)1o
o
o
o
o
o
o
-46 -46 [Mg2+)2o
39 -73 - 5 - 37 33 13 54 278 [Mg2+)" 90 99 223 192 416 269 334 496 192 [Ca2+)1 36 125 147 262 271 328 448 380 376 [Ca2+)2o
o
o
o
o
o
o
40 206 [Ca2+)" 44 67 109 30 357 105 168 443 100 '2:[XJr 272 434 389 563 497 683 804 733 1130 '2:[X)" 216 301 463 370 1100 557 845 1418 617 [B]1 252 433 382 579 497 606 720 844 1135 [Cq 131 173 192 178 304 299 326 553 266 rso~-J~ 56 71 136 79 326 140 367 422 136 [N0))1 51 44 140 53 472 153 150 385 78 Pollution 238 288 468 310 1102 592 843 1360 480 ErrR(%) 3.8 . 0.1 0.9 -1.4 0.0 6.0 5.4 -7.0 -0.2 ErrP(%) -4.8 2.2 -0.5 8.8 -0.1 -3.0 0.2 2.1 12.5 [Silt 472 534 591 610 506 615 676 498 629 [BV[Si)1 0.53 0.81 0.65 0.95 0.98 0.99 1.07 1.69 1.80 Halloysite, % 100.0 100 95.5 99.7 98.0 100.0 100 88.7 83.5 Vermiculite, % 0.0 4.5 0.3 2.0 0.0 0.0 Chlorite,% 0.0 0.0 MgCa-mon., % 11.3 16.5 Plagioclase, % 100.0 96.9 97.3 99.8 98.6 98.3 98.2 97.9 89.9The groups analyzed were groups 1 to 10. The chemistry of groups 1, 2, 3, 4, 5, 6, 8, 9, and 10 can be explained using the SiB algorithm. Thc
reactions valid for each group are presenteei in thc third row; for groups 6 and 10 thcy are combined reactions of the extreme reactions given
in Table 9. Here [ ) = concentrations of the dissolved components in microequivalents per li ter for cations and anions, and in micromoles per
li ter for dissolved silica; t, total; r, chemical wcathcring; p, pollution; 1 and 2, dcrivcd from wcathcring of the first and second primary mineral,
respectively;X =Na+, K+, Mg2+, Ca2+. Pollution = [Cl-]1 + [S0~-]1 + [N03
t
.
ErrR(%) and ErrP(%) are thc relativc deviations in thc chargcbalances for bicarbonate (ErrR) anel pollution (ErrP) calculatcel using (29) anel (30), in Appcndix 2.
groundwaters, Garrels [1967] also suggests that plagioclasc
al-ters to similar mixtures of secondary minerais.
Garrels [1967] used a plot of the [BV[Si]1 (mole ratio) versus
[8
]
1 (milligrams per liter) to discriminatc bctwccn watcrsrc-lated to differcnt types of igneous rocks. ln such plot groups I,
2, 3, 4, S, S, and 9 are indeed characteristic of granitoid rocks,
whereas groups 6 and 10 are characteristic of andesitic rocks.
Detailed lnterpretation of SiB Results
ln the following discussion we refer to the petrological
in-formation given in Figures 2a and 2b. On the basis of their
chemical compositions (Tablc 1) we calculated An = 3 for lhe
plagioclase in the y5 granite and An
=
7 for the y8 granite. Thecomposition of group 2 waters can be Jargely explained by
chemical weathering of plagioclasc (Rl) in these rocks. Group
3 waters obtained their composition by a combination of
weathering of plagioclase (R2) and biotite (R7) to halloysite.
According to Costa et al. [1971] the plagioclases in the 6.0_ 2
granitoids are strongly zonated (An 1S to An 37). On thc basis
of the CIPW results (Table 3) the average anorthite contents
indicate a spatial range from An S to An 4S in plagioclases in the 6.0_ 2 units. These changes in the chemical composition of plagioclases are reflected in the chemistries of groups 4, 1, S, 9,
and S. Group 4 waters are related to chcmical weathering (R2)
of oligoclase (An 20), group 1 watcrs to chemical weathering
(R3) of oligoclasc/andesine (An 30), group S and group 9
waters to chemical weathering (R4) of andesine (An 3S), and
group S watcrs to chemical weathering (RS) of andesine (An
40). For thc groups related to rocks wilh more sodic plagio
-clasc typcs (groups 1 and 4) biotite weathering leads to the
formation of vcrmiculite (RS); for groups 9 and S biotite alters
to haUoysite (R7). Group S and group 9 waters are derived
from weathering of the sarne plagioclase type, but group S
waters are obviously more polluted, probably resulting in the
production of vermiculite. Group 6 and group 10 waters,
al-though collected in the central area, cannot bc explained by a
combination of the reactions (R2)-(R4) and (R7) and (RS).
Instead, the chemistries of these groups can be explained by
weathering of andesine (RS)
+
(R6) and of hornblende (R 10).This means that thcsc chemistries are related to the weathering
of basic rocks present as dikes in the central area.
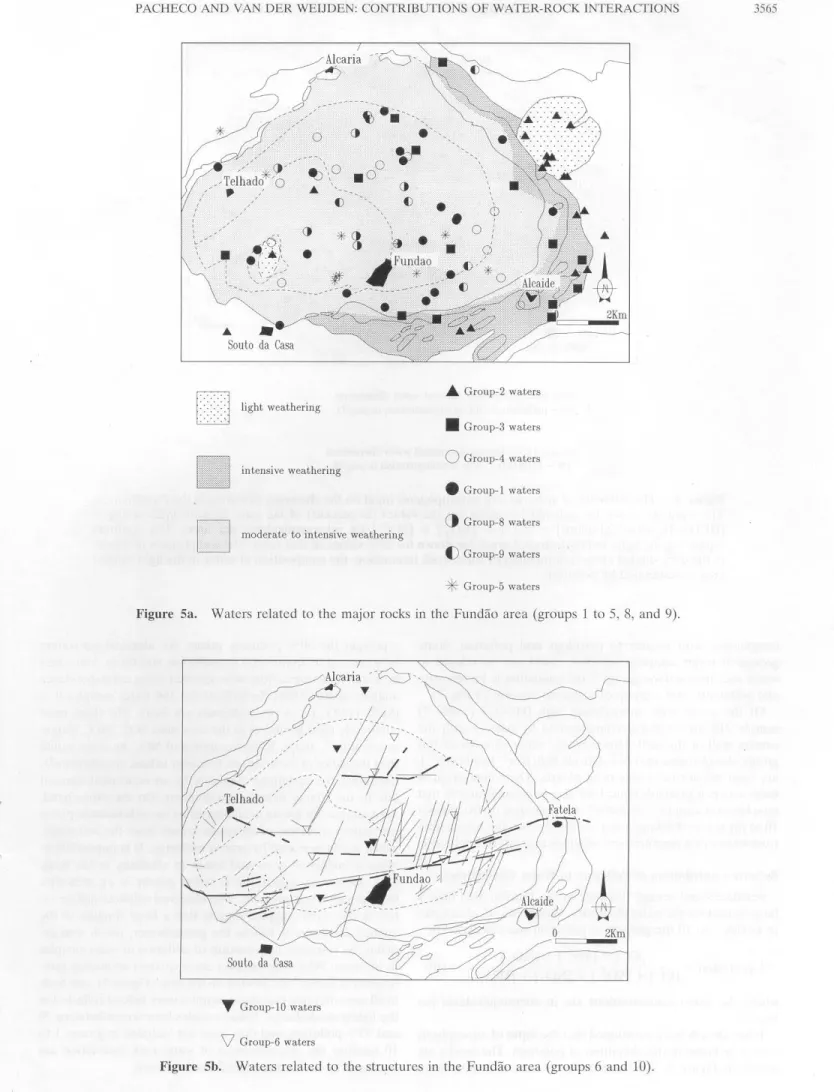
Areal Distribution of the Groups
The areal distribution of the waters of groups 2, 3, 4, 1, S, 9,
and S is shown in Figure Sa. The distribution coincides rathcr
well with the different petrological units ( cf. Figures 2a and 2b ). This is additional confirmation of the validity of the re
-sults. However, there secm to be some discrepancies. The
pluto-3564 PACHECO AND VAN DER WEIJDEN: CONTRIBUTIONS OF WATER-ROCK INTERACTIONS (2)(3)(1) (4)(6) (9) (5) (8) (lO) 400 <>
•
•
=
[Na]p 300•
<>= [Mg]p <>*=
[Ca]p <> (fteqI
I) <> <>*
•
•
•
•
<><>\
*
•
*
* *
[ci-Jt
+
[so~-] t+[No;-]
t(~teq
I
I)Figure 4. Plot of calculated median Na+, Mg2+, and Ca2+ concentrations attributed to pollution (p) again.st the sum of the median concentrations of C! , N03 , and SO~ . The numbers of the groups are shown 111
brackets at the top of this figure.
nite, between Fatela and Alcaide and southwest of Alcaide.
We believe that these waters acquired their composition by
interaction with schists, which is also suggestecl by the presence
of a group 2 type ofwater near Souto ela Casa, situa teci in schist
terrain. Typically, group 2 watcrs are low in thc (Calrf(Na]r
ratio, which is characteristic for the weatherable mineral co
n-tent of the schists. Another discrepancy is the presence of
group 3 waters in the central plutonite. Note, however, that
group 3 waters reflect rather intensc chcmical weathering (bi
-otite ~ halloysite) of oligoclase-containing granitoids. This is
also possible in the central plutonite where composition of the
zonatcd plagioclascs varies from oligoclasc to anclesinc anel
where the presence of dikes may permit deeper infiltration of
meteoric water and/or a change in the lateral flow. Within the
central arca it is not possible to recognize any specific area for
groups 4, 1, 8, 9, and 5. This is consistent with the variability of
the anorthite content of zonated plagioclase crystals.
The areal distribution of waters in groups 6 and 10 is shown
in Figure 5b. It would be too optimistic to expect all sample
locations to coincide cxactly with the dikes shown on this map,
but the figure does support a spatial relation between these
waters and the dikes.
It is remarkable that we apparently could explain the water
chemistrics without taking into account lateral transpor! of
groundwatcr. Onc would expcct thc composition of water that
moves laterally from one petrological unit to another to retain
anel not to Jose its inherited signature. It seems, however, that
the overprint of the water-rock interactions in the new petr
o-logical environmcnt is sufficiently strong to determine the wa -ter composition.
Errors
Ideally, when the median concentrations of the groups are
expressecl in the microequivalents per liter scale, 2:-[X
]
r
=
(Bltanel
2:-[X
)p
=
(C! ]+
[SO~ ]+
[N03 ]. ErrR anel ErrP (inpcrccnt) (Table 10) are measures of the dcviations from
ide-ality. These deviations increase when there are deviations from electroneutrality in the dataset and/or when the medians are
not thc bcst cstimators of the average conccntrations of the
ions within a group. In ali cases but one (group 6) the devia
-tions are small and considered to be acceptable given the
assumptions that hacl to be macle. One shoulcl bear in minei
that (1) avcragc compositions of thc parent minerais, which,
especially in the case of the mafic minerais, may not represent
the true compositions of the minerais actually being wea
th-ered, anel that (2) compositions of the weathering products
may not exactly represent the compositions of the minerais
actually bcing formcd; this holds espccially for the smectitcs, for there is a Jack of data on their abundance in the area anel
their composition.
Our case is basically not different from any othcr weathering
study: thc more one knows about abundances and composi
-tions of primary anel secondary minerais, the better one can
model the water-rock interactions. ln our case the extra co
m-plicating factor is the relatively high contribution made by
other sources, together called "pollution," which causes a poor
signal-to-noise ratio.
Anomalous Samples
ln the foregoing we showecl that we could clistinguish the
PACHECO AND VAN DER WEIJDEN: CONTRIBUTIONS OF WATER-ROCK INTERACTIONS 3565 ~-A~
o
v
4b
\?
.
o
()•
() ', ' () l<<l light weathering..À. Group-2 waters
• Group-3 waters
Ü
Group-4 waters intensive weathering• Group-1 waters
D
moderate to intensive weathering(t
Group-8 waters ( ) Group-9 waters*
Group-5 watersFigure Sa. Watcrs rclatcd to thc major rocks in thc Fundão area (groups 1 to 5, 8, and 9).
T
Group-10 watersV
Group-6 waters3566 PACIIECO ANO VAN DER WEIJDE : CO TRTBUTTONS OF WATER-ROCK INTERACfiONS
D
D
areas with pollution-dominated water chemistries (%-po/lution >50% of concentration in jJeqfl) areas with weathering-dominated water chemistries
(%-pollution <50% of concentration in J-leq/1)
Figure 6. Thc inOuence of airbornc and anthropogcnic input on the chemistry of waters in the Fundão arca. Thc numbcrs shown for individual samplcs are thc values (in pcrcent) of the ratio L[anions]/(L[anions]
+
[HC03 ]), whcrc L[anions] = fCI J
+
[N03]+
[SO~ J (in microequivalents per liter). The contoursseparating the light and dark shadcd arcas are drawn for 50% values of that ratio. Thc composition of waters
in the dark shadcd areas is dominatcd by water-rock interacrion, the composition of water in the light shaded
area is dominated by pollution.
complicated with rcspcct to petrology and pollution. Some
groups of watcr samplcs, howcver, could not be related to
water-rock interactions: group 7, thc anomalics in bicarbonate
and pollutants, and a group of scattered samplcs (Tablc 7). Of the group with anomalously high [HC03 ] (Table 7)
sample 218 was probably contaminatcd by contact with the ccmcnt wall of the wcll. However, the othcr samplcs of this group, also charactcrizcd by relatively high fCa2
+
1
and [Mg2+],are from the northcrn arca ncar AJcaria. Thc composition of these waters is probably typical for dccpcr groundwater in that
arca because samplcs 220 and 407 werc pumpcd up from about
10m for use as drinking water. ln these cases thc nonequilib-rium weathering rcactions and relations may not be applicable. Relative Contribution of Pollution to Water Chemistries
Fertilizcrs and scwagc drainage in the Fundão arca have a
largc impact on the watcr chemistry. Within thc sct of samples
in groups 1 to lO thc pcrcent of pollution was calculated by
. fCI ]
+
[SO~1
+
[N03]% pollutlOn
=
[CI1
+
fSOi1
+
[N03)+ [H
C03]x
100where thc anion concentrations are in microequivalents per
li ter.
It has already bccn mcntioncd that the input of atmospheric
salts is included in this dctinition of pollution. The results are
shown in Figure 6. Contours between light and dark areas
rcprcsent the 50% pollution values. An identical scparation
betwecn waters dominatcd by pollution and those dominated by watcr-rock interactions was obtained using correspondcnce
analysis
[Da
vis,
1986).ln
83% of the 160 water samples O<
(SO~ )/(NO))
<
4 (in milligrams per liter). The three most commonly uscd fertilizers in the area have SO~ /N03 weight ratios of O, 3, and 4. Selective uptake of N03 by crops wouldshift the ratios of these anions to highcr values, simultaneously incrcasing the carbonate alkalinity by an equivalcnt amount
duc to the charge balance requircment. On thc other hand,
harvcsting crops has an acidifying effect on soils bccause plants
use cations in excess of inorganic anions from thc soil water,
which is compensated by proton exchange. It is impossible to
makc a budget of gains and losses in alkalinity in thc study
arca. Moreover, agriculture is rather patchy in an area with
large uncultivated portions. Thc observed sulphate/nitrate ra-tios in the water samplcs suggest that a large fraction of the
applicd fcrtilizers is lost to the groundwater, which also
cx-plains the relatively high percent of pollution in water samples
in thc area. When the samples designated as anomalies (pol-lutants) in Table 7 are plotted on the map (Figure 6), one finds
in ali cases but onc that these samples were indeed collected in
the lightly shaded area. These samples have scores between 70
and 93% pollution, and thcy were not included in groups I to
I O bccausc the characteristics of water-rock interaction are swamped by the anthropogcnic contributions.
PACHECO AND VAN DER WEIJDEN: CONTRIBUTIONS OF WATER-ROCK INTERACTIONS 3567
Scattered Samples
No attempt has been made to clarify the chemistry of the
remaining groups of samples. This would have to be done on a
sample-by-sample basis and would require more detailed i
n-formation about the hydrology than is currently available. Given the purpose of this study, the results are satisfying, since
they explain the water chemistries in this complicated area in the great majority of cases.
Conclusions
The RST algorithm that was developed to distinguish groups
of water samples with similar chemical characteristics is very effective. The application of the SiB algorithm to relate water
compositions of the identified groups to weathering reactions
likely to occur in the Fundão area produced promising and
mostly convincing results. With the help of this SiB methodol -ogy we were able to relate water types with various granitic
units in the area and also to basic dikes. This is a remarkable
result for an area where anthropogenic contributions to the
water chemistry are relatively very high. It should bc possible to improve the results when more detailed knowledge is co
l-lected about the composition of the primary minerais in the
various petrological units, about the abundance and composi
-tion of the secondary minerais formed by chemical weathering, and about the field relations between dikes and sites where
samples of spring and well waters were collected.
Appendix
1: RST Algorithm
The initial raw data consist of a matrix M Np' where N is the
total number of water samples and p the total number of
numerical variables in each water sample. The p variables used
in the present case are Na+, K+, Mg2+, Ca2+, HC03, Cl-, so~-, and N03 .
Stepwise Description of the Algorithm
The RST algorithm comprises three main consccutive steps. Step I. The relation between two samples i and j is dete
r-mined by a measure of similarity,
S;
1, defined byS;i = 1/(1
+
d;) (1)where
d;1 euclidian distance between two points, equal to
[2:~
'
wk(M;k - MJk)2]if2;M;k, M1k values for the variablc k in samples i andj;
p number of variables; wk weight factor of variable k.
Step 2. ln this step the S;/s of each water sample are separated into S iJ
=
I for the related samples and S iJ=
O for the unrelated samples. We adopted the following terminologyused in signal processing theory: raw signal, the N - 1 S;/s of each sample sorted in ascending order; noise, a function that describes the values of the S;/S for the unrelated samples; true signal, the X S;/S that will be set to sij = 1 (the relevant
relations); and filter, the method by which the true signals are separated from the noise. The filtering method consists of the substeps 2.1 to 2.3.
2.1: The N - 1 relations are ranked in ascending order of
their similarity to i, and this row forms the raw signal of sample
i. The sample j in position
m
on the raw signal is identified as samp, (j = samp, ).2.2: The first half of the population (lowest relations) is
used to define a noise function:
noise, = raw signal, if
m
s
N/2(2a)
otherwise
noise,
=
raw signaiN-m m=
1 , 2, 3, · · · , N - 1 ( 2b) It is assumed that at least half of the lowest S i/s of each samplemay not be transformed into relevant relations. By this method
no group may h ave more than N
/
2
elements.2.3: Now a binary square matrix, the relevant matrix
RNxN, can be defined that represents the relevant relations of
the samples. The line i of the matrix R (the true signal of
sample
i)
is constructed by setting RiJ=
1 for a rclevantrelation between i and j, and RiJ
=
O otherwise. Forcompu-tation of the RiJ's the following filter was defined:
_ . { raw signal, - noise,}
R;i - nearest mteger .
1
raw stgna,
(3
)
where m = 1, 2, 3, · · ·, N - 1 and j = sampm.
Step 3. The previous steps do not guarantee the symmetry
and transitivity of the relevant relations. The method of selec
-tion of the equivalent (symmetric and transitive) relations
among the relevant relations identified in the foregoing step is
described in the consecutive substeps 3.1 to 3.9.
3.1: The symmetric relations are identified and saved in the elements above the main diagonal of R:
(4)
where i
=
1 , · · · , N - 1 and j=
i+
1 , · · · , N.3.2: The transitive relations are identified. At the start of
the transitivity test ali samples have a status R;; = 1 (u
n-grouped). This status changes to R;; = O when sample i is
included in one group. Only the first element of each group remains with its status unaltered.
3.3: To begin a group one looks for a sample i with Ri;
=
I.
3.4: For this sample i one considers the elements j (j =
i
+
1, · · · , N) with RiJ = 1.3.5: For each sample j the value of
R
11 is tested to checkwhether j h as already been included in another group. If R11 =
O
(which means that sample j already belongs to anothergroup ), we assign RiJ =
O
to guarantee that sample j will notbe grouped with sample i; otherwise sample j is grouped with
sample i; RiJ maintains the value 1 and R11 is set to
O.
Testing the remaining samples k, one continues to preserve the tran -sitivity between samples i, j, and k by(5)
where k = j
+
1, · · ·, N.3.6: ln case not ali samples j with RiJ = 1 are tested, the
procedure starts again at step 3.4.
3.7: The group initiated in step 3.3 is now complete. Ali
samples j of row i with RiJ = 1 belong to it, and they h ave R11
=
O, whereas R;;=
1.3.8: This procedure must be completed for ali samples i which kept R;; = 1. Subsequently, another group is initiated,
starting with step 3.3, and run until i = N.
3.9: The elements of each group are listed. The total num-ber of rows i with