MARGHERITA FRANCESCATTO
DISSECTING HUMAN CNS GENE EXPRESSION
Tese de Candidatura ao grau de Doutor em Biologia Básica e Aplicada do ICBAS submetida ao Instituto de Ciências Biomédicas Abel Salazar da Universidade do Porto.
Orientador – Peter Heutink Categoria – Professor
Afiliação – Deutsches Zentrum für Neurodegenerative Erkrankungen
Coorientador – Alexandre do Carmo Categoria – Professor
Afiliação – Instituto de Ciências Biomédicas Abel Salazar da Universidade do Porto.
“If our brains were simple enough for us to understand them, we’d be so simple that we couldn’t.” – Ian Stewart
Table of Contents
Summary...7
Resumo...9
List of publications...11
Abbreviations and symbols used in the thesis...13
Chapter 1: General introduction...15
1.1 Introduction: regional vulnerability in neurodegenerative diseases...17
1.2 The Human Genome Project: putting the basis for genome-wide expression profiling...22
1.3 Understanding transcriptional regulation: ENCODE and FANTOM...23
1.3.1 ENCODE: ENCyclopedia Of DNA Elements...24
1.3.2 FANTOM: Functional ANnoTation Of Mammals...27
1.4 Outlook and thesis aims...30
1.5 Thesis outline...31
Chapter 2: Regional differences in gene expression and promoter usage in aged human brains...33
Chapter 3: A promoter level mammalian expression atlas...47
Chapter 4: A high resolution spatial promoterome of the human brain...59
Chapter 5: Brain-specific noncoding RNAs are likely to originate in repeats and may play a role in up-regulating genes in cis...95
Chapter 6: General discussion...117
6.1 Results summary...119 6.2 Discussion...121 6.3 Limitations...126 6.4 Future directions...128 6.5 Conclusions...130 Acknowledgments...131 References...135 5
Summary
The central nervous system is the most complex organ of the human body, composed of numerous anatomical regions characterized by different cellular compositions and functions, and interconnected by complex communication networks. One of the most tragic conditions of this organ is given by neurodegenerative diseases, that affect millions of people worldwide and are an increasing burden for the modern society as the population ages. One of the most striking characteristics of most neurodegenerative diseases is that degeneration seems to affect specific regions and/or cellular populations of the central nervous system. Although theories exist, the mechanisms underlying this regional vulnerability remain largely unknown. It is likely that transcriptional networks active in specific areas of the brain or transcripts expressed in a region-specific way are involved in the process. A crucial step to verify this is to establish solid knowledge on the transcriptional features characteristic of the aged central nervous system and its districts. The general aim of this thesis was to gain insight into the dynamics of transcription in the aged central nervous system and specifically create a high resolution expression profile atlas of distinct brain regions from aged donors, to be eventually compared with material derived from patients affected by neurodegenerative diseases. In Chapter 2, we present a pilot study where we profile transcription in 5 anatomical regions of the central nervous system. In Chapter 3, as part of the FANTOM5 consortium, we participate in the creation of a large expression atlas encompassing a broad array of human and mouse primary cells, cell lines and tissues. In Chapter 4, we focus on the 15 central nervous system regions included in the FANTOM5 tissue collection, representing an expansion of the pilot presented in Chapter 2. In Chapter 5 we use a previously published custom microarray non-coding RNA expression dataset generated from twelve human tissues to identify brain-specific non-coding RNAs and investigate their characteristics. Overall, we provide evidence of specific transcriptional features that characterize the human central nervous system and identify large arrays of poorly characterized transcripts that are expressed in specific regions and might be involved in regional vulnerability in neurodegenerative diseases.
Resumo
O sistema nervoso central é o órgão mais complexo do corpo humano, composto por várias regiões anatómicas caracterizadas por diferentes composições celulares e funções, e interligadas por redes de comunicação complexas. Uma das condições mais trágicas do sistema nervoso central é dada pelas doenças neurodegenerativas, que afetam milhões de pessoas em todo o mundo e são um fardo crescente para a sociedade moderna, por causa do envelhecimento da população. Uma das características mais marcantes da maioria das doenças neurodegenerativas é que a degeneração parece atacar regiões e/ou populações celulares específicas do sistema nervoso central. Embora haja teorias, os mecanismos subjacentes a esta vulnerabilidade local são mal compreendidos. É provável que redes de transcrição ou transcritos ativos em áreas específicas do cérebro estejam envolvidos nesta vulnerabilidade e perda neuronal localizada. Um passo decisivo para testar esta hipótese é estabelecer uma sólida compreensão das características de transcrição que são típicas do sistema nervoso central idoso e das suas partes. O objetivo geral deste trabalho foi o de obter conhecimento detalhado sobre a dinâmica de transcrição no sistema nervoso central idoso e, em particular, criar um mapa de alta resolução da expressão gênica em diferentes regiões anatómicas do sistema nervoso central, a ser comparado com dados de dadores que sofrem de doenças neurodegenerativas. No Capítulo 2, apresentamos um estudo piloto em que analisamos a expressão gênica em 5 regiões do sistema nervoso central. No Capítulo 3, como parte do consórcio FANTOM5, participamos na criação de um grande atlas da expressão gênica que inclui dados provenientes de uma variedade exaustiva de linhas celulares e tecidos humanos e murinos. No Capítulo 4, concentramo-nos nas 15 regiões do sistema nervoso central disponíveis no contexto do consórcio FANTOM5, que representam uma expansão do estudo piloto apresentado no Capítulo 2. No Capítulo 5, usamos dados publicados anteriormente sobre a expressão de RNA não-codificante em doze tecidos humanos para identificar RNAs não-codificantes específicos do cérebro e investigar as suas características. No geral, nós fornecemos evidência de características de
transcrição específicas que caracterizam o sistema nervoso central humano e identificamos grandes matrizes de transcritos mal caracterizados que são expressos em regiões específicas e podem estar envolvidos na vulnerabilidade regional em doenças neurodegenerativas.
List of publications
Pardo LM*, Rizzu P*, Francescatto M, Vitezic M, Leday GG, Simón-Sánchez J, Khamis A, Takahashi H, van de Berg WD, Medvedeva YA, van de Wiel MA, Daub CO, Carninci P, Heutink P. 2013. Regional differences in gene expression and
promoter usage in aged human brains. Neurobiol. Aging 34(7):1825-36.
Forrest ARR, Kawaji H, Rehli M, Baillie K, de Hoon MJL, Haberle V, Lassmann T, Kulakovskiy IV, Lizio M, Itoh M, Andersson R, Mungall CJ, Meehan TF, Schmeier S, Bertin N, Jørgensen M, Dimont E, Arner E, Schmidl C, Schaefer U, Medvedeva YA, Plessy C, Vitezic M, Severin J, Semple CA, Ishizu Y, Young RS, Francescatto M, et al. 2014. A promoter level mammalian expression atlas. Nature 507:462– 470.
Francescatto M*, Vitezic M*, Rizzu P, Simón-Sánchez J, Andersson R, Kawaji H, Itoh M, Kondo N, Lassmann T, Kawai J, Suzuki H, Hayashizaki Y, Daub CO, Sandelin A, de Hoon MJL, Carninci P, Forrest ARR, Heutink P and the FANTOM consortium. 2014. A high resolution spatial promoterome of the human brain. In preparation.
Francescatto M, Vitezic M, Heutink P and Saxena A. 2014. Brain-specific
noncoding RNAs are likely to originate in repeats and may play a role in up-regulating genes in cis. Accepted in in Int. J. Biochem. Cell. Biol.
Vavoulis D, Francescatto M, Heutink P and Gough J. 2014. DGEclust: differential
expression analysis of clustered count data. Under review in Genome Biol.
* These authors contributed equally.
Abbreviations and symbols used in the thesis
3D = three dimensional
3C = chromosome conformation capture
5C = chromosome conformation capture carbon copy AD = Alzheimer's Disease
ALS = amyotrophic lateral sclerosis
APP = amyloid-beta precursor protein, gene bp = base pair
CAGE = cap analysis of gene expression cDNA = complementary DNA
CGI = CpG Island
ChIA-PET = chromatin interaction analysis with paired-end-tag sequencing ChIP = chromatin immunoprecipitation
CNS = central nervous system DNA = deoxyribonucleic acid
ENCODE: encyclopedia of DNA elements
FAIRE = formaldehyde assisted isolation of regulatory elements FANTOM = functional annotation of mammals
FTD = frontotemporal dementia FUS = fused in sarcoma, gene GABA = gamma-Aminobutyric acid GO = Gene Ontology
GWAS = genome-wide association study
H3K4me1 = monomethylated histone H3 lysine 4, histone modification H3K27ac = acetylated histone 3 lysine 27, histone modification
H3K9ac = acetylated histone 3 lysine 9, histone modification HD = Huntington's Disease
HGP = human genome project HTT = huntingtin, gene
lncRNA = long non-coding RNA
MAPT = microtubule-associated protein tau, gene Mb = megabase
ncRNA = non-coding RNA PD = Parkinson's Disease RIN = RNA integrity number RNA = ribonucleic acid
SNCA = alpha-synuclein, gene
SNP = single nucleotide polymorphism SOD1 = superoxide dismutase 1, gene
TARDBP = TAR DNA Binding Protein, gene, also known as TDP-43 TF = transcription factor
TSS = transcription start site
Chapter 1
General introduction
1.1 Introduction: regional vulnerability in neurodegenerative
diseases
Neurodegenerative diseases represent a large group of hereditary and sporadic neurological disorders with heterogeneous clinical and pathological manifestations, characterized by advancing central nervous system (CNS) dysfunction associated to the progressive decay and eventually death of neurons (Przedborski et al. 2003). They include diseases such as Alzheimer's Disease (AD), Frontotemporal Dementia (FTD) and other dementias, Parkinson's Disease (PD), Amyotrophic Lateral Sclerosis (ALS) and Huntington's Disease (HD). Although heterogeneous in their clinical presentation, age of onset, duration and progression, certain pathways and biological processes appear to be consistently altered. Studies in animal models and patient post-mortem material provide strong evidence of increased oxidative stress and impaired mitochondrial function (Lin and Beal 2006; Johri and Beal 2012), axonal transport defects (Millecamps and Julien 2013), defects in the autophagy (Nixon 2013) and mitophagy (Palikaras and Tavernarakis 2012; Ashrafi and Schwarz 2013) pathways, endomplasmic reticulum stress and unfolded protein response (Matus et al. 2011; Hetz and Mollereau 2014). It is also well accepted that CNS inflammation has a role in the progression of neurodegenerative diseases and although it may not typically represent an initiating factor, there is emerging evidence that sustained inflammatory responses involving microglia and astrocytes contribute to disease progression (Glass et al. 2010; Cunningham 2013). Finally the recent discovery that mutations in the RNA-binding proteins TARDBP and FUS are causal for up to 8% of the familiar cases of ALS (Lagier-Tourenne 2010) suggests that improper RNA processing might be involved in the pathogenesis and progression of at least certain neurodegenerative diseases, such as ALS and FTD. This hypothesis is further supported by the observation that a pathological feature of ALS and FTD patients carrying the c9orf72 repeat expansion mutation show sequestration of RNA binding proteins in RNA foci present in the nucleus or cytoplasm of cells (Lagier-Tourenne et al. 2013).
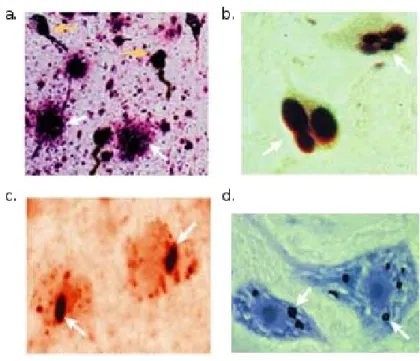
Figure 1. Examples of protein aggregates identified in distinct neurodegenerative diseases.
Amyloid plaques (white arrows) and neurofibrillary tangles (yellow arrows) are typically found in post-mortem brain material of AD patients (a). PD and ALS are generally characterized by cytoplasmic aggregates (b. and d.) while in HD intranuclear aggregates are found. Adapted from (Soto 2003).
Even though the clinical manifestation of all these diseases is diverse, at the molecular level they often share the phenomenon of accumulation of abnormally folded proteins in the form of small oligomers, aggregates or large-protein inclusions. The accumulation of distinct protein-based macroscopic deposits is therefore a hallmark of neurodegenerative diseases and the composition and distribution of the deposits is a defining property of each of them (Figure 1). For example AD is characterized by extracellular amyloid plaques and intracellular neurofibrillary tangles (Gamblin et al. 2003); PD by characteristic intraneuronal cytoplasmic inclusions – termed Lewy Bodies – composed of several proteins (Dauer and Przedborski 2002); distinct subtypes of FTD by tau- or ubiquitin- positive deposits in neurons and glia (Bigio 2013); HD by intracellular aggregates called inclusion bodies (IBs). Some of the mutations associated with familial cases of these diseases affect the major protein components of the deposits: e.g. the 18
identification of mutations in the alpha-synuclein gene (SNCA) in familiar forms of PD (Polymeropoulos et al. 1997) eventually led to the discovery of SNCA as principal component of Lewy bodies. Analogously the beta-amyloid precursor protein (APP), first causal gene identified for AD (Goate et al. 1991), is a major component of amyloid plaques characteristic of AD (Glenner and Wong 1984). Additionally FTD familial cases associated to MAPT mutations show neuronal and glial deposits staining positive for MAPT (Hutton et al. 1998) while in familial forms of ALS associated with FUS mutations abnormal cytoplasmic glial and neuronal inclusions staining positive for FUS were observed (Lagier-Tourenne et al. 2010). Finally the IBs that characterize HD stain positive for mutant huntingtin (HTT) and ubiquitin (Arrasate and Finkbeiner 2012). In light of these and similar observations, neurodegenerative diseases are currently viewed as cerebral proteopathies, in which the accumulation of particular proteins is a key causative factor (Haass and Selkoe 2007). Another common feature of most neurodegenerative diseases is that deposit formation, pathology and eventually neuronal loss is restricted to a limited number of brain regions or subsets of neurons (Saxena and Caroni 2011; Jackson 2014) (Figure 2). In AD initial symptoms are related to prominent memory impairment and this correlates to focused neurodegeneration in hippocampus and parahippocampal gyrus (Hyman 1984). PD predominantly manifests clinically as a movement disorder and is associated to the initial degeneration and loss of dopaminergic neurons in the substantia nigra (Sulzer and Surmeier 2013). HD manifests as well as a movement disorder, however neuronal loss is initially restricted to the GABAergic neurons of striatum (Ross and Tabrizi 2011). ALS is characterized by the selective and progressive loss of upper and lower motor neurons of the brainstem, spinal cord and cerebral cortex (Robberecht and Philips 2013). The mechanisms underlying this selective vulnerability remain largely unknown: one immediate explanation would be that the genes specifically involved in protein aggregation in distinct neurodegenerative diseases are expressed at higher levels in the areas that are affected the most. However, this hypothesis is easily challenged by the observation that e.g. APP, HTT, SNCA and FUS have essentially similar levels of expression in both affected and unaffected areas (Figure 3).
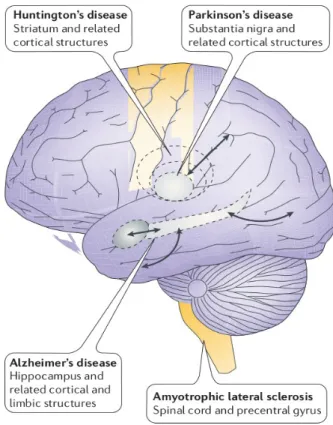
Figure 2. Schematic representation of regional vulnerability in neurodegenerative diseases.
In AD neurodegeneration initially affects the hippocampus and parahippocampal gyrus. In PD initial degeneration and neuronal loss is localized to the substantia nigra. In HD neuronal loss is initially restricted to the GABAergic neurons of striatum. ALS is characterized by the selective and progressive loss of upper and lower motor neurons of the brainstem, spinal cord and cerebral cortex. Adapted from (Mattson and Magnus 2006).
An intriguing alternative explanation is that other genes directly or indirectly interacting with the ones that are mutated are differently expressed in the most vulnerable regions and contribute to a localized alteration of either expression or physical/functional properties of the mutated genes. This suggests that to achieve a broader understanding of regional vulnerability in neurodegenerative diseases, a crucial step is to move from single genes to genome-wide expression profiling approaches, that can survey simultaneously all genes expressed in one sample and find differences in expression in an unbiased way, shedding light into region specific regulation of transcription by identifying networks of co-regulated genes.
Figure 3. Expression patterns across distinct regions of the human CNS and across different ages for four genes linked to familial forms of neurodegenerative diseases. For
each panel, the x-axis represents age (days) and the y-axis represents normalized expression (as Log2 of signal intensity). Each dot represents a sample, each color represents a region of the CNS and solid lines summarize the expression profiles for the genes APP, HTT, SNCA and FUS. The expression of these genes is essentially similar across regions affected and non-affected by neurodegeneration in the corresponding disease. Data from Human Brain Transcriptome (http://hbatlas.org/).
1.2 The Human Genome Project: putting the basis for
genome-wide expression profiling
One of the major scientific achievements of the last century, fundamental to put the basis for genome-wide expression profiling studies, was the sequencing of the full human genome. Under the name of Human Genome Project (HGP) several groups from several countries in the world joined a collaborative public effort (conceived in 1984 and officially started in 1990) with the primary aim of determining the nucleotide sequence of the entire human nuclear genome and discovering all human genes. The public effort was paralleled in 1998 by a private company (Celera Genomics of Maryland, USA), aiming at reaching the same result with a faster and more cost-effective approach (Brown 2002). Both projects concluded successfully with the release of human genome working drafts in 2001 (Lander et al. 2001; Venter et al. 2001), completed in the definitive version in 2004 (International Human Genome Sequencing Consortium 2004). The accomplishment of the HGP started the field of genomics and dramatically contributed to shaping several fields of biology into the form they have now, from basic biology, to comparative and medical genomics. In basic biology, it reshaped our view of the genome physiology, including a precise definition of the number, distribution and structure of protein-coding genes, the discovery of novel classes of non-coding RNAs (ncRNAs) and the completely unexpected pervasiveness of transposon-derived sequences, accounting for up to 45% of the genomic sequence (Lander et al. 2001). Along with the closely following sequencing of genomes of other species (such as mouse (Mouse Genome Sequencing Consortium 2002), rat (Gibbs et al. 2004) and chimpanzee (Chimpanzee Sequencing and Analysis Consortium 2005)) it boosted the field of comparative genomics, which brought e.g. to the surprising discovery that while the exomes of human and mouse are extremely similar, a substantial excess of conserved sequence, likely functional, does not code for proteins (Mouse Genome Sequencing Consortium 2002). The accomplishment of the HGP also greatly pushed forward disease research: when the project was launched, less than 100
mendelian disease genes had been identified. With the genetic and physical maps created in the first stages of the HGP the list quickly began to grow and a decade after more than 2,850 Mendelian disease genes had been identified (Lander 2011). Similar advances were seen in uncovering the basis of common diseases: as of 2000, only about a dozen genetic variants (outside the HLA locus) had been reproducibly associated with common disorders; a decade later, more than 1,100 loci affecting more than 165 diseases and traits had been associated with common traits and diseases (Lander 2011; Naidoo et al. 2011). Overall the greatest impact of genomics has been the ability to investigate biological phenomena in a comprehensive, unbiased, hypothesis-free manner, also thanks to the creation since of several publicly accessible databases collecting information about genes (e.g. Ensembl (Flicek et al. 2014) and GENCODE (Harrow et al. 2012)), SNPs and human variation (e.g. dbSNP (Sherry 2001), HapMap (International HapMap Consortium 2003), 1000 Genomes Project database (1000 Genomes Project Consortium 2012)) and many others. As a collateral consequence, the HGP challenge directly influenced and accelerated the evolution of sequencing technology, which went paired with the decrease in sequencing costs that we are still observing. The advent of high-throughput sequencing revolutionized and became an integral part of many areas of biological research. In particular it started a new age for the study of transcriptomes and transcriptional regulation: the two major consortia working in the field and their results are outlined in the next section.
1.3 Understanding transcriptional regulation: ENCODE and
FANTOM
Although all cells in the human body share essentially the same genetic code, they vary hugely in their structures and functions. Sequencing the whole genome alone does not explain how this large variety is achieved starting from the same material – the DNA present in the nucleus of each cell of an individual. In the last decade
considerable efforts were made to investigate this. In particular I will outline here the main achievements of two large international consortia dedicated to the investigation of transcription and its regulation: FANTOM and ENCODE. Besides rewriting considerable chapters of schoolbook biology and giving immense insight into the biology of transcription, starting from redesigning the concept of “gene”, they produced in the years wealths of data freely accessible to the scientific community and probably daily used in many laboratories in the world, to generate and test hypotheses and design experiments.
1.3.1 ENCODE: ENCyclopedia Of DNA Elements
The ENCODE project was launched in September 2003 as follow-up of the HGP, with the aim of identifying all functional elements in the human genome. The ENCODE project developed in two distinct parts: a pilot (2003-2007), focusing on about 1% of the sequenced genome to test and compare existing methods to rigorously analyze a given region of the genome (ENCODE Project Consortium, Birney et al. 2007), and a first production phase (2007-2012), that scaled up the methods tested to the full genome, also thanks to the introduction in the meanwhile of next generation sequencing (ENCODE Project Consortium, Bernstein BE et al. 2012). Overall the ENCODE project efforts resulted in the generation of thousands of genome-scale data sets encompassing transcripts, sites of transcription factor (TF) binding for large arrays of TFs, DNase I hypersensitive sites, histone modifications and other functional features (Stamatoyannopoulos 2012) (the major assays at the basis of ENCODE Project are summarized in Box 1). By studying the distribution of these biochemical signatures across distinct cell types, the ENCODE projects gave immense insight into the mechanisms involved in cell-specific regulation of transcription (Arvey et al. 2012; Djebali et al. 2012; Thurman et al. 2012), the combinatorial patterns of TFs needed to achieve this precise regulation (Gerstein et al. 2012; Wang et al. 2012), and their likely genic targets (Sanyal et al. 2012; Thurman et al. 2012).
Starting from the basics, results from ENCODE and FANTOM (see also next section) redefined the unit of transcription. Although the "gene" was conventionally viewed as the fundamental unit of genomic organization, on the basis of ENCODE data it is now evident that the fundamental unit is rather the "transcript" (Washietl et al. 2007; Djebali et al. 2012). Genes represent a higher-order organizational level, in which individual transcripts are used in different cellular states, guided by differential utilization of regulatory DNA. The majority of regulatory DNA regions are highly cell-type and cell-state specific (ENCODE Project Consortium 2012; Thurman et al. 2012): considering a single cell type up to 1-2% of the DNA has regulatory function; however the frequency of regulatory DNA along the genome grows as the number of cell types and states assayed increases: it is expected that 40% and possibly more of the genome sequence encodes regulatory information (ENCODE Project Consortium 2012). The large variety of datasets produced by ENCODE led to the establishment that one of the fundamental aspects of transcriptional regulation lies in the dynamic interplay between chromatin and transcriptional machinery (Stamatoyannopoulos 2012): e.g. transcription originating from enhancer elements is predominantly detected at distal DNase I hypersensitive sites flanked by H3K4me1, H3K27ac, and H3K9ac histone modifications, as extensively documented in (Djebali et al. 2012). Additionally, the use of assays able to determine long-range chromatin interactions such as Chromosome Conformation Capture Carbon Copy (5C) (Dostie 2006) or Chromatin Interaction Analysis with Paired-End-Tag sequencing (ChIA-PET) (Fullwood et al. 2009) showed that specific physical interactions and 3D connectivity of genes with one another and with their respective controlling elements appear to be general properties of long-range regulatory control (Li et al. 2012; Sanyal et al. 2012). Finally, it is now apparent that a significant proportion of strongly disease- or trait-associated variants emerged from genome-wide association studies (GWAS) localize within regulatory DNA marked by DNase I hypersensitive sites and selected TFs (ENCODE Project Consortium 2012; Maurano et al. 2012; Schaub et al. 2012).
26
Box 1: Major techniques used by the ENCODE Project.
Graphical summary of the major techniques used by the ENCODE Project. Adapted from (ENCODE Project Consortium 2012).
RNA-seq: RNA isolation, typically performed in the ENCODE Project with multiple purification
protocols to separate distinct sub-cellular fractions and transcript types, followed by high-throughput sequencing.
ChIP-seq: Chromatin immunoprecipitation (ChIP) followed by high-throughput sequencing.
Specific regions of cross-linked chromatin, i.e. genomic DNA in complex with its bound proteins, are selected by using an antibody to a specific epitope. The enriched sample is then sequenced to determine the regions in the genome most often bound by the protein to which the antibody was directed. Most commonly used are antibodies to any chromatin-associated epitope, including transcription factors, chromatin binding proteins and specific chemical modifications on histone proteins.
DNase-seq: Adaptation of DNase footprinting assay to high-throughput sequencing. The DNase I
enzyme preferentially cuts chromatin preparations at sites nearby bound proteins. The resulting cut points are sequenced to determine those genomic regions that are ‘hypersensitive’ to DNase I, corresponding to accessible DNA (also termed “open chromatin”).
FAIRE-seq: Formaldehyde assisted isolation of regulatory elements (FAIRE). FAIRE isolates
nucleosome-depleted genomic regions by exploiting the difference in crosslinking efficiency between nucleosomes (high) and sequence-specific regulatory factors (low). FAIRE consists of cross-linking, phenol extraction, and sequencing the DNA fragments in the aqueous phase.
3C and 5C: Chromosome Conformation Capture (3C) uses formaldehyde cross-linking to
covalently trap interacting chromatin segments throughout the genome. Interacting elements are then restriction-enzyme-digested and intramolecularly ligated and the frequency with which two restriction fragments become ligated is a measure of the frequency of their interaction in the nucleus. 3C uses PCR to detect individual chromatin interactions, which is not applicable for large-scale identification of chromatin interactions. To overcome this problem, 3C-Carbon Copy (5C) uses highly multiplexed ligation-mediated amplification to first copy and then amplify parts of the 3C library, followed by detection on microarrays or by quantitative DNA sequencing.
ChIA-PET: Chromatin Interaction Analysis with Paired-End-Tag sequencing. Combines chromatin
immunoprecipitation and chromosome conformation capture to identify long-range interactions mediated by a protein of interest genome-wide, using paired-end tag libraries.
1.3.2 FANTOM: Functional ANnoTation Of Mammals
To some extent parallel to the ENCODE project, FANTOM is an international research consortium established in 2000 to assign functional annotations to the full-length cDNAs that were collected during the Mouse Encyclopedia Project, established in 1995 at RIKEN (Japan), with the aim of sequencing all expressed RNAs. FANTOM has gradually developed and expanded over time to encompass the field of transcriptome analysis. The object of the project progressed from an understanding of the “elements” – the transcripts – to an understanding of the “system” – the transcriptional regulatory networks – active in individual life forms and specific to each cell. FANTOM1 and FANTOM2 projects focused on the determination of the sequences and functional annotation of large sets of length mouse cDNAs. The consortium cloned and annotated over 80,000 full-length cDNAs from a wide range of mouse tissues and integrated them with existing annotations, allowing for the identification of ca. 16,000 novel transcriptional units. This fundamentally contributed to the estimate of the number of genes that are part of the mouse genome, supported the innovative concept that most genes are associated to a large variety of transcripts and that alternative TSS usage and splicing are widespread phenomena (Kawai et al. 2001; Okazaki et al. 2002). Additionally the consortium reported the transcription of about 15,000 ncRNAs, of which only about 100 had been previously identified, suggesting for the first time the transcription of RNAs that do not code for proteins is a pervasive feature in mammalian genomes (Okazaki et al. 2002). In FANTOM3, besides working with full-length cDNAs, the FANTOM consortium utilized a new technology, Cap Analysis of Gene Expression (CAGE (Kodzius R et al. 2006); see also Box 2), to reveal that more than 63% of the mouse and human genomes is transcribed as RNA, instead of the ca. 1.5% fraction of protein-coding exons known at that time (Carninci et al. 2005). Additionally the expression of over 23,000 ncRNAs was confirmed and it was shown for the first time that over 73% of the transcriptional units show sense-antisense transcription (Carninci et al. 2005; Katayama et al. 2005). Work from the consortium brought to the discovery that mammalian promoters can be separated into two classes: "sharp" and "broad". 27
The first class represents classical promoters for which transcription initiates at a well defined position restricted to few bp; these are enriched for conserved TATA-box motifs, are usually tissue-specific and surprisingly represent a minority of the transcription start sites (TSSs). The second class, much larger, is characterized by TSSs spread across several bp; these are typically located in CpG islands and correspond to genes of broader use. Different tissues and families of genes differentially use distinct types of promoters and the usage of alternative start sites is common (Carninci et al. 2006). In FANTOM4 the focus moved to understanding how these components work together in the context of a biological network. Using CAGE adapted to high-throughput sequencing technology, the dynamics of TSS usage during a time course of monocytic differentiation in the acute myeloid leukemia cell line THP-1 was monitored. This allowed for the precise identification of active promoters and their expression levels. Computational methods were then used to build a network model of gene expression that identified the key transcriptional regulators in the differentiation process, their time-dependent activities and their target genes, which were confirmed by systematic siRNA knock-down experiments. This study was pioneering in the discovery that cell-state and cell-fate are determined by complex networks involving both positive and negative regulatory interactions among substantial numbers of TFs (FANTOM consortium et al. 2009). The latest FANTOM project, presented in Chapter 3 of this thesis, ambitiously aimed at expanding the horizon and create a map of the vast majority of human promoters and identify the regulatory networks that define virtually every single cell type in a human being.
29
Box 2: CAGE – Cap Analysis of Gene Expression
Graphical representation of the CAGE protocol adapted for use with HeliScope single-molecule sequencer. Adapted from (Kanamori-Katayama et al. 2011).
Cap Analysis of Gene Expression (CAGE) is a technology developed at RIKEN, Japan, that produces a quantitative snapshot of the 5' ends of capped mRNAs in a biological sample. The ultimate output of a CAGE experiment is a set of short nucleotide sequences, often called tags, with their observed counts. The original CAGE library preparation protocol involved cDNA synthesis, cap-trapping of 5′ complete cDNA/capped RNA hybrids, second-strand synthesis, linker ligation, full-length cDNA cloning in bacteria, digestion of 5′ tags, and concatenation and subcloning of concatemers prior to capillary sequencing (Shiraki et al. 2003). An adaptation of the protocol for the 454 sequencer was later developed and used as leading technology for the accomplishment of the FANTOM4 project (FANTOM Consortium et al. 2009). Both the original and the 454-adapted protocols required several handling steps and PCR cycles, potentially introducing artifacts and PCR biases. The simplified HeliScope CAGE protocol, schematically represented above, aimed at reducing handling steps and avoiding PCR amplifications, to overall improve the quantitative features of the technique. Briefly, HeliScope CAGE library preparation can be summarized as follows: (a) first-strand cDNA is generated from total RNA using an excess of random primer (b) the 5′ end complete first-strand cDNAs are captured through the cap structure (c) first-strand cDNA is poly(A)-tailed and blocked, then loaded directly onto the HeliScope flow cell for sequencing. An optimized protocol for CAGE library production directly applicable to Illumina sequencers was later published and is the procedure currently used in our lab (Takahashi et al. 2012).
1.4 Outlook and thesis aims
Work from large consortia such as ENCODE and FANTOM put the basis for the comprehensive understanding of the biology of transcription. At the same time one of the fundamental observations that emerges from these studies is that transcription is tightly regulated in a cell- and tissue-dependent manner. Considering that neurodegenerative diseases show a high degree of regional vulnerability and neuronal loss, transcriptional features, perturbations or transcripts that are specific for the regions involved may have a role in their pathogenesis. To gain a more precise understanding of region-specific regulation of transcription in brain and consequently region-specific vulnerability in neurodegenerative diseases, genome wide transcription profiling studies specifically focusing on appropriate sets of control and disease brain samples are needed. As for 2009, when this PhD project started, the only large expression profiling work performed on a comprehensive selection of different regions of the human post-mortem CNS and non-CNS tissues was (Roth et al. 2006). The main conclusions of this study were that CNS regions are significantly different from non-CNS tissues and similar between them, while the 20 CNS regions profiled could be segregated into discrete groups with underlying similarities in anatomical structure and functional activity. Besides this study, a repertoire of other expression profiling works on arrays of tissues that included brain samples suggested over the years some general features of brain transcription. In particular it was suggested that brain tissue is characterized by the highest number of genes expressed (Ramsköld et al. 2009) and by the highest transcriptional complexity (Jongeneel et al. 2005; Ramsköld et al. 2009), by over-representation of expressed simple and low-complexity repeats with respect to other tissues (Faulkner et al. 2009) and transcripts originating in CG rich regions (Roider et al. 2009). Additionally, work in mouse suggested that brain tissues express a large array of ncRNAs (Mercer et al. 2008).
With this perspective in mind, the work presented in this thesis is the first step of an ongoing effort to precisely characterize brain-specific and particularly region-30
specific transcription of coding and non-coding genes in the human aged brain. This is achieved by creating a high resolution expression profiling atlas of different areas of the human aged brain, with the long term aim of investigating the networks that are transcriptionally altered in disease and functionally characterize the transcriptional networks involved.
The specific aims of this thesis can be summarized as:
• gain general insight into the dynamics of transcription in the CNS
• specifically create a high resolution expression profile atlas of distinct brain regions from aged donors
• extend the atlas to matched disease samples to identify and functionally validate networks of co-expressed transcripts perturbed in disease
1.5 Thesis outline
In Chapter 2, we used CAGE to profile transcription in 5 regions of the CNS (caudate, putamen, frontal and temporal cortices, and hippocampus) derived from post-mortem material of human aged donors and additionally investigated the methylation landscape in the same regions. We first characterized the transcriptome of aged human brain and evaluated the extent of alternative promoter usage. Then, we quantified differences in gene expression and promoter usage across the 5 brain regions. Finally, we analyzed the extent to which methylation influenced the observed expression profiles.
In Chapter 3, as part of the FANTOM5 consortium, we used CAGE adapted to single molecule sequencing to map TSSs and their usage in human and mouse primary cells, cell lines and tissues to produce a comprehensive overview of gene expression across the human body.
In Chapter 4, we focused in particular on the CNS samples included in the FANTOM5 tissue collection, representing 15 regions of the human CNS, derived from post-mortem material from aged donors. First we compared the CNS expression signature and transcriptional complexity to the other tissues present in
the collection and characterized the transcriptional context of transcripts up-regulated in brain. Additionally we investigated differential expression across distinct CNS regions.
In Chapter 5 we used a previously published custom microarray ncRNA expression dataset generated from twelve human tissues to identify tissue-specific ncRNAs. We investigated the relative abundance of ncRNAs across tissues and correlated brain-specific ncRNAs expression to neighboring protein-coding genes. Additionally we investigated repeat representation at the origin and in the transcript body of brain-specific ncRNAs.
In Chapter 6 I will summarize the results presented in this thesis and discuss the major discoveries and limitations in the context of the advances in CNS-centered expression profiling studies since 2009. Additionally I'll present future applications and approaches that, making use of the work presented in this thesis, can provide further insight into brain-specific and region-specific transcripional regulation and ultimately into the regional vulnerability that characterizes many neurodegenerative diseases.
Chapter 2
Regional differences in
gene expression and
promoter usage in aged
human brains
Published as Pardo LM*, Rizzu P*, Francescatto M, Vitezic M, Leday GG, Sanchez JS, Khamis A, Takahashi H, van de Berg WD, Medvedeva YA, van de Wiel MA, Daub CO, Carninci P, Heutink P. 2013. Regional differences in gene expression and promoter usage in aged human brains. Neurobiol. Aging 34(7):1825-36. *Authors contributed equally.
Chapter 3
A promoter level
mammalian expression
atlas
Published as Forrest ARR, Kawaji H, Rehli M, Baillie K, de Hoon MJL, Haberle V, Lassmann T, Kulakovskiy IV, Lizio M, Itoh M, Andersson R, Mungall CJ, Meehan TF, Schmeier S, Bertin N, Jørgensen M, Dimont E, Arner E, Schmidl C, Schaefer U, Medvedeva YA, Plessy C, Vitezic M, Severin J, Semple CA, Ishizu Y, Young RS, Francescatto M, et al. 2014. A promoter level mammalian expression atlas. Nature 507:462–470.
Chapter 4
A high resolution spatial
promoterome of the human
brain
Francescatto M*, Vitezic M*, Rizzu P, Simón-Sánchez J, Andersson R, Kawaji H, Itoh M, Kondo N, Lassmann T, Kawai J, Suzuki H, Hayashizaki Y, Daub CO, Sandelin A, de Hoon MJL, Carninci P, Forrest ARR, Heutink P and the FANTOM consortium. 2014. A high resolution spatial promoterome of the human brain. Manuscript.
Abstract
The human CNS is an extremely complex organ that governs our abilities for cognition, reasoning and emotions and is the control center for the body. Its morphology and functionality during development have been well studied, but the molecular mechanisms contributing to its function and maintenance later in life remain poorly understood. Complexity at the transcriptional level is likely to play a major role in defining its morphological and functional characteristics. To investigate this we used single molecule Cap Analysis of Gene Expression to create a high-resolution atlas of transcription start sites for 15 anatomical regions of the human central nervous system, using post mortem samples derived from three aged adult donors. Sequencing on average 5 million reads per sample, we identified 95912 CAGE-defined tag clusters (TCs), supporting the expression of 19018 genes. Using the largest tissue collection produced to date with a uniform platform we show that the CNS has a unique expression signature, not limited to protein coding genes but extending to lncRNAs and novel transcripts. Additionally, it is distinguished by a significantly higher transcriptional complexity. We show that transcripts up-regulated in brain arise in a specific transcriptional context, being more often transcribed from CG rich regions, simple and low complexity repeats. We identify a set of 183 transcription factors and 206 lncRNAs up-regulated in brain which co-expression patterns identify super-groups of regions with related function/developmental derivation. 9758 TCs are differentially expressed across regions, representing four major co-expression groups, each of which includes genes that are known to be relevant for the function of the associated regions. E.g. TBR1 and ARNT2 transcription factors and cortex markers FXYD6, CCK and CBLN2 belong to the co-expression group associated with cortex and limbic system. In addition we find in this group 37 lncRNAs of unknown function and 147 intergenic TCs, over 74% of which overlap frontal-derived H3K4me3 ChIP-seq data, strongly supporting that they correspond to genuine novel transcripts. Due to its high-resolution and the large variety of CNS regions represented, this study provides an invaluable resource for understanding region-specific transcriptional regulation and provide testable hypotheses that can be followed up in the
laboratory.
Introduction
The human brain is an exceptionally sophisticated organ divided into distinct anatomical districts that are characterized by specific cellular compositions and functions and are interconnected by intricate communication networks. Complexity at the transcriptional level is likely to play a major role in the establishment and maintenance of the morphological and functional complexity of the brain and its multifaceted parts. Studies to date, investigating genome wide expression profiles of the human central nervous system across different regions and developmental stages (Roth et al. 2006; Kang et al. 2011; Colantuoni et al. 2011; Hawrylycz et al. 2012) have provided invaluable insight into the transcriptional dynamics and regulation in different areas of the human brain. However, these studies mostly relied on array-based technologies that are biased in their probe design and limited by their inability to detect novel transcripts and transcript isoforms, or to distinguish between closely related paralogous sequences. In addition they often cannot quantify absolute expression (Fu et al. 2009). Next generation sequencing (NGS) is rapidly replacing microarrays as the technique of choice for transcription profiling studies in an effort to overcome these limitations. Cap analysis of gene expression (CAGE) is a transcriptome exploration technology that captures the 5’ end of capped RNA transcripts (Kodzius et al. 2006; Takahashi et al. 2012) allowing for the high resolution profiling of transcription start sites (TSSs) in a quantitative and annotation-independent manner. CAGE has been successfully employed to profile transcription in several organisms and clonal cell lines in varying experimental conditions (FANTOM consortium 2009; Hoskins et al. 2011; Plessy et al. 2012; ENCODE Project Consortium 2012) giving novel insights into mammalian transcriptional regulation (Lenhard et al. 2012) and has been the technology of choice of the FANTOM (Functional Annotation of the Mammalian Genome) consortium (FANTOM Consortium 2009). The FANTOM5 project uses CAGE, adapted to the single-molecule sequencer Heliscope (Kanamori-Katayama
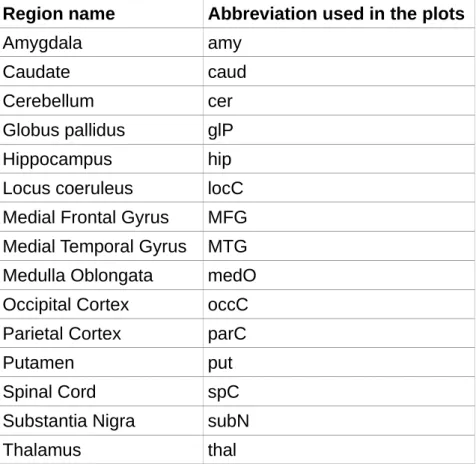
et al. 2011) to avoid additional PCR steps and improve its quantitativeness, to profile over 900 human tissues, primary cells and cell lines, aiming to build a complete promoter map to uncover the transcriptional regulatory networks defining every human primary cell type (Forrest et al. 2014). As part of FANTOM5, we profiled transcription for 15 regions of the human central nervous system (CNS, Table 1, Supplementary Figure 1), using post mortem tissue from three aged adult donors. The regions belong to distinct anatomical and functional domains and are involved in a wide range of neurological phenotypes, including major diseases. Our data extend and complement microarray-based brain gene expression studies (Roth et al. 2006; Kang et al. 2011; Colantuoni et al. 2011; Hawrylycz et al. 2012), the recently published ENCODE data (primarily based upon a limited set of clonal cell lines (ENCODE Consortium 2012)) and our previous work (based on CAGE profiling of a set of five brain regions (Pardo et al. 2013)).
This study provides an important resource for in depth brain specific functional annotation. Using the largest collection produced to date with a uniform platform we show that brain has a distinctive expression signature with respect to other tissues, not limited to protein coding genes but extending to lncRNAs and novel transcripts. Additionally, it is distinguished by a higher transcriptional complexity, to which non-coding transcripts importantly contribute. We show that transcripts up-regulated in brain are characterized by a specific transcriptional context, being often derived from CG rich regions and specific classes of repeats. We also identify a set of transcription factors and lncRNAs up-regulated in brain, that might have an important role in brain-specific transcriptional regulation. We assess the extent of regionally biased transcription across distinct regions of the adult brain, highlighting a set of locally expressed lncRNAs and transcription factors. This work is part of the FANTOM5 project. Data downloads, genomic tools and co-published manuscripts are summarized at http://fantom.gsc.riken.jp/5/.
Results
The complex transcriptome of the human brain
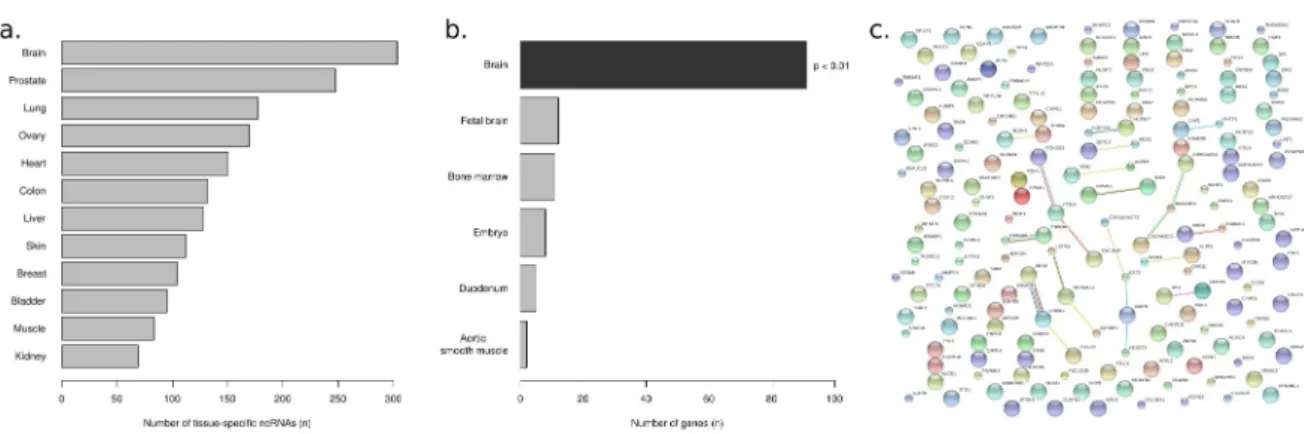
We identified 95,912 tag clusters (TCs) expressed in the human CNS, 95.0% of which could be associated to 19,018 GENCODE genes. 78.9% and 16.9% of the annotated TCs mapped to protein-coding and non-coding transcripts respectively. The most represented non-coding biotypes were processed transcripts (47.0%), retained introns (23.9%) and long non-coding RNAs (lncRNAs) (8.7%) (Table 2). We also identified 4,779 (5.0%) TCs mapping to previously un-annotated, intergenic regions, representing bona fide novel transcripts. Using the publicly available ChIP-seq dataset published in (Shulha et al. 2013), which reports genome wide maps for the histone H3K4me3 (associated with promoters that are active or poised to be activated (Barski et al. 2007)) in nuclei collected from prefrontal cortex, we found that 34.5% of these intergenic TCs overlap H3K4me3 signature, supporting the hypothesis that they represent TSSs of novel transcripts. Using the FANTOM5 tissue collection and the advantage of having a broad set of samples profiled with the same technology (35 CNS tissues and 91 heterogeneous non-CNS tissues, listed in Supplementary Table 1), we were able to investigate overall expression differences between CNS and other tissues. We produced multidimensional scaling (MDS) plots of CAGE expression profiles for four subsets of the data, representing coding genes, transcription factors, lncRNAs and intergenic TCs. As shown in Figure 1 (panels a. to d.) for all the four groups the CNS tissues clustered together and were clearly separated from the other tissues, showing that the CNS expresses a specific range of coding genes (in particular transcription factors) and lncRNAs, and is also distinguished by the expression patterns of putative novel transcripts. Additionally, analogous clustering based on transcribed enhancers (Andersson et al. 2014, Figure 3) similarly showed that CNS samples clearly separate from other FANTOM5 human tissues. These results show that the CNS expression signature is distinctive with respect to other tissues, not only on the level of coding genes but also on lncRNAs, novel transcripts and transcriptional regulators, such as transcription factors and enhancers. This is particularly interesting in light of the fact that although the
CNS tissues are extremely heterogeneous, they form an homogeneous cluster with respect to CNS samples.
One hypothesis to explain this remarkable separation is that brain tissues express a broader range of transcripts, therefore inducing the expression patterns observed. To assess this we examined the cumulative distribution of tags accounted for by the 10,000 most highly expressed TCs in each tissue library: as shown in Figure 1e in general the curves that represent CNS samples grow slower than the ones representing other tissues, suggesting that brain has a more complex and diversified transcriptome. To quantify this, we calculated the number of TCs required to cover at least 50% of the tags sequenced in each of the libraries, similarly to what was described in (Jongeneel et al. 2005). These numbers, referred to as N50, can be considered as a measure of transcriptional complexity, since tissues with simple transcriptional programs are characterized by a low N50 value (e.g. in the library prepared from salivary gland the two most highly expressed TCs, mapping to the genes Submaxillary Gland Androgen Regulated Protein 3B and Statherin, accounted for almost 60% of the total tags sequenced in that library, therefore N50 for salivary gland was 1). Comparing N50 values for the CNS samples against the other tissues, we observed a significant difference (p−value = 1.213e-09, Wilcoxon rank sum test, Figure 1f) showing that in general CNS samples give rise to more complex libraries. Repeating this analysis based only on TCs mapping to non-coding loci we still obtained a significant difference between CNS and other tissues (Supplementary Figure 2), showing that the non-coding fraction contributes significantly to the complexity of brain transcriptome.
Trancripts up-regulated in brain
To identify TCs with higher expression in the CNS with respect to other tissues, we performed differential expression analysis. Of the 152,952 TCs expressed in the FANTOM5 tissue collection, 55,033 (36.0%) were differentially expressed; in particular, one third had higher expression in brain (18,626 TCs, mapping to 3,928 distinct genes; genomic coordinates , fold-changes and p-values provided in Supplementary Table 2) (Figure 2a) and will be referred to as Brain-up in the rest
of the manuscript, to indicate that they are up-regulated in brain.
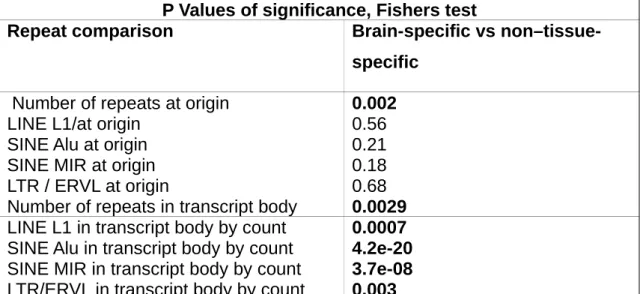
We first investigated the general differences in genomic context between the two sets of TCs, up-regulated and down-regulated in brain tissues. Comparing GENCODE annotations gave similar proportions of known TSS, coding sequences, antisense or intergenic signals. However TCs with higher expression in brain were slightly more likely to be distal to annotated TSSs (between 500 and 1000 bps upstream) or 3'UTR-derived (Supplementary Figure 4). As deep sequencing of the human brain transcriptome has not been done previously to the same extent, these differences may reflect transcripts up-regulated in CNS that currently lack accurate gene models. It was previously reported that genes expressed in brain are frequently located in CpG rich regions (Roider et al. 2009): consistently with this observation, 5,811 (31.2%) of the brainUp TCs were located in CpG islands, as opposed to 7,642 (21.0%) in the down-regulated group (p < e-16, Fisher exact test). It has also been suggested that brain tissues express a distinctive repertoire of repeats (Faulkner et al. 2009; Xu et el. 2010; Tyekucheva et al. 2011): in general we observed a sightly larger proportion of brainUp TCs overlapping repeats (18.9% vs. 13.1%). In particular, a remarkably large proportion of brainUp TCs overlapped simple and low complexity repeats (59.0% of brainUp TCs, as opposed to 26.5%), while there were less expressed LTRs (8.8% as opposed to 34.4%, Figure 2b). There was no overall difference in the number of expressed Long and Short Interspersed Elements (LINE and SINE respectively); however a significant difference was observed in the relative proportion of expressed Alu (in the SINE family) and L1 (in the LINE family) repeats (Figure 2c). Genes containing TCs up-regulated in brain were highly enriched in GO Biological Process terms and KEGG pathways related to brain function (Figure 3 a and b) as well as Genetic Association Database diseases such as schizophrenia, epilepsy and alcohol dependence (full list of enrichments provided in Supplementary Table 3). Looking at candidates that might have an important impact at the regulatory level, we investigated brainUp transcription factors and lncRNAs, with the specific aim of identifying novel elements that could be of interest for future research on genes involved in the establishment and/or maintenance of CNS transcriptional specificity. We identified 520 brainUp TCs mapping to transcription factors (183
genes): these included several examples of genes with critical roles in the development of the CNS such as TBR1, required for early cortical development (Bulfone et al. 1995), ZIC1 and ZIC4, fundamental for cerebellar development (Blank et al. 2011), BHLHBE22, involved in neocortex development (Joshi et al. 2008). The most highly expressed TF was TSC22D4 (Figure 3c), suggested to be important for granule cells differentiation in mouse (Canterini et al. 2012). Importantly, we also found several brainUp TFs with unknown function, such as the poorly characterized Zinc Finger proteins ZNF25, ZNF273, ZNF302 and several others (the full list of brainUp TCs mapping to TFs ranked by expression in the CNS is provided in Supplementary Table 4). Interestingly some of these have recently been shown to be relevant for major diseases: HIVEP3, shown to be an essential regulator of adult bone formation (Jones et al. 2006) was suggested as candidate gene for the PARK10 locus associated to Parkinson's Disease (Li et al. 2007); PRDM8 was recently indicated as the causal protein of the early onset Lafora disease, a type of progressive myoclonus epilepsy (Turnbull et al. 2012), ZNF385D was recently linked to reading disability and language impairment (Eicher et al. 2013) and negative symptoms in schizophrenia (Xu et al. 2013); TEF, associated with sleep disturbances and depression in Parkinson's disease patients (Hua et al. 2012; Hua et al. 2012). We identified 419 brainUp TCs mapping to 206 distinct lncRNAs (full list of brainUp TCs mapping to lncRNAs ranked by expression in the CNS is provided in Supplementary Table 4). Only two of them corresponded to known genes: the maternally imprinted genes MEG3 and H19. The remaining lncRNAs, such as the most highly expressed in brain (AC073479.1, Figure 3d) had no known annotation; intriguingly, however, unsupervised clustering based on their expression profiles identified four groups of regions with related developmental derivation, function and/or projections (Figure 3e): 1) cerebellum, 2) cortex along with amygdala and hippocampus (cortex-limbic system group), 3) caudate and putamen (striatum), thalamus, globus pallidus, substantia nigra, locus coeruleus, spinal cord and medulla oblongata (brain stem-basal ganglia group). Similarly, clustering based on expression of brainUp TCs mapping to TFs identified the same four groups of regions (Figure 3f), suggesting that these lncRNAs and TFs up-regulated in brain have functional relevance in the biology of
these regions.
Region specific transcription in the adult
In order to assess individual differences in expression across distinct brain regions, we performed differential expression analysis and identified 9,758 differentially expressed TCs, mapping to 3,891 genes. The region with the largest number of differentially expressed TCs was cerebellum (Figure 4a), possibly due to the fact that it is characterized by the highest neuron to glia ratio in the CNS (Azevedo et al. 2009). Besides this case and consistently with previous reports (Hawrylycz et al. 2012) we didn't identify expression signatures that univocally define single regions, but rather observed four major expression patterns shared across multiple regions, in a way that mimics what we saw for transcription factors and lncRNAs up-regulated in brain (Figure 4b). Based on this evidence, we used k-means clustering to separate the differentially expressed TCs into four mutually exclusive co-expression modules that we named according to the regions they represent (Table 3, Supplementary Figure 5). As expected, in each of them we found TCs mapping to genes that are known markers for the anatomical groups of regions they represent. For example in the cortex-limbic system group we fond the genes FXYD6, CCK and CBLN2, markers for cortex layers 2/3/6 (Zeng et al. 2012); the markers for granule cell progenitors MEIS1, PAX6, ZIC1 and ZIC2 (Salero and Hatten 2007) were consistently assigned to cerebellum; the striatum markers SST, DRD1 and DRD2 were found in the striatum group. The brain stem - basal ganglia group is clearly the most heterogeneous, however we found in this group enzymes involved in the production of specific products that are only synthesized in some of the regions in this group such as TH, DDC and DBH. Additionally we found in this group important components of myelin such as PLP, MOG and MBP, suggesting enrichment in these regions for glial cell types. Interestingly and consistently with our previous observations on genes up-regulated in brain, specific sets of TFs were expressed in each of the four groups (full information provided in Supplementary Table 5). For example, several members of the HOX genes, a highly conserved gene family involved in the definition of antero-posterior patterning during embrionic development, were
assigned to the brain stem – basal ganglia group; ARNT2, a member of bHLH-PAS TF family linked to nervous system development and previously described as a key factor in mouse hippocampus gene regulation (Valen et al. 2009) belonged to the cortex-limbic system group. Using STRING (http://string-db.org/), a database of protein-protein interactions (PPI) based on genomic context, high-throughput experiments, co-expression and literature (Szklarczyk et al. 2011) we could confirm known interactions for a large number of the TFs in each set (Supplementary Figure 6), which suggests that novel connections in each group will be possibly discovered with future research.
Since regionally biased expression of coding genes has been described extensively (Kang et al. 2011; Hawrylycz et al. 2012), we focused on the expression patterns of TCs mapping to poorly characterized transcript classes and genomic regions. In the set of differentially expressed TCs, 1,769 (18.1%) mapped to non-protein coding transcripts and included different biotypes; the most represented classes, accounting for 85.1% of the non-coding fraction, were processed transcripts, retained introns and lncRNAs (Figure 4c). Examples of lncRNAs with regionally biased expression patterns included the uncharacterized transcripts RP11-307B23.1 (brain stem-basal ganglia), RP11-59J5.1 (cerebellum), MIR7-3HG, AC113617.1 and RP11-60A8 (cortex-limbic system), CTA-929C8 (striatum) (the full list of region specific TCs mapping to lncRNAs and corresponding annotations is provided in Supplementary Table 6). Of the differentially expressed TCs mapping to poorly characterized transcript classes, 544 (5.6%) were intergenic, indicating potential new coding/non-coding genes and/or alternative TSSs. Using the histone H3K4me3 ChIP-seq dataset published in (Shulha et al. 2013), we found that 49.1% of these intergenic TCs overlaps the H3K4me3 signature, percentage that increased to 74.1% when restricting to intergenic TCs belonging to the cortex-limbic system group, supporting the hypothesis that they mark TSSs of novel transcripts. A very interesting example of how these intergenic signals can represent novel transcripts is shown in Figure 5d. We identified a set of cerebellum-specific TCs in an intergenic region located 850 kb downstream to the gene KCNJ3, a potassium channel gene that belongs to the cerebellum group and has a suggestive implication with epilepsy (Chioza et al.
2002). RNA-seq expression data available for one of the adult cerebellum samples included in this study suggests the presence of a 140 kb novel transcript located ca. 850 kb downstream to the gene KCNJ3. Interestingly, the genomic region comprising of the novel transcript and the last exon of KCNJ3 was found to be deleted in two patients affected by developmental disorders with language delay and communication difficulties, for which a conclusive causal variant was not identified (Newbury et al. 2009).
Discussion
In this study we generated a comprehensive atlas of transcription start sites for the human central nervous system, by sequencing at high depth (5 million reads per sample on average) CAGE libraries for 15 anatomically distinct regions of the CNS (Table 1). We identified 95,912 TCs, supporting the expression of 19,018 coding and non-coding genes, as annotated in Gencode v10. With this resolution, we broaden the landscape of brain gene expression: e.g. (Kang et al. 2011) reported the expression of 15'132 mainly coding genes in at least one region/developmental stage, while our previous study on a limited set of brain regions (Pardo et al. 2013) reported 16'888. It is likely that this increase is due to a combination of broader set of regions profiled, use of an annotation-independent profiling technique and extremely high sequencing depth. In particular we identified 4,779 intergenic TCs that represent bona fide novel transcripts. Notably 34.5% of them were supported by ChIP-seq H3K4me3 signature (marking sites of active transcription) derived from frontal lobe nuclei (Shulha et al. 2013): it is likely that with matched data this percentage would increase to 100%. Additionally an important fraction of the TCs for which we detect expression in brain (12.0%) maps to processed transcripts and retained introns, i.e. mainly representing non-coding transcripts associated to coding genes. This finding couples with recent publications (e.g. ENCODE Project Consortium 2012) demonstrating that pervasive transcription is a common feature of mammalian genomes. Although the functional meaning, and perhaps relevance, of this type of transcripts is under scrutiny and will require years of work to be