Development of luminescence decay time based
dual sensor comprising temperature
compensated oxygen sensor and temperature
sensor
Master Thesis
ofJoana Angélica de Sousa Loureiro
Developed for Dissertation Class
in
University of Maryland, Baltimore County and Center for Advanced Sensor Technology
Chemical Engineering Department
July 2010
UMBC Advisors:Dr. Govind Rao Dr. Hung Lam
This project is the result of the exchange program between the University of Engineering of Oporto University (FEUP) and University of Maryland, Baltimore County (UMBC). All the research was carried in UMBC. I thank Dr Govind Rao for welcomed me and let me doing my master's thesis with him and his team. I thank also the English course that he offered me, as it has enabled me to write this thesis with greater ease and accuracy.
A special thank to Dr Hung Lam for everything he taught me, for supervising the work, for his help and suggestions and for being patient with my difficulty in English language.
A additionally thank you to all members from the laboratory team, for their help with the handling of instruments.
Dr. Manuel Alves followed my work over time and I am grateful to him.
Many thanks to my parents, Carlos e Ana, for their always present support and I also recognize all the efforts they made for me and for proportionate everything that I have ever done till this present day. To my family and my friends that even from distance gave me incentive, my gratefully acknowledgement.
I thank to my great friend Guilherme for all the times we spent during these five years. I also want to thank him and João for their company and for all the good talks in this lasts months.
The Reitoria da Universidade do Porto is gratefully acknowledged for their financial support.
Finally I thank all my teachers because much of the knowledge of chemical engineering that I have, I owe them.
Abstract
Fluorescence based oxygen sensors which used to be just an academic challenge, have been won shares in medical technology, biotechnology, environmental and food technology markets. They are based on phenomenon that the fluorescence of certain dyes depends on oxygen concentration of their environment. The aim of this work is to develop a dual sensor to measure both temperature and oxygen concentration with temperature compensated.
The dual sensor has two polymer layers which are fused together. An oxygen sensitive dye such as Tris(4,7-diphenyl-1,10-phenanthroline) ruthenium(III) (RUDPP) is incorporated into the oxygen permeable silicone layer while the temperature sensitive dye (tris(dibenzoylmethane) mono(5-amino-1,10-phenanthroline)europium(lll), (EUTDAP)) is be embedded in a p
olymethylmethacrylate
(PMMA). Both reagents are highly temperature dependents.To measure the temperature and the oxygen concentration it is necessary to determine the luminescence decay time. This can be calculating by time domain and frequency domain techniques. With the fusion of these two methods is possible discriminate the luminescence of the oxygen sensitive dye and the temperature sensitive dye. Lifetime measurement with time domain technique requires a light source with fast switch-off time significantly faster than the decay time of the luminophore and a photo detector which should be fast enough to measure the decaying luminescence with sufficient resolution. This method is good to measure dyes with long lifetime. In frequency domain method the decay time is measured indirectly via phase shift originates by lifetime delay of the luminophore. The phase shift can be measured by exposing the luminophore to modulated excitation light. The resulting luminescence has also the same frequency but is phase shifted. This method is good to measure dyes with short lifetime.
The present study proves that employing both time and frequency domain techniques, the individual lifetime of two luminophores can be discriminated and determined two sensors layers accurately without using complicated optics. The discrimination is possible even if the emission spectra of both dyes completely overlap one another. Two independent mathematical models were found to translate the lifetime measured to the actual temperature and oxygen concentration temperature correction.
Index
Index ... iii
List of Figures ... v
List of Tables ... viii
Notation and Glossary ... ix
1 Introduction ... 1
1.1 Lifetime measurement techniques ... 2
1.2 Luminescence based temperature and oxygen sensing ... 6
1.3 Sensing Matrix ... 8
1.3.1 Temperature sensor ... 8
1.3.2 Oxygen Sensor ... 10
2 State of Art ... 13
3 Materials and Methods ... 15
3.1 Temperature Sensor ... 16
3.1.1 Temperature sensor preparation ... 18
3.1.2 Experimental procedure ... 19
3.2 Oxygen Sensor ... 20
3.2.1 Oxygen sensor preparation ... 21
3.2.2 Experimental procedure ... 22
3.3 Dual sensor ... 22
3.3.1 Dual sensor preparation ... 23
5 Technical Description and Discussion of Results ... 24
5.1 Temperature Sensor ... 24
5.2 Oxygen Sensor ... 35
5.3 Dual Sensor ... 38
4 Conclusions ... 43
5.1 Objectives Achieved ... 45
5.2 Future Work ... 47
5.3 Final Assessment ... 48
References ... 49
Appendix 1 – Instruments ... 52
List of Figures
Figure 1 - Jablonski Diagram ... 3
Figure 2 - Decay curves of RUDPP and EUTDAP. The decay time of RUDPP is a tiny fraction of the decay time of EUTDAP. By waiting until the luminescence of RUDPP is diminished, the decay time of EUTDAP can be determined without any interference from RUDPP. ... 4
Figure 3 - The principle of the lifetime measurement by the frequency domain. ... 5
Figure 4 - The dependency of the luminescence from the modulation frequency. The frequency sweeps reveal that the luminescence of the europium complex EUTDAP due to its longer lifetime declines at a much faster pace than the luminescence of the ruthenium complex RUDPP. This phenomenon can be utilized as a filter. At 74kHz the luminescence of the europium complex is practically diminished. ... 6
Figure 5 - Luminescence lifetime of RUDPP dependence on oxygen and temperature ... 7
Figure 6 – Molecular estruture of Eudtap ... 8
Figure 7 – (A) Excitation spectra of EUTDAP. The dye is excited by one single violet LED. (B) Emission spectra of EUTDAP. ... 9
Figure 8 – Polymerization of PMMA. ... 9
Figure 9 – Molecular structure of RUDPP... 10
Figure 10 - (A) Excitation spectra of RUDPP. The dye is excited by one single violet LED. (B) Emission spectra of RUDPP. ... 10
Figure 11 - The schematic of gas permeation in a rubber membrane ... 11
Figure 12 – Part of polyacrylonitrile molecule. ... 11
Figure 13 – Molecular structure of the silicone polymer chain. ... 12
Figure 14 – Evolution of the equipments to measure the oxygen concentration. ... 14
Figure 15 – Temperature Sensor. ... 18
Figure 16 – Temperature Sensor with PAN membrane. ... 19
Figure 17 - Oxygen Sensor. ... 22
Figure 18 - Dual Sensor. ... 23
Figure 19 - Response of the probes with different dye concentration to temperature. ... 25
Figure 21 – Response of the temperature probe at 25 ºC over a period of several hours in contact with water. The luminophore concentration of the probe is 1 mg/mL. ... 26 Figure 22 – Response of the temperature probe to various temperatures in presence and absence of O2. The luminophore concentration of the probe is 1 mg/mL. ... 27 Figure 23 – Excitation spectra at various temperatures in presence of O2. The luminophore concentration of the probe is 1 mg/mL. ... 28 Figure 24 – Excitation spectra at various temperatures in absence of O2. The luminophore concentration of the probe is 1 mg/mL. ... 28 Figure 25 – Excitation spectra in presence and absence of O2 at 10 ºC. The luminophore concentration of the probe is 1 mg/mL. ... 29 Figure 26 – Intensity of EUTDAP dye after the excitation in function of the temperature in presence and absence of oxygen, 1 mg/mL... 30 Figure 27 – Emission spectra to various temperatures in presence of O2. The luminophore concentration of the probe is 1 mg/mL. ... 31 Figure 28 – Emission spectra to various temperatures in absence of O2. The luminophore concentration of the probe is 1 mg/mL. ... 31 Figure 29 – Emission in presence and absence of O2 at 10 ºC. The luminophore concentration of the probe is 1 mg/mL. ... 32 Figure 30 – Intensity of EUTDAP dye after the emission in function of the temperature in presence and absence of oxygen, 1 mg/mL... 32 Figure 31 – Intensity of the luminophore in function of the time, at deferent times of continuous exposition at blue light. ... 33 Figure 32 - Excitation spectra at various times in UV light exposition in presence of O2. The luminophore concentration of the probe is 1 mg/mL and stay at room temperature. ... 34 Figure 33 - Emission spectrum at various exposure duration to UV light in presence of O2 at room temperature. The luminophore concentration of the probe is 1 mg/mL. ... 34 Figure 34 – Reflection and refraction at the interface between air and water. ... 35 Figure 35 – Temperature Sensor. ... 35 Figure 36 – Response of the oxygen probe to various temperature. The luminophore concentration of the probe is 20 mg/mL. ... 36
Figure 37 – Lifetime of the luminophore in function of the time, at deferent times of continuous exposition at blue light. ... 37 Figure 38 – Excitation spectrum of the probe at UV light exposure duration in presence of O2 at room temperature. ... 37 Figure 39 – Emission spectrum of the probe at various times in UV light exposition in presence of O2 at room temperature. ... 38 Figure 40 – Response of the temperature probe to various temperature in presence of O2. .. 38 Figure 41 - Excitation probe at various times in UV light exposition in presence of O2 and stay at room temperature. ... 39 Figure 42 – Emission spectrum to probe at various times in UV light exposition in presence of O2 and stay at room temperature. ... 40 Figure 43 - Response of the oxygen sensor and dual sensor to various temperatures. The concentration of oxygen is 21%. ... 41 Figure 44 - Response of the lifetime at different oxygen concentration and a different temperatures. ... 41 Figure 45 – Process to measure the temperature and the oxygen concentration ... 42 Figure 46 - System used to measure the lifetime in time domain. This is composed with the fluorescence spectrophotometer, thermostat to control the temperature and a computer. . 52 Figure 47 - System used to measure the lifetime in frequency domain. This is composed with the mini-bioreactor system Cellstation™ HTBR™, a gas flow controller and a computer. ... 52 Figure 48 - Optical sensor used in bioreactor system Cellstation™ HTBR™. It contain a LED with a frequency of 74000 Hz. ... 53
List of Tables
Table 1 - Fluorescence spectrophotometer parameter used in the lifetime measurements of temperature sensor. ... 17 Table 2 - Fluorescence spectrophotometer parameter used in the emission measurement of temperature sensor. ... 17 Table 3 - Fluorescence spectrophotometer parameter used in the excitation measurement of temperature sensor. ... 18 Table 4 - Fluorescence spectrophotometer parameter used in the emission measurement of oxygen sensor. ... 20 Table 5 - Fluorescence spectrophotometer parameter used in the excitation measurement of oxygen sensor. ... 21
Notation and Glossary
I0 I Ksv [O2] S0 S1 S2 T1 T2 t
Intensity at time zero Intensity
Stern-Volmer Constant Oxygen Partial Pressure Singlet ground
First electronic states Second electronic states First triplet state
Second triplet state Time Frequency Angle Lifetime List of Acronyms CCD DMF EUTDAP FD HTBR LED PAN PMMA RUDPP TD UV
Charge Coupled Device N,N-Dimethylformamide
Tris(dibenzoylmethane) mono(5-amino-1,10 phenanthroline)europium(lll) Frequency Domain
High Throughput Bioreactor Light-Emitting Diode Polyacrylonitrile Polymethylmethacrylate Tris(4,7-diphenyl-1,10-phenanthroline) ruthenium(III) Time Domain Ultra-violet
1 Introduction
Oxygen is an essential chemical species for life(Baleizao et al. 2008). As the omnipresent oxidant on earth it is essential for most of living forms on the planet. Because of this special importance the development of methods and products to determine the levels of oxygen is an important topic of research.
The determination of oxygen levels is crucial in several areas such as the fish farming, marine research (Fernández-Valdivielso et al. 2003; Zhao and Liao 2002), biotechnology (Chuppa et al. 1997; O'Mahony et al. 2006; Wunschel et al. 2005), pharmaceutical industry, medicine and diagnostics of diseases (Mekhail et al. 2004; Stefanadis et al. 2004), in underground geochemical studies (Grosswig et al. 1996), food industry (Marshall et al. 2003; Young et al. 2004), environmental miniaturization (Canete et al. 1987; Preininger et al. 1994) and aerospace research (Baleizao et al. 2008). For instance, in fermentation processes oxygen determines the growth and in some cases the quality and quantity of the desired metabolite. The oxygen measurements in tissues have a great clinical significance, for cancer therapy optimization, for aiding in the diagnosis and treatment of vascular disease to name a few examples. In food, chemical and pharmaceutical industries oxygen is employed for chemical synthesis. In environmental science the oxygen rate in water is a crucial indicator of the water ecosystem health. Since the development of the first optical fluorescence-based sensor for oxygen in academic research 40 years ago, (Bergman 1968), the optical oxygen sensor has been commercialized and has gained popularity and market share. The reason for this success is because it is versatile, has low toxicity, highly sensitive and noninvasive (Narayanaswamy 2004; Wolfbeis 2008).
However, the temperature is a critical parameter in optical sensing of oxygen, because the fluorescence based oxygen measurement is highly temperature dependent (Coyle and Gouterman 1999; Jan Hradil 2002; Köse et al. 2005).
This study investigates the feasibility of a luminescence based dual sensor development that incorporates a temperature compensated oxygen sensor and a temperature sensor in one probe.
The sensor system utilizes the filtering effect of the time domain (TD) and frequency domain (FD) techniques to discriminate the luminescence of the oxygen sensitive dye and the temperature sensitive dye. This system will be able to separate two luminescence signatures even if they entirely overlap. Hence, this technique will eliminate the necessity to split up the signal beam, thereby minimizing the loss of signal. At the same time, it only requires one
photodetector and only one inexpensive low attenuating long pass filter. The attenuation caused by the long pass filter is about 30 percent lower than the band pass filter that is used in conventional approaches. In this way, this system will be both more sensitive and more cost effective.
The sensing matrix has two polymer layers which are fused together. An oxygen sensitive dye such as Tris(4,7-diphenyl-1,10-phenanthroline) ruthenium(III) (RUDPP) is incorporated into the oxygen permeable silicone layer while the temperature sensitive dye (tris(dibenzoylmethane) mono(5-amino-1,10-phenanthroline)europium(lll), (EUTDAP)) is embedded in p
olymethylmethacrylate
(PMMA).1.1
Lifetime measurement techniques
When a luminescence dye is exposed to light of certain wavelength, it undergoes a transition from the energetically ground state to the excited state. When it returns to its ground state it releases the previously absorbed energy by radiation or in other words, the molecules emit photons. The necessary time to return to the ground state is called the lifetime (decay time) of the dye.
Luminescence comes in different forms. These types are dependent on the nature of the excited state. Fluorescence is the light emission from an excited singlet state or between states of the same spin state. The fluorescence lifetime is very short and is usually found in the nanoseconds range. Phosphorescence is light emission from the triplet excited state. Unlike the fluorescence process phosphorescence undergoes a transition from singlet state to a triplet state prior to the return to the ground state. This process is called intersystem crossing since this transition takes a long time, the lifetime is very long ranging from hundreds of microseconds to several hours. Both luminescence forms are temperature dependent.
The types used in this work are the fluorescence and phosphorescence.
The Jablonski diagram (figure 1) shows the processes that occur between the absorption of light and its emission. It also shows a process called phosphorescence that can occur in excited states.
Figure 1 - Jablonski Diagram (Chasteen 1996 ).
In this diagram , , are the singlet ground, first and second electronic states, respectively. and are the first and second triplet state. In each of the states of energy the fluorescent substance can have different vibrational energy levels. Normally, fluorescence lifetime is about 10 ns. The lifetime of a fluorophore is the averages time since the excitation until the return to the ground state. Few molecules in condensed phases have internal conversion. It is a quickly relaxation to the lowest vibrational level of and this occurs within 10–12 or less. In the other hand, the fluorescence lifetimes is approximated 10–8 and the internal conversion is complete before the emission (Lakowicz 2006b).
The luminescence decay time can be measured in two ways: in time domain and frequency domain.
In the time domain technique, luminescence decaying process is measured directly. This process can be mathematically described by an exponential function (Lakowicz 2006b).
(1)
where is the intensity, is the intensity in time zero, is the time and is the lifetime.
The decay time measurement in time domain method requires a light source with fast switch-off time that is significantly faster than the decay time of the luminophore and a photo detector which should be fast enough to measure the decaying luminescence with sufficient resolution. The main advantage of this method is that the actual measurement is carried out when the disturbing excitation light is switched off. Consequently, no optical filter is necessary to block excitation light from entering the detector.
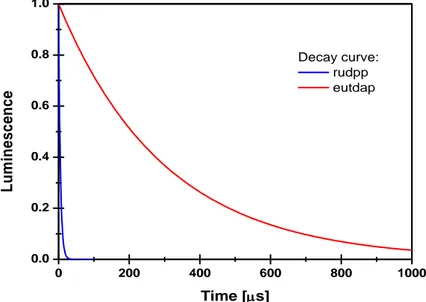
However, sophisticated optoelectronic components are required for the signal acquisition if the decay time is too short. For luminophore with long lifetime (hundreds of microseconds or more) this method is advantageous like the case of europium complex (Lam et al. 2008). Figure 2 shows the decay time of the europium complex with a decay time of 300 µs (red) and the ruthenium complex with a decay time of 6 µs (blue). The decay time of the europium complex can be determined without any interference by the ruthenium complex, for that a simply waiting until the decay curve of ruthenium complex was approximately zero before starting the measurement.
0 200 400 600 800 1000 0.0 0.2 0.4 0.6 0.8 1.0 L u m in e s c e n c e Time [s] Decay curve: rudpp eutdap
Figure 2 - Decay curves of RUDPP and EUTDAP. The decay time of RUDPP is a tiny fraction of the decay time of EUTDAP. By waiting until the luminescence of RUDPP is diminished, the decay time of EUTDAP
can be determined without any interference from RUDPP (Lam, unpublished).
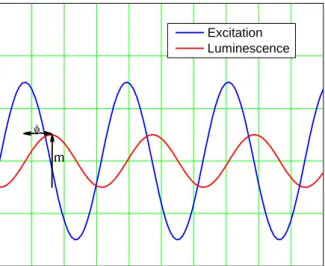
In the frequency domain the phase shift caused by the decay time is measured. If a luminophore with a lifetime is exposed to a modulated excitation light with a modulation frequency , then the resulting luminescence has also the same frequency .
However, due to luminophore lifetime the modulated luminescence is phase shifted by an angle . This delay is the phase angle between the excitation and the emission (figure 3). Intensity-modulated light at a frequency is generated from an excitation source such as a
LED. The phase shift angle of the emission is related to the decay time by the following equation:
(2)
The frequency of the incident light in this work is 74000 Hz to guarantee that the reciprocal frequency is similar to the reciprocal decay time.
Excitation Luminescence
m
Figure 3 - The principle of the lifetime measurement by the frequency domain.
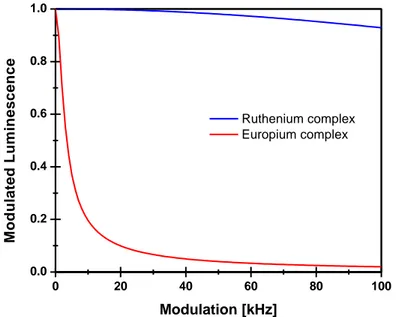
The advantage of this approach is that extremely short lifetimes can be measured precisely. One important fact is that the modulated luminescence is affected by the modulation frequency. The modulated luminescence is inversely proportional to the modulation frequency ω and the lifetime of the dye and it is described in equation 3 (Lakowicz 2006a).
(3)
This relationship can be useful. Figure 4 shows the modulated luminescence of an oxygen sensitive ruthenium complex with a 4µs lifetime and the temperature sensitive europium complex with a 500µs lifetime at different modulation frequencies.
With increasing modulation frequency the modulated luminescence decreases. However, follow equation 3 the decrease for the europium complex is much more intense than for the
ruthenium complex. Hence, the method can be used to separate the luminescence of short lived luminescence dye from long lived dyes (figure 4).
0 20 40 60 80 100 0.0 0.2 0.4 0.6 0.8 1.0 M o d u la te d L u m in e s c e n c e Modulation [kHz] Ruthenium complex Europium complex
Figure 4 - The dependency of the luminescence from the modulation frequency. The frequency sweeps reveal that the luminescence of the europium complex EUTDAP due to its longer lifetime declines at a much faster pace than the luminescence of the ruthenium complex RUDPP. This phenomenon can be
utilized as a filter. At 74kHz the luminescence of the europium complex is practically diminished (Lam, unpublished).
1.2
Luminescence based temperature and oxygen sensing
The conventional method to measure oxygen is to employ electrochemical probes based on the Clark electrode which is the standard method nowadays. However, certain shortcomings of probes type such as slow response time, small spatial resolution, interference with strong electromagnetic field and long distance measurements (maritime measurement in deep water) motivate researchers to look for alternatives. Among the alternative approaches the luminescence based sensing technology has proven to overcome the mentioned shortcomings. Certain luminescent organo-metallic complexes of ruthenium, platinum, palladium and iridium show strong oxygen sensitivity (Apostolidis et al. 2004; Baleizao et al. 2008; Demas and DeGraff 2001; Han et al. 2005). When exposed to oxygen their fluorescence intensity and decay time decreases according to the Stern-Volmer equation(equation 4) (Xu et al. 1995). This process termed quenching. Quenching takes place when a quencher molecule collides with the excited fluorophore. Fluorophore is deactivated, without any chemical alteration in the molecules (Lakowicz 2006b).
(4)
where
0 is the lifetime in absence of quencher,
the lifetime, KSV is the Stern-Volmerquenching constant and
O
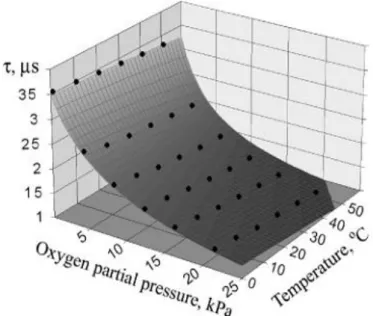
2 is the quencher concentration (Lakowicz 2006b). Various studies show that the luminescence intensity and lifetime drop with increasing temperature (Bakker and Huijsing 2000; Burt and Dave 2005). Figure 5 shows the impact of temperature on the luminescence of the oxygen sensitive ruthenium complex RUDPP.Figure 5 - Luminescence lifetime of RUDPP dependence on oxygen and temperature (Kocincova et al. 2007).
It reveals that luminescence lifetime decreases with increasing temperature albeit the oxygen concentration is kept constant. Hence in order to compensate the temperature effect, it is crucial to determine the temperature. In general, there are two types of luminophores used for temperature measurements; inorganic phosphors and organic luminophores. A variety of inorganic phosphors have been utilized as a luminescent temperature probe. Zinc sulfide showed strong temperature sensitivity. Its luminescence intensity decreases significantly from 25 to 50 ºC. Lanthanide phosphors such as La2O2S:Eu is also responsible to temperature over a wide temperature range. The decay time of La2O2S:Eu decreases over an order of magnitude as the temperature increases from 0 to 100ºC. Among the organic compounds used for temperature measurements are to mentioned rhodamine, ruthenium(II)
tris(1,10-phenanthroline) (ruphen) and various β-diketonate-europium(III) complexes. Unlike rhodamine with a decay time of 4ns at room temperature, RUDPP and β-diketonate-europium(III) complexes have long decay time, between microseconds to millisecond that is highly temperature dependent (Khalil et al. 2004). Since the decay time measurement is independent of fluorescence intensity variation caused by bleaching or leaching. Bleaching is the progressive fading of the emission intensity of the dye caused by the irreversible decomposition of the fluorescent molecules when exposed to long term continuous UV light radiation. Leaching is the elimination of materials by dissolving them away from solids.
The measurement of temperature dependent long decay time is high accurate and reliable technique to determine the temperature. Moreover, the long lived dyes make the development of low cost sensors with less sophisticated optoelectronics feasible (Lam et al. 2009).
1.3
Sensing Matrix
The sensing matrix of the dual sensor that will be tested has 2 layers, one with temperature sensor and other with oxygen sensor.
1.3.1 Temperature sensor
The temperature sensitive dye, EUTDAP, is very sensitive to temperature, has a highly photostable, strongly luminescence, yellow color and have long lifetime (Borisov and Wolfbeis 2006; Mitsuishi et al. 2003). The chemical formula is C57H45EuN3O6 and the molecular structure is sketched in figure 6.
free radical vinyl polymerization
The emission peaks bands is around 613 nm. The maximum EUTDAP emission and excitation wavelengths are show in figure 7.
400 450 500 550 600 650 700 750 0.0 0.2 0.4 0.6 0.8 1.0 300 350 400 450 500 550 0.0 0.2 0.4 0.6 0.8 1.0 L u m in e s c e n c e Wavelength [nm]
B
E x c it a ti o n Wavelength [nm]A
Figure 7 – (A) Excitation spectra of EUTDAP. The dye is excited by one single violet LED. (B) Emission spectra of EUTDAP (Lam, unpublished).
The polymethylmethacrylate (PMMA) is a good support for the temperature membranes. PMMA is a clear plastic, used as a shatterproof replacement for glass. It is more transparent than the glass. This polymer has a long chain as illustrated see in figure 8.
1.3.2 Oxygen Sensor
The oxygen sensitive dye, RUDPP, is temperature dependent (Kocincova et al. 2007), has an intense orange color, display a strong luminescence and is efficiently quenched by molecular oxygen (Klimant and Wolfbeis 1995). The chemical formula is C72H48Cl2N6Ru and the molecular structure is sketched in figure 9.
Figure 9 – Molecular structure of RUDPP (Sigma-Aldrich).
Its emission peaks bands is around 597 nm. The maximum RUDPP emission and excitation wavelengths are show in figure 10.
500 550 600 650 700 750 0.0 0.2 0.4 0.6 0.8 1.0 350 400 450 500 550 0.0 0.2 0.4 0.6 0.8 1.0 L u m in e s c e n c e Wavelength [nm]
B
E x c it a ti o n Wavelength [nm]A
Figure 10 - (A) Excitation spectra of RUDPP. The dye is excited by one single violet LED. (B) Emission spectra of RUDPP (Lam, unpublished).
The oxygen sensor can be dissolve in silicone. The silicone atoms of the polymer are linked together to a chain by the bridging oxygen atom. The polymer has high flexibility, that provides pores permitting gas diffusion (figure 11) (Zhang 2006). The permeability of
molecular oxygen in silicone is (Robb 1968).
Figure 11 - The schematic of gas permeation in a rubber membrane (Zhang 2006).
Polyacrylonitrile sheets can be used as a support. Polyacrylonitrile contains a nitrile group in each monomer and is to a certain extent polar, as can be seen in figure 12. It is soluble in DMF and it is relatively inert. In contrast silicone is chemically very inert and hydrophobic due to the methyl groups shielding the silicon and oxygen atoms (figure 13). However, the precursor for silicone used in this work is dimethyl-diethoxy-silane is reactive and tends to polymerize with other silane precursor molecule in the present of water as the catalyst. Since the precursor of silicone cannot form any covalent bonds with PAN the formed silicone polymer does not attach to the polyacrylonitril sheet.
Plasma technology is suitable to modify the chemical structure of the material surface (Höcker 2002). This method uses ionized gas at either low pressure or atmospheric pressure to either increase or decrease surface energy, respectively. The treatment improves the adhesion of silicone on PAN.
Figure 13 – Molecular structure of the silicone polymer chain.
Both dyes are excitable by commercially available LEDs, which is advantageous for the following reasons: LEDs are cheap, small and energy efficient. Hence, the use of LED decrease the cost of the development and makes the sensor systems more compact, energy efficient and feasible.
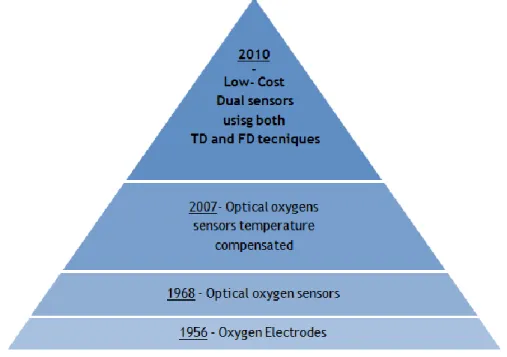
2 State of the Art
The first instrument to measure oxygen concentration was the oxygen electrode (Fatt 1968).
The optical oxygen sensors has certain advantages in comparison to conventional oxygen electrodes; it does not consume oxygen, it is not susceptible to stirring, it is not affected by electromagnetic interference, it has extremely high spatial resolution, it can be employed in hazardous area, it is capable of remote measurements and it is capable of measuring gas and liquids. Using optical oxygen sensor technology the oxygen concentration can be easily measured in micro-environment, such living cells, or in macro-environment as large as an airplane (Koo et al. 2004; Lam and Kostov 2009; Stokes and Somero 1999). Due to these advantages to conventional oxygen electrode the optical sensor has prompted interest in renowned companies. These sensors are based on the oxygen dependent fluorescence decay time of the certain fluorescence dyes. However, there is one important shortcoming; all of these sensors are temperature dependent. Unlike the oxygen electrode, the sensors do not have a built-in temperature sensor needed for the temperature compensation. Hence, environment measuring with temperature changing would fail. This critical flaw is known by research groups worldwide who make different approaches to address this shortcoming (Borisov and Wolfbeis 2006; Kocincova et al. 2007; Kose et al. 2005). The general idea is to compensate the temperature effect. Hence, the temperature has to be measured. The common approach is to use an additional fluorescence dye acting as a temperature probe. Experiments with two different methods, the lifetime domain and frequency domain were made.
For instance, fiberoptical dual sensor for oxygen and temperature were developed, which is based on the ruphen as the temperature sensitive probe and platinum(II)-5,10,15,20-tetra-kis(2,3,4,5,6-pentafluorphenyl)porphyrin (Pt-PFPP) as the oxygen sensing material (Kocincova et al. 2007). Both dyes are incorporated in a polystyrene film. The sensor measures the decay time of the two dyes with the frequency domain (phase modulation) method. In order to discriminate the fluorescence of the dyes the fluorescence coming from the sensing layer is split into two beams which are measured by two distinct photodetectors. The weak points of this system are the splitting of the beam which reduces its sensitivity and requires two photodetectors and two expensive and highly attenuating band pass filters.
In other experiment C70 fullerenes and ruphen, which are embedded in two separate polymer layers stacking on top of each other, are utilized (Baleizao et al. 2008).The detection method is based on time domain approach. The fluorescence of the dyes is separated by
optical band pass filters. Since one photodetector (CCD camera) is employed, the measurement of temperature and oxygen has to be carried out sequentially and the band pass filter to be changed accordingly. However, the usage of the CCD camera for time gated detection makes the system expensive.
In this project the sensor for dual measurement of oxygen and temperature, that eliminates the weaknesses mentioned above by employing the advantages of use both time and frequency domain technique as mentioned before, is tested.
Figure 14 (Bergman 1968; Fatt 1968; Kocincova et al. 2007) shows schematically the evolution of the equipments to measure the oxygen concentration.
3 Materials and Methods
Firstly the temperature sensors and the oxygen sensors were studied separately. Then both temperature and oxygen sensor were studied. The lifetime of the temperature sensor and the oxygen sensor is measured in two different methods: time domain and frequency domain, respectively, each one by two different systems.
To do the experiments, the sensors were carefully prepared. It was used EUTDAP (Tris(dibenzoylmethane) mono(5-amino-1,10-phenanthroline) europium(III), FW 1017.95, Sigma-Aldrich); RUDPP ( Tris(4,7-diphenyl-1,10-phenanthroline) ruthenium(III), FW 1169.17, Sigma-Aldrich); PMMA plates with 1.5 mm of thickness (McMaster); chloroform (Chloroform, 99.8+ %, A.C.S. reagent, CHCl3, FW 119.38, Sigma-Aldrich); PAN (Polyacrylonitrile, secondary standard, MW 100000, C3H3N, Sigma-Aldrich); DMF (N,N-Dimethylformamide, for molecular biology, minimum 99%, C3H7NO, FW 73.1, Sigma-Aldrich); toluene (Toluene, anhydrous, 99,8%, C7H8, FW 92.14, Sigma-Aldrich), silicone (Dow Corning, RTU Scalant, 732, Multi-purpose scalant) (Corning), one stream of air and other stream of nitrogen.
To measure the fluorescence the fluorescence spectrophotometer was used (Cary Eclipse, Varian, USA) (Varian). It is controlled by modular software with applications tailored to particular tasks. It measures the samples quickly, easily and with minimum noise. This instrument has a thermostat to control the temperature, however to control the temperature with accuracy is necessary do it manually, because the temperature within the cuvette is not the same registered in the setup of the thermostat. For this measurement a waterproof thermocouple is used (Traceable, Water-Proof Thermometer) (Company).
To make readings with fluorescence spectrophotometer it is necessary to use one rectangular quartz cuvette because the measuring have a spectral range between 170 and 2700 nm, can be used in deep UV as is the case, do not exhibit in this way background fluorescence and have low transmission value variances. This cuvette has 2 polished windows, with 1 cm path length and 1.25 mm of thickness (Optics).
The mini-bioreactor system Cellstation™ HTBR™ (Fluorometrix) was used with integrated non-invasive optical sensor. The mini-bioreactor is glass to not interfere with the measurements. This sensor resides outside and under the bottom of the reactor. The optical sensor contains a LED with a frequency of 74000 Hz that excites the oxygen sensor patch attached to the inside bottom of bioreactor. In response this causes to oxygen sensitive
luminophore to emit luminescent light. The luminescence light contains information about its intensity and lifetime. This is oxygen concentration dependent. Therefore it provides precise information on dissolved oxygen concentration in the fluid, when properly analyzed.
This instrument has a gas flow meter (by Advanced) with the nitrogen and the air inlets. The oxygen concentration inside the bioreactors can be precisely controlled. The instrument has also a heating unit, which allows the temperature of the medium inside bioreactor to be controlled. However, since the mini-bioreactors aren’t equipped with a temperature probe the temperature of the medium inside the reactor cannot be precisely set. Hence, it is necessary to verify and adjust the temperature manually. For the temperature measurement the same waterproof thermometer (Traceable, Water-Proof Thermometer).
The data acquisition and processing was provided by LabView software.
3.1
Temperature Sensor
To measure the lifetime of the temperature sensor with time domain technique the fluorescence spectrophotometer was used.
The excitation and emission are set at 400 nm and 613 nm respectively. These conditions were used because the wavelengths are about to maximum EUTDAP emission and excitation wavelengths as shown in chapter 1, figure 7.
After some tests and subsequent adjustments, other parameters were set. One very important parameter in the measurement of the lifetime is the delay time used. A delay time of 6 µs was chosen because within this time the luminescence of the oxygen sensor being combined later with the temperature sensor will be completely decayed. Due to this delay, the results obtained stems solelyfrom the temperature sensor dye. The other selected parameters are presented in table 1.
The measurements were carried out for the temperature range between 10 ºC and 70 ºC, with an interval of 5 ºC.
Table 1 - Fluorescence spectrophotometer parameter used in the lifetime measurements of temperature sensor.
Parameter Value / state
Delay time (ms) 0.006 Gate time (ms) 1.000 Nº of flashes 1 Exc. wavelength (nm) 400 Emi. wavelength (nm) 613 Ex. Slit (nm) 5 Em. Slit (nm) 5
Total decay time (ms) 1
Nº of cycles 20
Excitation Filter Auto
Emission filter Open
PMT voltage (V) 740
To obtain the graphics of the emission and the excitation of the temperature sensor was used the same fluorometer but was selected other parameters (table 2 and 3).
Table 2 - Fluorescence spectrophotometer parameter used in the emission measurement of temperature sensor.
Parameter Value / state
Data mode Fluorescence
X mode Wavelength (nm) Excitation (nm) 400 Star (nm) 410 Stop (nm) 700 Ex. Slit (nm) 5 Em. Slit (nm) 5
Scan control Medium
Excitation Filter Auto
Emission filter Open
Table 3 - Fluorescence spectrophotometer parameter used in the excitation measurement of temperature sensor.
Parameter Value / state
Data mode Fluorescence
X mode Wavelength (nm) Emission (nm) 613 Star (nm) 300 Stop (nm) 500 Ex. Slit (nm) 5 Em. Slit (nm) 5
Scan control Medium
Excitation Filter Auto
Emission filter Open
PMT voltage (V) 600
3.1.1 Temperature sensor preparation
For the fabrication of the temperature membranes was used polymethylmethacrylate (PMMA) plates were used as support (1.2 x 4 cm). Then it is coated with a thin layer of PMMA incorporating the temperature sensing luminophore EUTDAP.
The coating process is carried out by the spincoating technique (Spin-Coater KW-4A, Chemat Technology). For this process a solution containing approximately 0.5g PMMA dissolved in 30 mL of chloroform was used. The EUTDAP is dissolved in this solution with concentration 1mg/mL. A sufficient amount of this solution is pasted on the supporting PMMA plate, which is then spin coated at a velocity of 2000 rpm. The prepared plate (figure 15) is then allowed to dry in the incubator at 40°C overnight.
Figure 15 – Temperature Sensor.
When the temperature dependency was studied, it was discovered that the lifetime decreased over the time. The cause of this change is probably water that penetrates the PMMA
membrane. Water molecules might interact with the europium complex and destabilize the original complex, so luminescence properties will be altered.
To resolve this problem one additional protecting PAN membrane was added on top of the temperature sensing layer (figure 16). This membrane was prepared by spincoating a PAN/DMF concentrated solution directly on top the temperature sensing membrane. To dissolve this solution it is necessary to provide heat for some hours (at about 50ºC). PAN was chosen
because the permeability for water and oxygen
is extremely low (J. Brandrup).
Figure 16 – Temperature Sensor with PAN membrane.
3.1.2 Experimental procedure
1 – Turn on the fluorometer some minutes before using to heat lamp so the light is then constant;
2 – Insert the plate with temperature sensor in the quartz cuvette and fill with deionized water;
3 – Insert the cuvette in fluorometer in correct position (sensor dye facing to the lamp); 4 – Turn on the thermostatic system;
5 – Measure the temperature inside of the cuvette with a waterproof thermometer;
6 – When the temperature was stabilized close the instrument and start the measurements;
3.2
Oxygen Sensor
To measure the lifetime of the oxygen sensor with the method of frequency domain the mini-bioreactor system was used.
To measure the emission and the excitation of the oxygen sensor the fluorescence spectrophotometer was used. The instrument operated at 470 nm and 597 nm for excitation and emission respectively. This conditions were used because the wavelengths are about to maximum RUDPP emission and excitation wavelengths as show in chapter 1, figure 10.
In the fluorometer, after some tests and subsequent adjustments were made other parameters were selected. These parameters are presented in table 4 and 5.
Table 4 - Fluorescence spectrophotometer parameter used in the emission measurement of oxygen sensor.
Parameter Value / state
Data mode Fluorescence
X mode Wavelength (nm) Excitation (nm) 470 Star (nm) 480 Stop (nm) 700 Ex. Slit (nm) 5 Em. Slit (nm) 5
Scan control Medium
Excitation Filter Auto
Emission filter Open
PMT voltage (V) 600
Again, in all the experiments were made several times until have the confirmation of the values.
Measurements for the range of temperatures between 10 ºC and 70 ºC, with an increase of 5 ºC were made.
Table 5 - Fluorescence spectrophotometer parameter used in the excitation measurement of oxygen sensor.
Parameter Value / state
Data mode Fluorescence
X mode Wavelength (nm) Emission (nm) 597 Star (nm) 350 Stop (nm) 550 Ex. Slit (nm) 5 Em. Slit (nm) 5
Scan control Medium
Excitation Filter Auto
Emission filter Open
PMT voltage (V) 600
3.2.1 Oxygen sensor preparation
For the fabrication of the oxygen membranes polyacrylonitrile plates were used as a support. The support is coated with a thin layer of silicone and toluene with the oxygen sensing RUDPP. The silicone used in this work is poly-dimethyl-siloxane (PDMS): its monomer consists of two methyl groups.
The plates of polyacrylonitrile are hydrophobics and the silicone too as was explained before. To facilitate the adhesion of the silicone at the PAN the sample is plasma treated for 2 minutes.
The coating process is carried out by the spincoating technique. For this process a solution containing approximately 5g of silicone and 200mg RUDPP dissolved in 5mL of toluene is prepared.
A sufficient amount of this solution is pasted on the supporting polyacrylonitrile, which is then spin coated at a velocity of 150 rpm (figure 17). The prepared plate is then allowed to dry overnight at room temperature. In order to temper the sensor’s sensitivity the plate was exposed to light from a conventional fluorescence light tube for approximately 12 hours.
Figure 17 - Oxygen Sensor. 3.2.2 Experimental procedure
3.2.2.1 Lifetime determination
1 – Attach to bottom of a mini-bioreactor the oxygen sensor and fill reactor with deionized water;
2 – Position the sensing optoelectronics under the reactor; 3 – Turn on the thermostatic system;
4 – Measure the temperature inside the mini-bioreactor with a waterproof thermometer; 5 – When the temperature was stabilized start the measurement;
6 – Repeat this procedure for all the concentrations.
3.2.2.2 Emission and excitation determination
1 – Turn on the fluoremeter some minutes before using to heat lamp so the light is then constant;
2 – Insert the plate with oxygen sensor in the quartz cuvette and fill with deionized water; 3 – Insert the cuvette in fluorometer in correct position (sensor dye facing to the lamp); 4 – Turn on the thermostatic system;
5 – Measure the temperature inside the cuvette with a waterproof thermometer;
6 – When the temperature was stabilized close the instrument and start the measurements; 7 – Repeat this procedure for all the experiments.
3.3
Dual sensor
In the dual sensor the lifetime measurements of temperature sensor part and oxygen sensor part will be made separately. To measure the lifetime of the dual sensor is used the time and frequency domain.
First of all, to obtain the lifetime correspondent at the temperature sensor part was used the same method with same specifications of the temperature sensor (time domain). To obtain the lifetime correspondent at the oxygen sensor part was used the same method with same specifications of the oxygen sensor (frequency domain).
3.3.1 Dual sensor preparation
For the fabrication of the dual sensor, the temperature sensor was attached at the oxygen sensor with glue as is shown in figure 18.
5 Technical Description and Discussion of Results
5.1 Temperature Sensor
Temperature sensing plates were tested for their response to temperature. For this purpose the plate is introduced in a quartz cuvette filled with water. The cuvette is then placed in the spectrofluorimeter which has a built-in thermostating cuvette holder. The luminescence lifetime of the embedded luminophore is measured by the time domain method using the gated detection technique. In this technique the decaying process is measured directly. This process can be mathematically described by an exponential function.
(5)
In the equipment response data, intensity (a.u.) in function of time (ms), was doing one exponential adjustment (equation 6). This results was obtained using Origin Program (OriginLab).
(6)
where is the intensity, is the lifetime, is the time, is a constant and is the intensity for the time equal at zero.
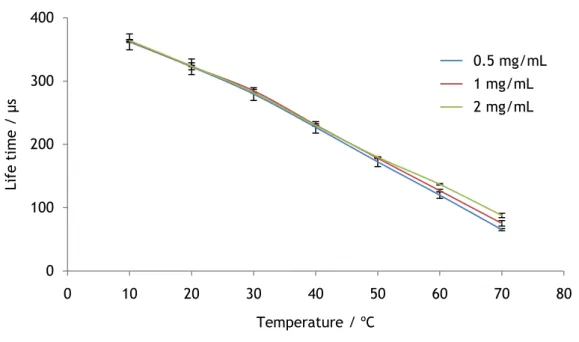
This study investigates whether differences in the EUTDAP concentration in the desired range between 0.5-2mg/mL have an impact on the lifetime of the luminophore. Probes with a dye concentration of 0.5, 1 and 2mg/mL were prepared and their lifetimes were measured at various temperatures between 10 and 70 ºC. Figure 19 shows the results of the investigation. It shows that all probes have very similar results below 50 ºC. The probe with the concentration of 2mg/mL has higher lifetime at 60 and 70 ºC. This might be the result of other effects as there is no obvious trend in the way the lifetime of the probes differs from one another.
Figure 19 - Response of the probes with different dye concentration to temperature.
The temperature dependence of EUTDAP is linear within at least 10 and 70°C. The lifetime decreases with the increase of the temperature. This phenomenon is caused by the increasing shift from luminescence to radiationless internal conversion (figure 20).
Figure 20 –Processes of absorption of light and its emission at low and high temperatures.
The study of the stability of the sensor layer revealed that the lifetime decreased over the time as shown in figure 21. The cause of this change is probably water that penetrates the PMMA membrane. Water molecules might interact with the europium complex and destabilize
0 100 200 300 400 0 10 20 30 40 50 60 70 80 Li fe ti me / µ s Temperature / ºC 0.5 mg 1 mg 2 mg 0.5 mg/mL 1 mg/mL 2 mg/mL
the original complex, so that its luminescence properties were altered. To resolve this problem one additional protecting PAN membrane was added on top of the temperature sensing layer.
Figure 21 shows that there is apparently a steady drift towards lower lifetime with increasing exposure to water although the absolute change is insignificant. With the PAN protecting layer the stability of the temperature sensor when exposed to water was much better than without membrane. With this membrane the lifetime decreasing was approximately 33 times/hour lower.
As described earlier, the PAN membrane limits the penetration of water into the sensing membrane. Since water molecules can complexate the Europium ion and destroy the luminescent complex, the addition of the PAN membrane increase the long term stability.
The lifetime in presence of the PAN membrane destroy part of the dye because of the DMF presence in the membrane solution.
Figure 21 – Response of the temperature probe at 25 ºC over a period of several hours in contact with water. The luminophore concentration of the probe is 1 mg/mL.
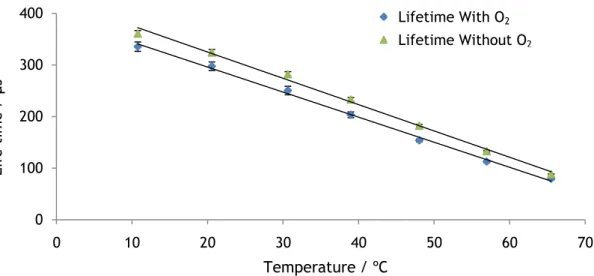
To investigate the effect of oxygen on the temperature sensor its lifetime was measured in presence and absence of oxygen. For the study of the lifetime in absence of oxygen, the cuvette containing the temperature probe is deoxygenated by sonification and wash with nitrogen flow for 1.5 hour. The luminophore concentration of the probe is 1 mg/mL.
When the EUTDAP is in the excited state it interacts to some extent with oxygen which leads to an energy transfer to the oxygen molecule. This process is called quenching. Due to
y = -0,0089x + 291,96 y = -0,2999x + 297 270 280 290 300 310 0 1 2 3 4 5 6 7 8 9 10 Li fe ti me / µ s Time / h With Membrane Without Membrane
this quenching process the lifetime of EUTDAP decreases in presence of oxygen as can be seen in figure 22.
Figure 22 – Response of the temperature probe to various temperatures in presence and absence of O2. The luminophore concentration of the probe is 1 mg/mL.
The temperature dependence of the lifetime in presence of oxygen is linear. It is well described by the following empirical equation.
(7)
where and are empirical coefficients with values and ,
respectively.
The temperature dependence of the lifetime in absence of oxygen is also linear too and can be well described by equation 8.
(Equation 8)
Where and are empirical coefficients with values and µs,
respectively.
is the lifetime in µs and is the temperature in ºC. The of equation 7 is 0.997 and of the equation 8 is 0.998.
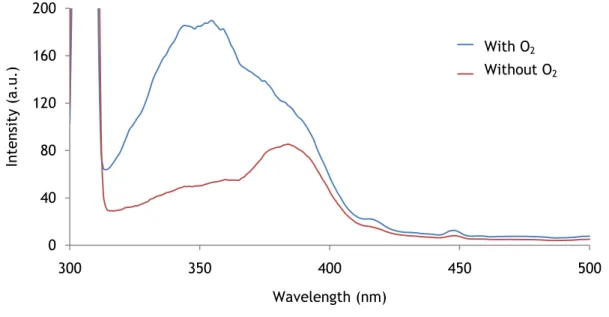
The excitation of EUTDAP is found in the UV region. The luminescence intensity is highly temperature dependent and decreases significantly at higher temperatures (Borisov and Wolfbeis 2006). As figure 23 shows, the intensity decreases with the increase of the
0 100 200 300 400 0 10 20 30 40 50 60 70 Lif e time / µs Temperature / ºC
Life Time With O2 Life Time Without O2
Lifetime With O2
temperature when the EUTDAP complex is excited in presence of oxygen, caused by the increasing shift from luminescence to radiationless internal conversion.
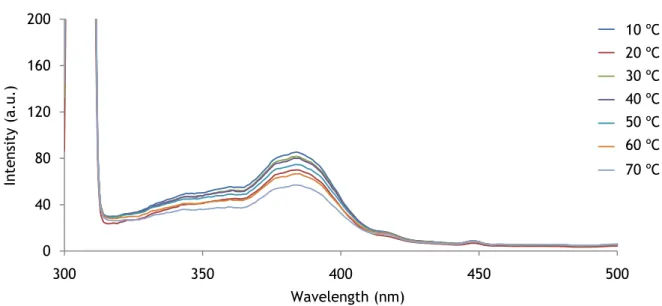
The maximum excitation was found to occur at about 353 nm.
Figure 23 – Excitation spectra at various temperatures in presence of O2. The luminophore concentration of the probe is 1 mg/mL.
The excitation spectrum of EUTDAP in absence of oxygen was also investigated. Figure 24 shows that the wavelength decreases with the increase of the temperature.
However, the excitation maximum is found at about 384 nm.
Figure 24 – Excitation spectra at various temperatures in absence of O2. The luminophore concentration of the probe is 1 mg/mL. 0 40 80 120 160 200 300 350 400 450 500 In ten si ty (a .u .) Wavelength (nm) 10 20 30 40 50 60 70 0 40 80 120 160 200 300 350 400 450 500 In te ns ity (a .u .) Wavelength (nm) 10 20 30 40 50 60 70 10 ºC 20 ºC 30 ºC 40 ºC 50 ºC 60 ºC 70 ºC 10 ºC 20 ºC 30 ºC 40 ºC 50 ºC 60 ºC 70 ºC
The maximum shift in the excitation spectrum in presence of oxygen and in the absence of oxygen can be explained as follows: the excitation spectrum of EUTDAP was formed by at least two absorption bands belonging to the two different ligands amino-phenanthroline and the diketonate ligand. Since absorption of phenanthroline is influenced by oxygen, its absorption band decreases with the presence of oxygen. In the other hand, in the absence of oxygen this absorption band should be high.
One unexplainable phenomenon is the intensity of the excitation in absence of oxygen at 20 ºC does not decrease in the same way of as the others curves (figure 25). The intensity at 20 ºC is lower than 30, 40 and 50ºC.
Figure 25 – Excitation spectra in presence and absence of O2 at 10 ºC. The luminophore concentration of the probe is 1 mg/mL.
Here the intensity in absence of oxygen was lower than in presence of oxygen. These results are unlike the expected because with the quenching processes it is expected that lifetime decreases. One possible explanation might be that due to the shortening of the lifetime caused by oxygen the luminophore can be excited more often within a given period of time. As more cycles of excitation and emission take place, the overall excitation in the presence of oxygen is effectively higher.
Again, the intensity as well as the lifetime of EUTDAP decreases with the increase of the temperature (figure 26) due to the energy loss caused by radiationless internal conversion.
0 40 80 120 160 200 300 350 400 450 500 In ten si ty (a .u .) Wavelength (nm) with o2 without o2 With O2 Without O2
Figure 26 – Intensity of EUTDAP dye after the excitation in function of the temperature in presence and absence of oxygen, 1 mg/mL.
At high temperatures the intensity differences are smaller. This is because the oxygen concentration at low temperatures is highest (as equation 9 explain) and consequently causes the strongest quenching effect. At low temperatures the partial pressure of water is low, hence the oxygen concentration is high. On the other hand at 100 ºC, due to vaporization the water vapor pressure reaches the total pressure. Therefore all other gas components are pushed out of the system. Hence, when temperature increases the partial oxygen pressure will approaches zero.
(Equation 9)
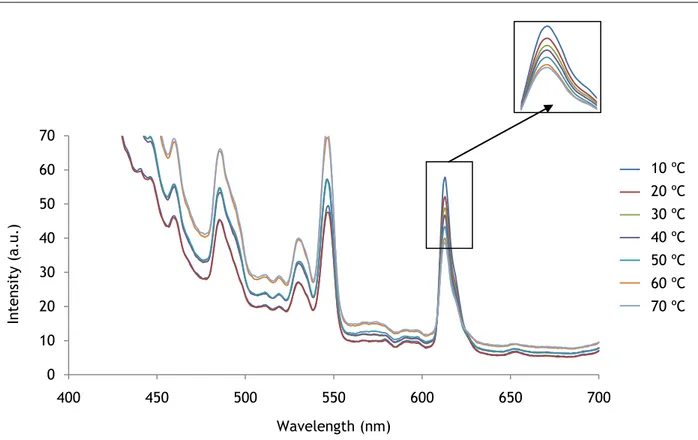
The intensity of the luminescence emission at 613nm was studied. This emission peak is caused by 5D
0 -7F2 transition. Figure 27 shows that when the temperature increase the intensity
decreases. 0 40 80 120 160 200 0 10 20 30 40 50 60 70 80 In ten si ty ( a . u. ) Temperature / ºC With O2 Without O2 With O2 Without O2
Figure 27 – Emission spectra to various temperatures in presence of O2. The luminophore concentration of the probe is 1 mg/mL.
Again, the emission of EUTDAP complex in absence of oxygen was measured. In figure 28 one can see that the emission drops with the increase of the temperature.
Figure 28 – Emission spectra to various temperatures in absence of O2. The luminophore concentration of the probe is 1 mg/mL. 0 10 20 30 40 50 60 70 400 450 500 550 600 650 700 In ten si ty (a .u .) Wavelength (nm) 10 20 30 40 50 60 70 0 10 20 30 40 50 60 70 400 450 500 550 600 650 700 In ten si ty (a .u .) Wavelength (nm) 10 20 30 40 50 60 70 10 ºC 20 ºC 30 ºC 40 ºC 50 ºC 60 ºC 70 ºC 10 ºC 20 ºC 30 ºC 40 ºC 50 ºC 60 ºC 70 ºC
Analog to the excitation spectrum in absence of oxygen, at 20 ºC the intensity of emission does not decrease in the same way as the others curves. The intensity at 20 ºC is lower than at 30, 40 and 50ºC.
Also the intensity of emission in presence of oxygen is higher than in absence of oxygen. The same possible explanation is that might be that due to the shortening of the lifetime caused by oxygen the luminophore can be excited more often within a given period of time. As more cycles of excitation and emission take place, the overall emission in the presence of oxygen is effectively higher.
Figure 29 – Emission in presence and absence of O2 at 10 ºC. The luminophore concentration of the probe is 1 mg/mL.
In accordance to in the excitation spectrum, the intensity of EUTDAP decreases with the increase of the temperature (figure 30) because at higher temperature the radiationless internal conversion is increasing by favored.
Figure 30 – Intensity of EUTDAP dye after the emission in function of the temperature in presence and absence of oxygen, 1 mg/mL. 0 10 20 30 40 50 60 70 600 605 610 615 620 625 630 In ten si ty (a .u .) Wavelength (nm) with o2 without o2 0 10 20 30 40 50 60 70 0 10 20 30 40 50 60 70 80 In ten si ty (a . u. ) Temperature / ºC With O2 Without O2 With O2 Without O2 With O2 Without O2
Once again the difference of intensity is more significant at low temperatures. The reason for this phenomenon happen is because the oxygen concentration at high temperatures is the lowest and consequently causes a minor quenching effect, approaching the intensity in the absence of oxygen.
Bleaching effect is the progressive fading of the emission intensity of the dye. High intensity excitation light often leads to irreversible decomposition of the fluorescent molecules apparent as fading of the emitted fluorescent light. The bleaching on the luminophore was investigated. The temperature sensing membrane containing the luminophore was exposed to long term continuous UV light radiation. Figure 31 shows that the emission intensity decreases with higher duration of exposure to UV light.
Figure 31 – Intensity of the luminophore as function of time, at deferent times of continuous exposition to blue light.
The impact of long term UV light exposure to the luminophore excitation was studied. The excitation wavelength was found at about 353 nm.
The excitation intensity decreases with longer exposure to UV light (figure 32) as the complex is photochemically modified to some other substances leading to the reduction of EUTDAP concentration in the probe. Hence, both emission and excitation intensity decrease with longer exposure.
0 10 20 30 40 50 60 70 80 0 200 400 600 800 1000 In ten si ty (a .u .) Time / µs 0 20 30 40 50 60 80 100 0 min 20 min 30 min 40 min 50 min 60 min 80 min 100 min
Figure 32 - Excitation spectra at various times in UV light exposition in presence of O2. The luminophore concentration of the probe is 1 mg/mL and stay at room temperature.
The study of EUTDAP exposure to UV radiation impact reveals that the intensity drops with longer UV light exposure (figure 33).
Figure 33 - Emission spectrum at various exposure duration to UV light in presence of O2 at room temperature. The luminophore concentration of the probe is 1 mg/mL.
0 200 400 600 800 1000 300 350 400 450 500 In ten si ty (a .u .) Wavelength (nm) 0 20 30 40 50 60 80 100 0 20 40 60 80 100 120 140 400 450 500 550 600 650 700 In ten si ty (a .u .) Wavelength (nm) 0 10 20 30 40 50 60 80 100 0 min 20 min 30 min 40 min 50 min 60 min 80 min 100 min 0 min 20 min 30 min 40 min 50 min 60 min 80 min 100 min
5.2
Oxygen Sensor
The previously prepared oxygen sensing patch was attached to the bottom of a mini-bioreactor filled with water. The sensing optoelectronics is positioned underneath the reactor. The measured luminescence of this probe is very low since a major part of the luminescence light scatters into water due to the similar refractive indices of silicone and water. This phenomenon is described in figure 34. Due to similar refractive indices of silicone and water, most of the luminescence light is not reflected at the interface silicone/water, but only refracted. Hence this part of the luminescence is lost for the sensor that is located underneath the silicone layer.
Figure 34 – Reflection and refraction at the interface between air and water.
To minimize the loss of the luminescence light a reflective layer made of filter paper is used. This paper filter is attached at the sensor layer immediately, pasted as a silicone membrane after spincoating the oxygen sensor in the support.
The phase shift caused by the decay time is measured by the sensor. The luminophore was excited with modulated light. The modulation frequency is set at 74kHz. The phase shift of the resulting emission is related to the decay time by the following equation.
= tan( ) (10)Where,
, with
The lifetime, , is in seconds and the angle, , in radians.
Figure 36 reveals that without a reflective layer on top of the sensing membrane needs to provoke measurement errors. Measurement in the presence and absence of oxygen shows that the probe without the filter paper as the reflective shield measures consistently lower lifetime then with the reflective shield. In the case of oxygen presence, the lifetime at high temperatures is practically zero.
Figure 36 – Response of the oxygen probe to various temperature. The luminophore concentration of the probe is 20 mg/mL.
The experiment shows that the lifetime of RUDPP decreases with increasing temperature. As described before, this phenomenon is caused by the increasing shift from luminescence to radiationless internal conversion processes and the increasing kinetic quenching rate by oxygen. The lifetime in absence of oxygen for low temperatures is close to 6 µs as described in literature (Kocincova et al. 2007).
0 1 2 3 4 5 6 0 10 20 30 40 50 60 70 80 Li fe ti m e / µs Temperature / ºC
with O2 and with filter without O2 and with filter with O2 and without filter without O2 and without filter
With O2 + Filter
Without O2 + Filter
With O2
Bleaching effect on the luminophore was investigated. Over time the exposure to UV light decrease the lifetime of the probe because the ruthenium complex is photochemically altered (figure 37). This experiment was done at room temperature and with oxygen presence.
Figure 37 – Lifetime of the luminophore in function of the time, at different times of continuous exposition to blue light.
Oxygen sensor dye excitation, before exposition at UV light, was studied. The wavelength of excitation was expected to be about 470 nm. However, the results were very different, as is possible to observe in figure 38.
Figure 38 illustrates one peak at 437 nm. This peak can be explained with the glue used to attach the sensor on the PMMA plate.
Figure 38 – Excitation spectrum of the probe at UV light exposure duration in presence of O2 at room temperature.
The luminescence intensity decreases with the increase of the exposure time to UV light, as expected.
The emission spectrum of the RUDPP dye before the exposure to UV light shows an emission peak at 626 nm, more 29 nm as expected.
y = 2E-07x2- 0,0002x + 0,7148 R² = 0,9791 0,65 0,66 0,67 0,68 0,69 0,70 0,71 0,72 0,73 0 100 200 300 400 500 Li fe ti me / µ s Time / h 0 50 100 150 200 250 300 350 350 400 450 500 550 In ten si ty (a .u .) Wavelength (nm) 20 50 410 620 20 min 50 min 410 min 620 min
Figure 39 – Emission spectrum of the probe at various times in UV light exposition in presence of O2 at room temperature.
5.3
Dual Sensor
The prepared dual sensing plates are tested for their response to temperature. For this purpose the plate is positioned in a quartz cuvette filled with water. The cuvette is then placed in a spectrofluorimeter (Varian Eclipse) which has a built-in thermostating cuvette holder. The luminescence lifetime of the embedded luminophore is measured by the time domain method using the gated detection technique. Figure 40 compares the lifetime of two different probes at different temperatures. One of the probes contains only the EUTDAP dye, while the other is the dual sensing probe consisting of RUDPP and EUTDAP. The results for both probes are practically the same, which proves that the presence of the short lived RUDPP dye has not impact on the lifetime of EUTDAP.
Figure 40 – Response of the temperature probe to various temperature in presence of O2.
0 50 100 150 200 250 300 350 400 450 500 480 535 590 645 700 In ten si ty (a .u .) Wavelength (nm) 0 10 30 50 90 140 620 0 50 100 150 200 250 300 350 400 0 10 20 30 40 50 60 70 Li fe ti me / µ s Temperature / ºC Temperature Sensor Dual Sensor 0 min 10 min 30 min 90 min 140 min 620 min 410 min 620 min Temperature Sensor Dual Sensor
The temperature dependence of the lifetime in dual sensor is well described by the following empirical equation.
(11)
where and are empirical coefficients with values and µs,
respectively.
By transforming equation 11, temperature can be expressed as
(12)
where is the lifetime in µs and is the temperature in ºC. The is 0.994.
The excitation spectrum of the dual sensing probe was studied too. The excitation peak was found at 389 nm that corresponds to EUTDAP. However, at around 450 nm a small peak corresponding to RUDPP was observed, but it is almost overlapped by the EUTDAP peak. Figure 41 shows that when the temperature increases the intensity decreases.
Figure 41 - Excitation spectra to various temperatures exposition in presence of O2 at room temperature.
The impact of the temperature on the emission peak at 613nm was investigated (figure 42). EUTDAP emission peak completely overlaps RUDPP emission peak.
0 200 400 600 800 1000 1200 300 350 400 450 500 550 Inten si ty (a .u. ) Wavelength (nm) 10 20 30 40 50 60 70 10 ºC 20 ºC 30 ºC 40 ºC 50 ºC 60 ºC 70 ºC