Molecular mobility of
n
-ethylene glycol
dimethacrylate glass formers upon free
radical polymerization
María Teresa Viciosa Plaza
(Graduated in Physics)
Dissertation presented to obtain a PhD. Degree in Chemical Physics
Supervisors: Dra. Madalena Dionísio Andrade (U.N.L. – Portugal)
Dr. José Luis Gómez Ribelles (U.T.V. – Spain)
Examiners:
Dr. Manuel Luís de Magalhães Nunes da Ponte
Dr. José Narciso Marat Mendes
Dr. Joaquim José de Azevedo Moura Ramos
Dr. João Filipe Colardelle Luz Mano
Dr. Simone Capaccioli
Ao António,
aos meus pais,
“Tudo o que se acaba e não contenta Deus, é nada e menos que nada.”
Sta. Teresa de Ávila
“Bem podem chegar ao cume da vossa actividade profissional, alcançar os triunfos
mais retumbantes, como fruto da livre iniciativa com que exercem as actividades
temporais; mas se abandonarem o sentido sobrenatural que tem de presidir todo o
nosso trabalho humano, enganaram-se lamentavelmente no caminho.”
i
R
EPORTS BYE
XTERNAL ASSESSORSPh.D. THESIS EVALUATION FORM
Candidate:
María Teresa Viciosa Plaza‘’Molecular mobility of n-ethylene glycol dimethacrylate glass formers upon free
radical polymerization.’’ by María Teresa Viciosa Plaza,
Faculdade de Ciencias e Tecnologia da Universidad Nova de Lisboa, Portugal.
Report by External Assessor, Professor Graham Williams, Emeritus Professor of Chemistry, University of Wales, Swansea SA2 8ES, United Kingdom.
1. Quality of the written document in terms of its organization, structure and clarity
The research contained in this thesis is of very high quality and makes a substantial contribution to knowledge in the field of molecular mobility in monomeric and polymeric glass-forming materials. The thesis reads extremely well and contains excellent diagrams and figures. It is well-organised and allows the reader to assimilate the aims and achievements of the thesis, whose content ranges over several inter-related topics in the physical chemistry of materials, polymer science and dielectrics science. The descriptions and molecular interpretations of these complex, wide-ranging investigations are made with clarity, originality of thought and with an authority that clearly shows the candidate has an exceptional command and understanding of her results and the subject under study.
2. Innovative character of the work developed
The thesis is concerned with studies, using modern broadband dielectric spectroscopy (BDS) and scanning calorimetric (DSC) techniques, of molecular mobility in monomeric dimethacrylates (DMA) before, during and after their bulk free-radical polymerizations. In addition, the crystallization behaviour of a dimethacrylate monomer is followed using real-time BDS.
ii
3. Scientific quality of the work produced and its scientific impact
The molecular dielectric relaxation processes in these materials have been studied over an exceptionally wide range of frequency (10-1 to 10+6 Hz) and sample temperature. Also dielectric studies have been made of systems during polymerization and bulk-crystallization. This is made possible using (i) the modern dielectric equipment (Novocontrol Alpha-N Analyzer) in the laboratory of Professor Dionísio. And (ii) two differential scanning calorimeters (DSC), one being a temperature-modulated machine that allowed both thermochemical and thermodynamic information to be obtained as a material underwent both chemical reactions (bulk thermopolymerization) and an apparent phase-change from liquid to glass (and vice-versa) The samples were in the form of thin films (for dielectric) and drops (for calorimetry), so information on the molecular dynamics, thermochemistry and thermodynamic states of these materials could be obtained with high precision for small samples, avoiding uncertainties due to temperature gradients within bulk samples.
All data were processed using modern numerical-fitting procedures available as software with the BDS and DSC instruments. Extensive use was made of deconvolution procedures to separate complex dielectric spectra into component dynamical processes.
The multiple relaxation processes in the monomers, reacting systems and product network polymers were captured by the BDS studies and quantified systematic changes in the apparent dynamic glass-transition ( -process) and local motional processes ( , ) as monomers transformed into a network-polymer. The DSC data, obtained in parallel, describe and quantify the courses of the polymerizations in each case (including the Tromsdorff autoacceleration/heating effect) and also show, in the case of methyl acrylate/dimethacrylate copolymerizations, how the glass transition region of the copolymer broadens dramatically as the dimethacrylate (DM) component is raised – this is complemented in the BDS data, which show an increasing breadth of the dielectric - process as the DM component is raised.
The candidate has obtained dielectric and DSC data of high quality for monomers, reacting systems and the product network-polymers. These have been processed to reveal quantitative details of the multiple component relaxation processes in each case. Through determinations of the real-time changes in relaxation strengths, frequency-temperature locations and shapes of these processes during polymerization, the candidate has obtained a clear understanding of how the dynamics of the monomeric species (seen as , and dielectric processes) change systematically as the system transforms to a solid network polymer for each monomer. In the experiments concerning the crystallization of the monomer EGDMA, both isothermal and cold crystallization methods were studied by the dielectric method. The Avrami exponents for the crystallization kinetics thus determined were compared with those predicted by theories of nucleation-assisted-crystallization.
4. Global comment (use as many pages as necessary)
It is appropriate at this point to summarize my overall assessment of this thesis.
iii
physical chemistry/chemical physics/polymer science (molecular dipole relaxation processes, thermodynamics of amorphous systems, glass transition phenomena) and dielectric/electrical and scanning calorimetric measurements of glass-forming materials and their interpretation in terms of molecular processes.
This study of the behaviour of dimethacrylate monomers and their polymerizing systems involved many experimental variables (including different monomers, different polymerization conditions, presence/absence of oxygen; dielectric measuring frequencies, sample temperatures; DSC heating/cooling rates & modulation conditions; ….). The studies were made systematically and with great attention being paid to detail. Hence reproducible results of the highest quality were obtained
Chapter 1 covers the theoretical background relevant to the thesis i.e. glass-transition, structural relaxation, crystallization, multiple relaxation processes in polymers and glass-formers, dielectric relaxation. It is a substantial yet concise, account that covers a wealth of information in its 64 pages and has a extensive list of up-to-date references. Chapter 2 summarizes the dielectric (BDS) and DSC techniques employed in the thesis. Chapter 3 presents BDS and DSC data for three dimethacrylate monomers, which demonstrate the quality of data now obtainable using modern dielectric instrumentation (figs.3.4, 3.5, 3.17) and DSC (figs.3.12, 3.13), while Chapter 4 investigates the real-time BDS and DSC studies of triEGDMA for samples in N2 and in air – where it is shown
how O2 in the latter case has a large inhibiting effect on the kinetics of the radical
polymerization. Chapters 5 and 6 report BDS and DSC studies of DEGDMDA, TrEGDMA, TeEGDMA and TrEGDMA/methylacrylate copolymers, while in Chapter 7 BDS and DSC are used to determine the crystallization kinetics of EGDMA monomer under isothermal and ‘’cold crystallization conditions.
As mentioned above, the dielectric data revealed (i) multiple relaxation regions in both the monomers and polymerizing systems and (ii) how they changed in real-time during the polymerizations. Each relaxation region covers broad frequency ranges so the deconvolution of total dielectric spectra into component , and processes at each measurement temperature and each time of polymerization required broadband data of high quality and much skill by the candidate in the implementation of the deconvolution procedures. All the BDS and DSC results have been analyzed using contemporary theories of :
(i) mechanisms for local and global motions of chains and how these change as a network-polymer is formed.
(ii) the dynamical nature of apparent glass transitions (Tg) in monomers and network polymers, the Angell concept of the fragility of glasses, the influence of heterogeneity on the breadth of Tg in a network polymer.
(iii) nucleation-assisted crystallization of glass-formers (Chapter 7).
The thesis work has led, at this time, to six substantial papers in leading journals and there are a further nine publications that include Ms Viciosa as a coauthor on work that developed from the thesis.
iv
The candidate is to be congratulated on the many fine achievements in this thesis.
My Global evaluation of the thesis is ‘’Excellent’’.
I include below, as an Annexe, some comments that occurred to me on reading through the thesis.
Annexe
Chapter1 Excellent introduction to the nature of the glass-transition and the apparent glass transition temperature Tg.
p.5, 4 up, the dipole moment acts as the molecular probe, thus dielectric relaxation is related to molecular structure and its dynamics.
p.21-22, last lines, the nature of , and processes are also considered in refs .42 and 39 (by G Williams) and were defined originally by Williams (see G. Williams Adv. Polymer Science 1979, 33, 59-92).
p.28, for recent use of BDS and real-time BDS, and the Avrami eqn. for crystallization in polymers, see review by G. Floudas Ch.8 in ref.42, especially the papers by TA Ezquerra (refs.82 and 83); see also G. Williams in Adv. Polymer Science 1979, 33, 59-92 for real-time BDS studies of the crystallization of polyethylene terephthalate. For real-time BDS studies of crystallization of low molar mass glass-formers see G Williams et al (i) Faraday Transactions, 1998, 94, 387 and (ii) J Phys Chem B, 1999, 103, 4197.
p.34-40 Clear account of the essentials of free-radical bulk polymerizations.
p.40-59. Good account of basic dielectric theory. I would have wished to see more on the role of molecular dipole moments in the dielectric relaxation theory.
Chapter 2, p.71-86, succint but adequate account of the BDS and DSC instruments used plus theory of complex heat capacity.
Chapter 3, excellent dielectric data for three monomers, as typified by figs.3.4 and 3.17. Deconvolution reveals three processes, fig.3.5, and good discussion of their origins. The KWW and HN functions give different loss contours so the Colmonero theory can only be approximate, as is found in table 3.1.
A Comment. Compare Tables 3.2 (BDS) and 3.5 (DSC). As found in other studies there are large differences between the {E,m} results of these techniques for the -process in glass-formers. The apparent activation energies E and fragility values ‘’m’’ from DSC are about 0.5 of those from BDS for the same process. The reason is as follows.
Values from DSC are obtained using eqn.3.5, which only applies to a single relaxation time process. For -relaxations, plots of the observable (dielectric loss, specific heat) vs. log f/Hz or (1/T) are broadened by the apparent distribution of relaxation times. The variable ( )becomes ( ) in those cases. Thus log becomes log( ) = log +
log . For temperature variations, as in the DSC scanning experiments,
log = log 0 + E/RT ... (1)
so in eqn.3.5 we replace H* by E. Since is about 0.5 this has the effect of doubling the E and m values in table 3.5, bringing them into agreement with those from BDS in table 3.2.
v
measurements by G Williams et al, Trans. Faraday Soc II, 1973, 69, 1785 for a glass-former and J van Turnhout ‘Thermally Stimulated Discharge of Polymer Electrets’ p.72.
This analysis may be useful for future work.
Chapter 4. Excellent account of BDS and DSC behaviour during reactions and hence information obtained on different factors affecting the polymerizations.
p.126, these DSC traces show how complex the reaction kinetics become with variation in tpolym and with the presence/absence of O2 (fig.4.8). Also the modulation amplitude
affects the kinetics in a complicated way (fig.4.7).
The large apparent ionic conductivities are likely to be due to small amounts of ionic impurities plus initiator in the samples. Nevertheless, the BDS data presented as complex modulus M* provides evidence of a step change in the structure of the polymerizing systems (figs.4.12 and 4.13) so theis use of BDS may have useful applications in monitoring bulk polymerizations in practical systems.
A comment regarding the possibility of phase-separation during these polymerizations. It might be useful to monitor, in parallel, the intensity of scattered light from systems undergoing these reactions.
Chapter 5, excellent description of a highly-detailed and searching study by BDS and DSC of changes in mobility when the three monomers are polymerized. Multiple relaxations are resolved quantitatively and the BDS signature of monomers is detected, and characterized, in the network polymers. Outstanding results (e.g. figs.5.13 and table 5.3).
Chapter 6. Again a wealth of data of high quality (e.g. fig.6.1) for a series of dimethacrylate/methyl acrylate copolymers made as a part of this thesis. Multiple relaxation regions are extracted from the overall BDS curves and their dielectric parameters obtained. The marked shift in the position of the -peaks to higher temperatures as the dimethacrylate (DMA) content is raised (see the relaxation map (fig.6.6)) reflects the lower local mobility of crosslinked DMA units. The data show that the dielectric -process in the copolymers is very broad (table 6.3). The DSC data, fig.6.7, shows how Tg increases as DMA content is raised and, significantly, how the transition region broadens remarkably for MA40 to MA10, in accord with the BDS data.
The candidate analyses these results in terms of changes in intra- and inter-molecular interactions in the copolymer networks.
Fig.6.7. The precision given to the values of Tg in fig.6.10 for materials MA40 to MA10 is, in my view, probably too high. In view of the very broad range for the Tg process (being at least 50 0C in fig.6.7) it appears that the definition of Tg needs re-examination for MA40 to MA10 and that comparison with the predictions of the Fox eqn. would need further consideration.
Chapter 7. For recent use of real-time BDS and Avrami eqn. for crystallization in polymers see review by G. Floudas Ch.8 in ref.42 and in low molar mass glass-formers by G Williams et al (i) Faraday Transactions, 1998, 94, 387 and (ii) J Phys Chem B, 1999, 103, 4197).
vi
Also the BDS spectra are able to recognise differences between crystallized samples, and this has been investigated in some detail. With several BDS loss regions being deconvoluted from the overall BDS spectra (e.g. fig.7.13), I found the account to be complicated and difficult to follow. The deconvolution of loss curves shown in fig.7.13 is a difficult task. At -800C I might have made the -process larger, thus lowering the strength of the ’ process. At -70 and -600C the curves are so broad that several difgferent fittings are possible, so error bounds were desirable on the fits obtained. At -400C two MWS curves are suggested, which is difficult to understand for this material. Regarding the ’ process, earlier preliminary BDS studies by Williams and Tidy (see G. Williams in Adv. Polymer Science 1979, 33, 59-92 ) and, later, more substantial BDS studies by TA Ezquerra for bulk polymers showed that as the strength of the process decreased during crystallization, a new process, the ’ process appeared, due to constrained -type motions within the growing spherulite polymer crystals. This may be of relevance to the Discussion on p.238 and 253 of the thesis for the present low molar mass glass-former.
There are some additional comments. (i) Add: the times of crystallization on the curves in fig.7.5. (ii) fig.7.15, include in the caption the name of the process (I think is the -process? (iii) it was not clear in the text why the melt-crystallized curve (open circles) was at significantly higher frequencies than the other curves.
On , the 9th day of December of 2007 .
Signature:
Professor Graham Williams BSc, PhD, DSc, CChem, FRSC, Emeritus Professor of Chemistry,
University of Wales, Swansea, Swansea SA2 8PP, United Kingdom. All correspondence should be sent to my home address :-
U N I V E R S I D A D P O L I T E C N I C A D F V A L E N C I A
EVALUATION FROM OF THE DRAFT OF THE Ph.D. THESIS WHICH DATA
ARE INDICATED IN THE FOLLOWNG
DEPARTMENT lN GHARGE: Chemistry Department, Faculdade de Ciéncias e Tecnologia, Universidade Nova de Lisboa
AUTHOR OF THE Ph.D. THESIS: María Teresa Viciosa Plaza
TfTLE OF THE Ph.D. THESIS: Molecular mobility of n-ethylene glycol di' methacrylate glass lormers upon frec radical polymerization
ADVISERS: Dra. Madalena Dionísio and Dr. José Luís Gómez Ribelles
Dr. José Ma Meseguer Dueñas, selected as external evaluator of the Ph.D. The-sis described before, provides the current evaluation form, upgraded with the speficications in the attachment and concluded as follows:
The Thesis is approved as it is.
Valéncia, the Sth of 2007 .
Specifications of the Evaluation Form
1 . Existence of concrete objectives and interest in the subject of the Thesis: The objectives are clearly specified in the Thesis. The study of the molecular mobility in the supercooled liquid and in the glassy state of low-molecular weight glass-formers and the effect on this mobility of the molecular weight, the polym-erization to form polymer networks and its vitrification, and the analysis of phase separation as polymerization progresses are objectives of great interest for the field, ambitious enough for a PhD Thesis
2. Existence of a methodologic strategy suited to the proposed objectives: The methodological approach ls based in the study of the properties ofa senes of n-ethylene glycol dimethacrylates, nEGDMA, using dielectric relaxation spec-troscopy, DSR and temperature modulated differential scanning calorimetry, TMDSC, is very adequate due to the broad frequency interval of the former that allows characerizing very precisely the relaxation processes originated by the different molecular groups, a serles of processes that most of the times overlaps in the frequecy and temperature domains. The high sens¡bil$ of TMDSC allows to study vitrification of the monomers during polymerizat¡on and correlate these data with fhe DRS resu/fs.
3. lnterest ofthe ach¡eved results and conclusions:
A very complete characterization of the dielectic relaxation spectra of the nEG-DMA series has been presented. The influenee of the length of the ethylenegly-col moiety on the main relaxation process assoc¡afed fo fñe g/ass transition of these low-molecular weight glass formers has been elucidated. The polyrneriza-t¡on reacpolyrneriza-t¡on of these monomers has been followed determining the temperature . depedence of the conversion at which the system vitrifies and ascribing the phe-nomenology found to a phase separation between a swollen polymer network and unreacted monomer. The mobility of the residual monomer has been charae-terized by DRS as polymer¡zat¡on progresseg as well as the secondary relaxa-tion of the growing polymer network. The effect of the presence of a simpler co-monomer, methyl acrylate, in the vecinity to the nEGDMA monomeic units has been studied analysing fhe DRS spectra of MA-nEGDMA random copolymers. On the other hand the crystall¡zation process of EGDMA has been followed using DRS and DSC showing characteristics of the molecular mob¡l¡ty ¡n sem¡crystal-line low-molecular weight substances.
4. Formal characteristics of the doctoral memory:
results-5. Observations (use as many as blank pages as necessary):
Finally I want to express my coryafuletibns to the author of this work, Ma Teresa Vioiosa, and to her superv,.sors Dra. Madalena Andrade Dionisio and Dr José L. Gómez Róe//eq for this excellent work.
& 'Global evaluation
n Exceltent
xi
R
ESUMOQuando um líquido evita a cristalização durante o arrefecimento, diz-se que entra no estado sobrearrefecido. Se a temperatura continuar a diminuir, o consequente aumento da viscosidade reflecte-se na mobilidade molecular de tal maneira que os tempos característicos se tornam da mesma ordem de grandeza que os tempos acessíveis experimentalmente. Se o arrefecimento continuar, o líquido altamente viscoso acaba por vitrificar, i.e. entra no estado vítreo onde apenas os movimentos locais são permitidos. Os monómeros da família n-etileno glicol dimetacrilato (n-EGDMA, para n = 1 até 4, que constituem o objecto deste estudo, facilmente evitam a cristalização, sendo pois bons candidatos para estudar a mobilidade molecular nos estados sobrearrefecido e vítreo. A Espectroscopia de Relaxação Dieléctrica (DRS) foi a técnica escolhida para obter informação detalhada sobre a sua dinâmica molecular (Capítulos 1 e 2).
A primeira parte deste trabalho consistiu na caracterização dieléctrica dos processos de relaxação existentes acima e abaixo da temperatura de transição vítrea (Tg), a qual aumenta com o aumento do peso molecular (Mw), sendo este resultado confirmado por Calorimetria Diferencial de Varrimento (DSC). No que respeita ao processo cooperativo α , associado à transição vítrea, e ao processo secundário β,
observa-se uma dependência com Mw, enquanto que o outro processo secundário, γ , aparenta ser independente deste factor (Capítulo 3).
Nos capítulos seguintes, foram levadas a cabo diferentes estratégias com o objectivo de clarificar os mecanismos que estão na origem destas duas relaxações secundárias (β e γ ), assim como conhecer a sua respectiva relação com a relaxação
principal (α ).
xii especial atenção às alterações de mobilidade do monómero ainda por reagir. Com as restrições impostas pela formação de ligações químicas, as relaxações α e β
detectadas no monómero tendem a desaparecer no novo polímero formado, enquanto que a relaxação γ se mantém quase inalterada. Os diferentes comportamentos que
aparecem durante a polimerização permitiram a atribuição da origem molecular dos processos secundários: o processo γ foi associado ao movimento twisting das unidades etileno glicol, enquanto que a rotação dos grupos carboxilo foi relacionada com a relaxação β (Capítulo 5).
No que respeita ao próprio polímero, um processo de relaxação adicional foi detectado, βpol, no poly-DEGDMA, poly-TrEGDMA e poly-TeEGDMA, com
características similares ao encontrado nos poli(metacrilato de n-alquilo). Este processo foi confirmado e bem caracterizado aquando do estudo da copolimerização do TrEGDMA com acrilato de metilo (MA) para diferentes composições (Capítulo 6).
Para finalizar, o EGDMA, o elemento mais pequeno da família de monómeros estudada, além de vitrificar apresenta uma marcada tendência para cristalizar quer a partir do estado líquido ou do estado vítreo. Durante a cristalização, a formação de uma fase rígida afecta principalmente o processo α , cuja intensidade diminui sem no entanto se observarem modificações significativas na dependência do tempo de relaxação característico com a temperatura. Por outro lado, o processo secundário β
torna-se melhor definido e mais estreito, o que pode ser interpretado em termos de uma maior homogeneidade dos micro-ambientes associados aos movimentos locais (Capítulo 7).
xiii
A
BSTRACTWhen a liquid upon cooling avoids crystallization, it enters the supercooled state. If the temperature continues to decrease, the consequent increase of viscosity is reflected in the molecular mobility in such a way that the characteristic relaxation times of cooperative motions become of the same order of the experimentally accessible timescales. Further cooling finally transforms the highly viscous liquid into a glass, in which only local motions are allowed. The monomers n-ethylene glycol dimethacrylate (n-EGDMA) for n=1 to 4, that constitutes the object of this study, easily circumvent crystallization, being good candidates to study the molecular mobility in both supercooled and glassy states. Dielectric Relaxation Spectroscopy (DRS) was the technique chosen to obtain detailed information about their molecular mobility (Chapters 1 and 2).
The first part of this work consisted in the dielectric characterization of the relaxation processes present above and below the glass transition temperature (Tg), which shifts to higher values with the molecular weight (Mw), result confirmed by Differential Scanning Calorimetry (DSC). While the cooperative α -process associated to the glass transition, and the secondary β process, depend on Mw, the other found secondary process, γ , seems to be independent from this factor (Chapter 3).
In the next Chapters different strategies were carried out in order to clarify the mechanisms in the origin of these two secondary relaxations (β and γ ), and to learn
about its respective relation with the main α relaxation.
Monitoring the real time isothermal free radical polymerization of TrEGDMA by Temperature Modulated Differential Scanning Calorimetry (TMDSC), carried out at temperatures below the Tg of the final polymer network, we shown among others two important features: i) the vitrification of the polymer in formation leads to relatively low degrees of conversion, and ii) the unreacted monomer is expelled from the highly cross-linked network originating a clear phase separation (Chapter 4).
Knowing that phase separation occurs upon the polymerization reaction, the next step was the separate study of the isothermal polymerization of di-, tri- and tetra-EGDMA, giving special attention to the changes in the unreacted monomer’s mobility. With the restrictions imposed by the formation of chemical bonds, the α and β
xiv network, while the secondary γ relaxation kept almost unaffected. The high sensitivity
of the β relaxation to low contents of unreacted monomer was used as a probe of the
reaction’s advance. These different behaviours shown under polymerization allowed the assignment of the molecular origin of the secondary processes: the γ relaxation
associated to the ethylene glycol twisting motions, while the rotation of the carboxyl groups seems to be related to the β relaxation (Chapter 5).
In what concerns the polymer itself, an additional secondary process was found,
pol
β , namely in poly-DEGDMA, poly-TrEGDMA and poly-TeEGDMA, with similar
characteristics to the one found in poly(n-alkyl methacrylates). This process was confirmed and well characterized when the copolymerization of TrEGDMA with methyl acrylate (MA) was studied varying its composition (Chapter 6).
Finally, EGDMA, the smaller monomer of this family, apart from vitrifying, also shows a high tendency to crystallize by coming from both melt and glassy states. The formation of a rigid phase affects mainly the α -process whose intensity decreases without suffering significant changes in the temperature dependence of the characteristic relaxation time. On the other hand, the secondary β process becomes
very well defined and narrowest, indicating a more homogeneous environment around the local-motions (Chapter 7).
xv AGRADECIMENTOS
Agora, no final deste percurso, quando o pensamento principal é “tenho que acabar isto já duma vez!” é difícil pensar nos agradecimentos, e muito fácil lembrar-se só do que se passou nos últimos tempos esquecendo o resto. Contudo, tentando parar para pensar, o primeiro que percebo é quanta pouca coisa teria feito sem ajuda. Uma ajuda que vem de muitos lados e de muitas maneiras.
A todas as pessoas com as que partilhei o lugar de trabalho, uns momentos de conversa, uns almoços… as que prefiro não nomear particularmente para não me esquecer dalguma. De um modo especial a aquelas com as quais já não só se aplica o adjectivo de colegas, com as que a partilha ultrapassou o laboratório. Quando a família e os amigos de sempre estão um bocadinho longe o lugar do trabalho é algo mais do que um sítio para fazer coisas, também é um lugar para grandes amizades. A elas, também peço desculpas por não ter-lhes dedicado mais atenção ou não ter ajudado com mais empenho. Espero no entanto poder fazê-lo a partir de agora!
A Natália duma forma particular, quem até perdeu o sono pela minha causa! ... como estaria esta tese sem a tua contribuição! Será que algum dia te poderei retribuir este esforço? Graças por estar ao meu lado!
Aos amigos que aqui em Lisboa ganhei, às muitas “Luisas” que me acompanham constantemente, à família e amigos de Espanha com os quais a distância nunca foi um problema.
Ao professor Graham Williams, a quem não conheço directamente, mas a quem devo a escolha dos materiais estudados, e os interessantes resultados que deles derivam, (não houve medida que não se aproveitara!!).
A José Luís, por aceitar ser o co-orientador deste trabalho, pelas suas sugestões, para quem qualquer pequena coisa serve para abrir novos caminhos na investigação, mas sobretudo pela sua forma de ser, na qual a simplicidade no trato e a naturalidade são umas constantes.
E especialmente a Madalena, à PROFESSORA Madalena (que ninguém confunda o eu ter-lhe tratado sempre por “tu” com falta de respeito!). Longe ficam nos dias em que comecei a trabalhar com ela, e tantas coisas passaram entretanto que dificilmente poderia esquecer-me dela. Aprendi muito desde um ponto de vista científico sem dúvida ao seu lado, e espero que dalguma forma isso tenha um reflexo neste trabalho. Mas isso, se calhar poderia tê-lo apreendido com outras pessoas… É como ela é o que não poderia ter aprendido de mais ninguém. Sempre me senti afortunada de trabalhar contigo, e sou consciente de ter falado da “minha professora” com certo orgulho, também com admiração, mas sobretudo com carinho. Me sinto afortunada por estes anos contigo e por eles, dou graças a Deus. Oxalá tenha sido capaz de retribuir nem que seja um bocadinho. Gracias!
xvi
I would like to thank to Fundação para a Ciência e a Tecnologia for the financial
support by means of the grant SFRH/BD/6661/2001.
To the Chemistry Department of FCT – UNL (Portugal) where most of the work was
developed and to Biomaterials Center of UPV (Spain) for receiving this student and its research.
xvii
G
ENERALI
NDEXReports by external assessors
Professor Graham Williams, University of Wales ...i
Professor José Mª Meseguer Dueñas, University Polytechnic of Valencia ...vii
Resumo...xi
Palavras chave...xii
Abstract ...xiii
Keywords...xiv
Agradecimentos ...xv
General Index...xvii
Figure Index ...xxii
Scheme Index ...xxxvii
Table Index...xxxviii
C
HAPTER1
|
G
ENERAL INTRODUCTION:
THEORETICAL ASPECTS1.1. Introduction...3 1.2. Glass transition: general aspects ...6 1.2.1 Glass transition and structural relaxation...9 1.2.2 Molecular mobility in polymers and in low molecular weight liquids...12 1.2.2.1 Cooperative motions: main relaxation...13 1.2.2.2 Fragility ...16 1.2.2.3 Local motions: secondary relaxations ...18 1.2.2.4 αβ splitting region...20
xviii
1.3.2 Phenomenological description of dielectric measurement ...43 1.3.3 Debye model and related empirical models ...46 1.3.3.1 Debye relaxation ...46 1.3.3.2 Complex systems: distribution of relaxation times ...48 1.3.4 Dielectric strength: from Onsager to Fröhlich-Kirkwood...54 1.3.5 Conductivity; Electric Modulus ...56 1.4. References ...60
C
HAPTER2
|
E
XPERIMENTAL2.1 Introduction...71 2.2 Principles of dielectric spectroscopy...71 2.3 Alpha high resolution impedance analyzer and temperature control ...74 2.4 Power compensation DSC – Pyris1 ...78 2.4.1 Temperature-Modulated method ...81 2.5 The chemical structures of the starting materials ...83 2.6 References ...85
C
HAPTER3
|
M
OLECULAR MOBILITY IN N-
ETHYLENE GLYCOL DIMETHACRYLATE MONOMERS3.1 Introduction...89 3.2 Dielectric characterization ...89 3.2.1 The α process...95
3.2.2 The secondary relaxations β and γ...102
3.3 Thermal characterization ...105 3.4 Discussion ...110 3.5 Conclusions...115 3.6 References ...116
C
HAPTER4
|
R
EAL TIME POLYMERIZATION OFT
REGDMA
xix
4.2.2 Dielectric Relaxation Spectroscopy ...124 4.3 Results ...126 4.3.1 TMDSC ...126 4.3.1.1 Samples sealed under nitrogen atmosphere...126 4.3.1.2 Samples sealed under air atmosphere...130 4.3.2 DRS ...132 4.4 Discussion ...135 4.5 Conclusions...144 4.6 References ...145
C
HAPTER5
|
C
HANGES IN THE MOLECULAR MOBILITY UPON POLYMERIZATION5.1 Introduction...149 5.2 Polymerization of TrEGDMA ...150 5.2.1 Experimental conditions...151 5.2.1.1 Dielectric Relaxation Spectroscopy...151 5.2.1.2 Differential Scanning Calorimetry...152 5.2.2 Results...152 5.3 Isothermal polymerization of DEGDMA and TeEGDMA...161 5.3.1 Experimental conditions...162 5.3.2 Results...162 5.4 Cyclying polymerization of TeEGDMA...170 5.4.1 Experimental conditions...170 5.4.2 Results...171 5.5 Discussion ...175 5.5.1 Relaxation process already detected in the bulk monomers...176 5.5.2 Molecular mobility in intermediate stages of polymerization and the full polymerized network ...181 5.6 Conclusions...184 5.7 References ...184
C
HAPTER6
|
T
REGDMA/MA
COPOLYMERSxx
6.2 Experimental conditions ...190 6.2.1 Sample preparation...190 6.2.2 Dielectric and thermal conditions ...191 6.3 Results ...191 6.3.1 Dielectric Relaxation Spectroscopy ...191 6.3.1.1 γ relaxation process ...195
6.3.1.2 β relaxation process ...197
6.3.1.3 α relaxation process...199
6.3.2 Differential Scanning Calorimetry ...201 6.4 Discussion ...202 6.4.1 Secondary relaxations ...202 6.4.2 α relaxation process ...204
6.5 Conclusions...209 6.6 References ...210
C
HAPTER7|
I
NFLUENCE OFC
RYSTALLIZATION ON THE MOLECULAR MOBILITY OF THE AMORPHOUS PHASE INEGDMA
7.1 Introduction...215 7.2 Characterization of the amorphous state...215 7.2.1 The α process...219 7.2.2 The secondary relaxations β and γ...220 7.3 Real time dielectric measurements during isothermal cold-crystallization ...221 7.4 Mobility in the semi-crystalline material ...227
7.4.1 Mobility in the amorphous phase after non-isothermal
xxi
CHAPTER 8|
CONCLUSIONSConclusions...261
A
NNEXES|
xxii
F
IGUREI
NDEXCHAPTER 1
|
GENERAL INTRODUCTION:THEORETICAL ASPECTS
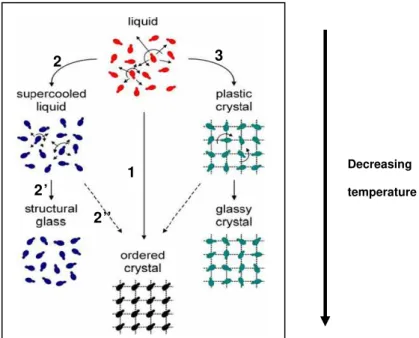
Figure 1.1 Schematic representation of some possible transitions of a liquid of dipolar molecules (represented by asymmetric dumbbells) into a structural glass, an ordered crystal, or a glassy crystal. Reproduced from
reference 1. ... 3
Figure 1.2 Molecular motions that may be found in polymeric systems: a) local mobility, assigned to relaxations occurring in the glassy state; b) cooperative segmental mobility, assigned to glass transition dynamics; c) slower processes, attributed to motions of chain segments between
entanglements. Reproduced from reference 4. ... 5
Figure 1.3 Schematic sketches of atomic arrangements in (a) a crystalline
solid and (b) anamorphous solid... 7
Figure 1.4 Schematic representation of the specific enthalpy or volume as a function of temperature for a liquid that can both crystallize (Tm = melting
temperature) or vitrify in two different ways depending on the cooling rat... 8
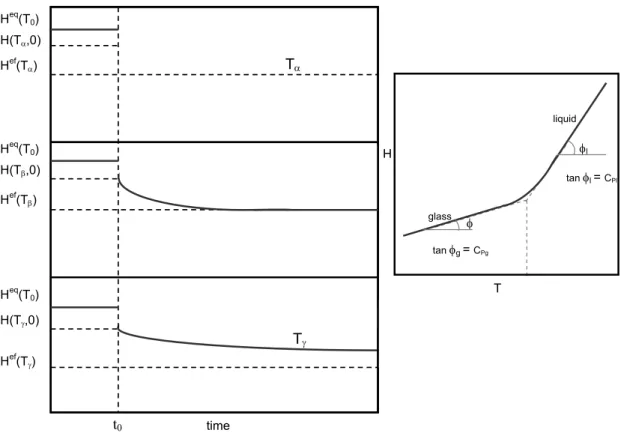
Figure 1.5 Evolution of enthalpy during the structural relaxation process at three temperatures, Tα >Tβ >Tγ (all below Tg). The inset shows the
variation of enthalpy vs. temperature for a fixed time, t0 (adapted from
reference 32). ... 11
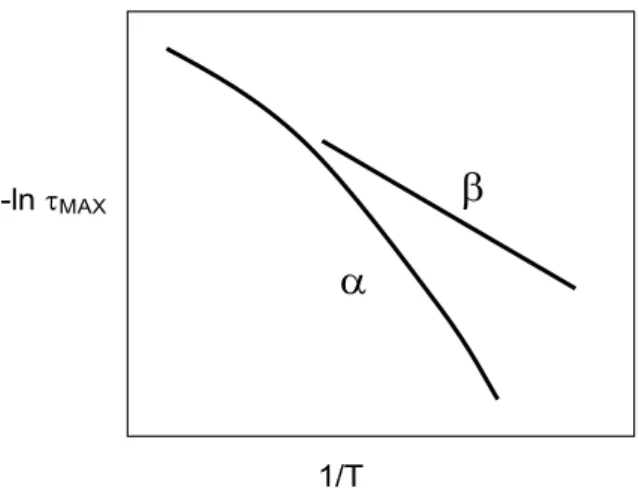
Figure 1.6 Relaxation map: time (or frequency) variation as a function of
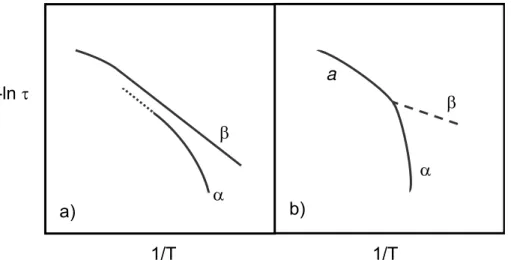
the reciprocal temperature for the α and β relaxations. ... 15
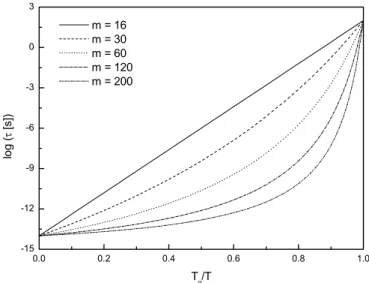
Figure 1.7 Relaxation time as a function of reciprocal temperature normalized to unity at Tg defined for τ =100s, for materials with different
fragilities. The VFTH equation was used to estimate the value of the relaxation time using the m index as independent variable
xxiii Figure 1.8 Schatzki crankshaft mechanism. Reproduced from reference
64. ... 20
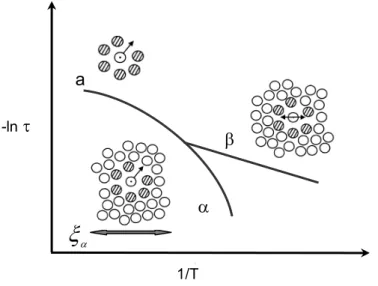
Figure 1.9 Two general scenarios suggested for the splitting region in the
Arrhenius diagram schematically (adapted from reference 78). ... 22
Figure 1.10 Schematic representation for the increasing cooperative region with decreasing T near the glass transition (adapted from reference
111)... 25
Figure 1.11 Schematic molecular pictures for the diffusive high temperature a process (cage escape), the diffusive low-temperature α process (cooperatively-assisted cage escape), and the finite β process (adapted from
ref. 93). ... 27
Figure 1.12 General profiles for nucleation (I ) and growing rate (u)
during crystallization (adapted from reference 105). ... 29
Figure 1.13 Variation of the molar free energy with temperature... 31
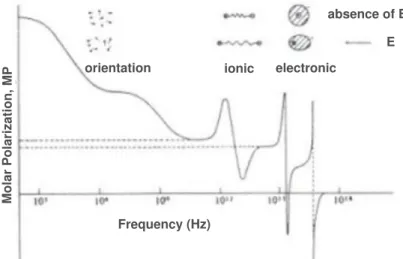
Figure 1.14 Schematic distribution of the molar polarization with
frequency (reproduced from reference 129). ... 42
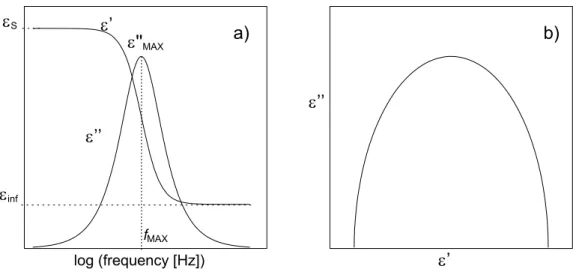
Figure 1.15 (a) Frequency dependence of the real, ε', and imaginary, ε '', parts of permittivity in a simple Debye process. (b) Imaginary part vs. real part
of ε*. ... 48
Figure 1.16 Real and imaginary parts of complex dielectric permittivity
for the Cole-Cole and Davidson-Cole functions in top and bottom respectively
(∆ε = 4 and τ =5×10⁻⁴ s). (For αCC =1 and βDC =1 both functions coincide
with the Debye model) ... 50
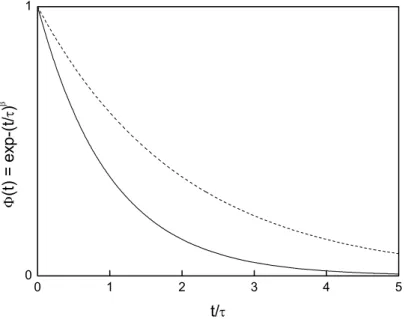
Figure 1.17 The decay relaxation function for a single exponential
function when β = 1 related to Debye model (solid line), and for β = 0.5
corresponding to a stretched exponential function proposed by KWW (dot
line)... 52
Figure 1.18 Imaginary component of the permittivity, calculated using the
KWW model (Equation 1.41) and the Hamon approximation [144], obtained at Different βKWW values (shown in the figure) for τ0=10
-3
xxiv Figure 1.19 Representative data where a peak related to dipolar relaxation
is located around 104 - 105 Hz which is visible in both representations, M'' and
' '
ε ; and a pure d.c. conductivity contribution, which is visible as a peak
located around 0.5 Hz in M'' and as a linear increase of log(ε´´) with slope
equal to -1. ... 57
Figure 1.20 Real and imaginary parts of the complex permittivity (bottom
graph) of fructose at 90 ºC. The region where the slope in ´´ε (on a logarithmic
scale) is close to unity is due to d.c. conductivity, as confirmed by the
invariance in ε´ and the Debye peak (top graph) in M´´ (the slight Asymmetry on the high frequency side is due to the relaxation process that is
starting at the edge of the frequency window). At the lowest frequencies,
electrode polarization is influencing ´ε , lowering the ´´ε slope while leaving
´´
M unaffected (reproduced from reference 159)... 59
CHAPTER 2
|
EXPERIMENTALFigure 2.1 Circuit diagrams for a material exhibiting: a) a relaxation
process with a single relaxation time and induced polarization, b) a relaxation
process with a single relaxation time, conduction and induced polarization and
c) a distribution of relaxation times and induced polarization (reproduced from
reference 5). ... 73
Figure 2.2 Basics of frequency response analysis [6]... 75
Figure 2.3 Principle of the impedance measurement [6]... 76
Figure 2.4 ALPHA analyzer equipment (reproduced from reference 6)... 78
Figure 2.5 Scheme of a power-compensated differential scanning
calorimeter (adapted from reference 8). ... 79
Figure 2.6 Chemical structure of the n-ethylene glycol dimethacrylate
monomers used in this work... 84
xxv
CHAPTER 3
|
MOLECULAR MOBILITY IN N-ETHYLENE GLYCOLDIMETHACRYLATE MONOMERS
Figure 3.1 Normalized loss curves collected at -76 ºC for DEGDMA
comparing data acquired using HP4284A (full symbols - neat DEGDMA) and
ALPHA analyzer (open symbols - DEGDMA with 0.1% of AIBN). The
superposition reveals that neither the equipment nor the initiator affected the
measurements of the pure monomer... 90
Figure 3.2 Dielectric loss spectra in logarithmic scale for (a) DEGDMA,
(b) TrEGDMA and (c) TeEGDMA monomers between -115 ºC and 25 ºC.
Data acquired with ALPHA analyzer. The solid blue line acts as a guide
indicating the behavior of the maxima of ε '' for the α relaxation. ... 91
Figure 3.3 ε '' values at 1 kHz, taken from isothermal measurements,
for DEGDMA (circles), TrEGDMA (triangles) and TeEGDMA (square). ... 92
Figure 3.4 Dielectric loss spectra of TeEGDMA between -114 and -86 ºC
in steps of 2 ºC, showing two secondary relaxation processes , β and γ (the
isotherm collected at -104 ºC is presented in full symbols); the high loss
values on the low frequency side for the highest temperatures is due to the
incoming of the α relaxation process associated with the glass transition... 93
Figure 3.5 Dielectric loss spectra obtained at -100 and -80 ºC for: a)
DEGDMA, b) TrEGDMA and c) TeEGDMA. The individual HN curves are
represented as filled areas: α (black), β (dark gray) and γ (light gray)
processes. The overall fittings are depicted as solid lines. ... 94
Figure 3.6 Dielectric strength and shape parameters obtained from the HN
fitting procedure for the main relaxation process of: DEGDMA (circles),
TrEGDMA (triangles) and TeEGDMA (squares). In the right, open symbols
correspond to βHN and full symbols to αHN. ... 95
Figure 3.7 Values of
(
T∆εα)
vs. temperature: circles for DEGDMA,xxvi Figure 3.8 (a) Master curve (red line) constructed for DEGDMA at -76 ºC
using αHN =0.92 and βHN =0.52; data collected between –80 and –60 ºC
every 5 ºC (symbols indicated in the figure); (b) normalized curves at -70 ºC
for: DEGDMA (circles), TrEGDMA (triangles) and TeEGDMA (squares)... 98
Figure 3.9 Symbols: normalized curve for DEGDMA at -76 ºC; Grey line:
''
ε constructed from Hamon approximation with βKWW =0.56 in accordance
with ref. 12 and black line for βKWW =0.59 estimated from a series expansion
in accordance with ref. 13... 99
Figure 3.10 Arrhenius plot for all the relaxation processes indicated in
figure for: unreacted DEGDMA/AIBN (0.1%) (full circles),
TrEGDMA/AIBN (full triangles) and TeEGDMA/AIBN (0.1%) (full
squares). Gray symbols correspond to the main relaxation process for pure
monomers monitored with HP4284A, showing the correspondence between
the different measurements. The arrows indicate the location of the estimated
g
T at 100 s. ... 101
Figure 3.11 Dielectric strengths plotted vs. the reciprocal temperature for monomer a) DEGDMA, b) TrEGDMA and c) TeEGDMA: grey symbols for
the α relaxation (left axis), open and filled black symbols for, respectively,β
and γ relaxations (right axis). ... 104
Figure 3.12 DSC heating curves for DEGDMA, TrEGDMA and
TeEGDMA
obtained at a heating rate of 10 ºC.min-1 (the curves were vertically displaced to
situate the initial heat flow, Φ, at 0). The inset shows for TrEGDMA, how the
onset temperature, Ton, is determined.. ... 106
Figure 3.13 DSC signature of the glass transition for TrEGDMA obtained
at different heating rates, |q|: 4, 5, 7, 10, 12, 15, 17 and 20 ºC.min-1; the curves
xxvii Figure 3.14 Activation plots (logarithm of the heating rate as a function of
on
T
1 ) of the calorimetric glass transition signal for DEGDMA (•),
TrEGDMA ( ) and TeEGDMA ( ). ... 109
Figure 3.15 (a) Glass transition and exothermic peak of crystallization
obtained at 5 ºC.min-1; (b) endothermic peak centered at 2.9 ºC obtained in a subsequent run in heating mode at 12 ºC.min-1, corresponding to the fusion of
crystalline TeEGDMA... 109
Figure 3.16 Loss curves for the three monomers at -80 ºC (full symbols)
and -66 ºC (open symbols) for DEGDMA (circles), TrEGDMA (triangles) and
TeEGDMA (squares)... 112
Figure 3.17 Real part, ’, of TrEGDMA corresponding to isothermal data
obtained from -88 ºC to -44 ºC every 4 ºC, showing the rapid increase in the
low frequency side. In the inset the imaginary part ε'', in the logarithmic scale
of the same set of data where the last isothermals show a slight curvature
indicating that not only pure conductivity occurs. ... 114
CHAPTER 4
|
REAL TIME POLYMERIZATIONOF TREGDMA
Figure 4.1 Normalized average heat flow measured by TMDSC during
isothermal polymerization at 66 ºC of two samples of TrEGDMA/AIBN
(0.1% w.t.) prepared under nitrogen atmosphere to show the reproducibility of
the experimental results. ... 124
Figure 4.2 Isochronal loss tanδ at 1 kHz for data taken on cooling (~-8
ºC.min-1) for samples used afterwards in the isothermal polymerization at the temperatures indicated in figure (for more details see text); data corresponding
to TrEGDMA monomer is also included as a line for comparison. ... 125
Figure 4.3 Normalized average heat flow measured by TMDSC during
isothermal polymerization at the indicated temperatures. Samples were
prepared under nitrogen atmosphere. ... 126
Figure 4.4 Conventional DSC scan obtained from -40ºC to 220ºC at
xxviii
previously polymerized during 200 min at 66 ºC. The inset enlarges the
temperature region where the glass transition of the sample was detected. ... 127
Figure 4.5 Conversion rate versus conversion, x, for the isothermal
polymerization at different temperatures (as indicated in the figure). Samples
prepared under nitrogen atmosphere. ... 128
Figure 4.6 Conversion rate (left axis) and storage heat capacity (right
axis) against polymerization time for isothermal polymerization at different
temperatures... 129
Figure 4.7 Influence of the modulation amplitude on the conversion rate
plot. Samples sealed under nitrogen atmosphere... 129
Figure 4.8 Comparison of the conversion rate versus time for samples
polymerized under an oxygen and nitrogen atmosphere, and measured under
the same conditions (at a temperature of polymerization of 70 ºC, amplitude
with a period of modulation of 1 ºC and 24 sec). ... 130
Figure 4.9 Normalized average heat flow (left axis) and storage heat
capacity (right axis) for samples sealed under air atmosphere and polymerized
at 85 ºC. ... 131
Figure 4.10 Influence of sample mass on the polymerization kinetics
monitored at 75 ºC (amplitude and period of modulation of 1 ºC and 24 sec) of
samples sealed under nitrogen atmosphere. The sample mass is indicated in
the figure... 132
Figure 4.11 (a) 3D dielectric loss spectra and (b) 3D electric modulus,
corresponding to TrEGDMA/AIBN during isothermal polymerization at 66
ºC. ... 133
Figure 4.12 Relaxation time,τM", of electric modulus loss vs.
polymerization time... 133
Figure 4.13 Intensity of electric modulus (∆M =M0 −M∞) vs.
polymerization time... 134
Figure 4.14 (a) Loss factor at 1 kHz obtained after polymerization at the
xxix
indicated in the figure and (b) after heating the semi-polymerized samples up
to 220 ºC. Data were collected at a cooling rate of around -9 ºC.min-1... 135
Figure 4.15 Relationship between the glass transition temperature (for
each Tpol) and conversion at the mid-point of the C' step, corresponding to vitrification. The solid line represents the glass transition temperature of a
homogeneous mixture of monomer and the polymer network according to
Fox’s equation (see text)... 138
Figure 4.16 Dielectric results for TrEGDMA/AIBN mixture at 66 ºC: (a)
and (c) real (right axis) and imaginary (left axis) parts of ε* for t = 0 min and t =150 min of polymerization; (b) and (d) represent the dielectric modulus and
the HN fitting curves for t = 0 min and t =150 min of polymerization. ... 142
CHAPTER 5
|
CHANGES IN THE MOLECULAR MOBILITYUPON POLYMERIZATION
Figure 5.1 Dielectric loss spectra collected from -115 to -45 ºC (see
section 5.2.1.1) for the poly-TrEGDMA samples: a) Tpol70ºC, b) Tpol80ºC, c)
pol
T 200ºC and d) Tpol80+120ºC. In full symbols are presented the
corresponding loss curves obtained at -75ºC... 153
Figure 5.2 Comparison between the loss curves obtained at -75ºC for each
poly-TrEGDMA samples: Tpol70ºC – triangles, Tpol80ºC – squares,
pol
T 80+120ºC – asterisks, Tpol200ºC – stars (left axis). The fresh mixture
TrEGDMA/AIBN is included in circles in logarithmic scale (right axis)... 154
Figure 5.3 Isochronal plot of ε '' at 1 kHz for all polymerized samples of
TrEGDMA(same symbols as Figure 5.2 are used)... 155
Figure 5.4 DSC thermograms obtained at 5 ºC.min-1 from 30 up to 400 ºC for both poly-TrEGDMA samples Tpol80+120ºC and Tpol200ºC; the abrupt variation with a minimum at 310 ºC is due to thermal degradation; the inset
shows the first run taken from -130 up to 70 ºC where no monomer’s glass
xxx Figure 5.5 Real (full symbols and right axis) and imaginary parts (open
symbols and left axis) of the complex permittivity obtained at -75 ºC for
poly-TrEGDMA samples: a) Tpol70ºC and b) Tpol80ºC, and the corresponding individual HN fitting functions considered (filled area). The overall fitting
curve is represented as solid line. ... 157
Figure 5.6 Dielectric strength, ∆ε, in function of the reciprocal of
temperature for all poly-TrEGDMA samples: full symbols – main process,
open symbols – secondary process; Tpol70ºC – triangles, Tpol80ºC – squares,
pol
T 80+120ºC – asterisks and Tpol200ºC – stars... 158
Figure 5.7 Activation plots for both main and secondary relaxation (γpol)
processes for poly-TrEGDMA samples; solid lines represent the VFTH
fittings of the main process. Symbols: Tpol70ºC - triangles, Tpol80ºC - squares, Tpol80+120ºC - asterisks and Tpol200ºC - stars; in grey full circles are represented the corresponding (α and γ ) data for the monomer prior to
polymerization. ... 161
Figure 5.8 Dielectric loss spectra obtained at -100 and -80 ºC for: a) and
c) poly- DEGDMA, and b) and d) poly-TeEGDMA, after polymerizing 2.5
hours at 70 ºC, i.e. Tpol70ºC samples (full symbols). Grey open symbols
correspond to unreacted mixtures. The individual HN curves (filled areas) for
polymerized systems and the overall fittings (solid lines) are included... 163
Figure 5.9 Dielectric loss spectra at -76 ºC collected for poly-DEGDMA
partially polymerized, Tpol70ºC. The individual HN and the overall fit curves
are included. In the inset, real part of the complex permittivity and the
corresponding fit line are represented. ... 164
Figure 5.10 Dielectric loss represented every 10 ºC starting from -110 to
20 ºC for: a) poly-DEGDMA and b) poly-TeEGDMA after polymerization at
120 ºC, samples Tpol70+120ºC. The isotherm at -110 ºC and 20 ºC are in full
xxxi Figure 5.11 Isochronal representation of ε '' at 1 kHz taken from
isothermal data for: a) poly-DEGDMA and b) poly-TeEGDMA. In the insets
the series Tpol70+120ºC and Tpol200ºC for poly-DEGDMA and
pol
T 70+120ºC for poly-TeEGDMA are enlarged. The results for the monomers prior to polymerization (“unreacted”) were included for facilitating
the comparison in grey full symbols. ... 165
Figure 5.12 Isochronal plots of ε '' at 1 Hz taken from isothermal
measurements for poly-TeEGDMA, sample Tpol70+120ºC (black stars), together with the plot for poly-methyl methacrylate [25] (plotted using the
right y-axis –gray stars) evidencing the similar location of the secondary relaxation detected in the two systems. The inset shows the isotherms of the
real permittivity from 60 up to 200 ºC every 5 ºC, measured after
polymerization at 120 ºC to illustrate interfacial polarization effect (MWS) at
higher temperatures that is felt as a shoulder in the isochronal plot indicated
by the arrow. The sample named tpol=144 min (open stars) was polymerized
in a cycling method described in next sections. ... 166
Figure 5.13 Relaxation map for both DEGDMA and
poly-TeEGDMA after polymerization 2.5 h at 70 ºC (Tpol70ºC) and after polymerization at 120 ºC (referred here as Tpol120ºC, see legend); solid line is the VFTH fitting for the main α -process for DEGDMA polymerized at 70 ºC.
Temperature dependence for the α -process of unreacted monomers are
shown as gray lines... 167
Figure 5.14 Loss curves collected after different polymerization times,
pol
t (see legend inside) at Tpol=70ºC for poly-TeEGDMA at: a) -44 ºC, b) -80 ºC (ε '' in log scale) and c) -100 ºC; different ε '' scales are used due to the
great intensity variation between the observed processes. ... 172
Figure 5.15 Isochronal plot of ε '' (log scale) at 1 kHz for
TeEGDMA/AIBN at different polymerization times (tpol). Data corresponding
xxxii Figure 5.16 Relaxation map for TeEGDMA/AIBN polymerized by
thermal cycling (see legend). The temperature dependence of the relaxation
time of βpol process detected in sample Tpol70+120ºC (asterisks) is included. The inset shows the similarity between loss peaks for the final cycled sample
(tpol=144 min) and for the sample Tpol70+120ºC... 174
Figure 5.17 Chemical structure of n-ethylene glycol dimethacrylate
monomer. The molecular motions that originate the secondary relaxation
process, β and γ , are illustrated. ... 178
Figure 5.18 Plot of F
( )
T against temperature in accordance withEquation 5.3 (see text) for the β and γ relaxations measured after different
polymerization times tpol, for TeEGDMA cyclically polymerized. β
relaxation: ( ) unreacted (tpol= 0 min), ( ) tpol= 6 min, (x) tpol= 10 min, ( )
pol
t = 20 min, ( ) tpol= 24 min; γ relaxation: (♦)unreacted, ( ) tpol= 6 min,
(*) tpol= 10 min, ( ) tpol= 20 min, ( ) tpol= 24 min. ... 180
CHAPTER 6
|
TREGDMA/MA COPOLYMERSFigure 6.1 Loss curves in temperature region from -120 to 100 ºC every
10 degrees for a) PMA, b) MA80, c) MA70, d) MA50, e) MA30 and f)
poly-TrEGDMA. Full symbols correspond to: circles, -60 ºC and triangles, 60 ºC.
Inset in figure f) represents isochronal data taken from isothermal
measurements for 1 MHz, 100, 10, 1 and 0.1 kHz in the arrow direction. ... 192
Figure 6.2 Temperature dependence of dielectric loss a) at 1 kHz and b) at
1Hz, taken from isothermal measurements: asterisks, poly-TrEGDMA;
squares, MA30; triangles, MA50; diamonds, MA70; stars, MA80 and circles
for PMA... 193
Figure 6.3 Temperature dependence of the relaxation times of γ process
for: poly-TrEGDMA (asterisks), PMA30 (squares), PMA50 (triangles),
xxxiii Figure 6.4 Reduced Cole-Cole arcs corresponding to a) poly-TrEGDMA),
b) MA30 and c) MA50, for isothermal measurements at -50 ºC (triangles), -60
ºC (circles) and -70 ºC (asterisks). Insets represent the normalized permittivity
for the same temperatures (the symbols are maintained). ... 197
Figure 6.5 Arrhenius plot for the β relaxation: squares, MA30; triangles,
MA50; diamonds, MA70; stars, MA80 and circles for PMA (this obtained
from isochronal data). The inset shows the individual and overall HN fitting
functions for ε ''at -10 ºC for MA80 (left axis), and the corresponding 'ε data
and overall fitting (right axis)... 198
Figure 6.6 Temperature activation energy plots forα relaxation: squares,
MA30; triangles, MA50; diamonds, MA70; stars, MA80 and circles for PMA.
Full symbols obtained from HN procedure, and open symbols obtained
fromlog
( )
f vs 1 max−
T . Solid lines correspond to linear fit for secondary and
MWS relaxation and, to VFTH fit for data obtained from the last method
proposed for the main relaxation (see text). ... 200
Figure 6.7 DSC heating curves obtained at 10 ºC.min-1 for all prepared
mixtures except poly-TrEGDMA. ... 202
Figure 6.8 Activation plot for all the processes detected in sample MA70:
triangles, γ; squares, β; circles, α (open for HN procedure, and full for
( )
flog vs.Tmax−1); cross symbols for MWS. The arrows indicate the Tg values
measured by DSC and by DMA [12]. ... 206
Figure 6.9 Normalized loss curves at 55 ºC for: diamonds, MA70; stars,
MA80 and circles for PMA. ... 207
Figure 6.10 Glass transition temperature measured by DSC (full circles),
and calculated from VFTH curve for τ =100 sec obtained from dielectric
measurements (triangles). The solid line represents the glass transition
temperature of a homogeneous mixture of monomer and the polymer network
xxxiv
CHAPTER 7
|
INFLUENCE OF CRYSTALLIZATION ON THE MOLECULARMOBILITY OF THE AMORPHOUS PHASE IN EGDMA
Figure 7.1 Dielectric loss spectra for EGDMA between -100 and
-78 ºC. Inset: dielectric loss spectra from -76 to -55 ºC. ... 217
Figure 7.2 Dielectric loss spectra obtained at -115 ºC for:
EGDMA (asterisks), DEGDMA (circles), TrEGDMA (triangles) and
TeEGDMA (squares)... 217
Figure 7.3 Dielectric loss spectra for EGDMA collected at -115 ºC and
the respective overall HN fitting curve (solid line). The individual HN
functions employed during fitting procedure are shown as filled areas: a) one
HN function corresponding to the secondary β process, and b) two HN
functions for the β and γ secondary relaxations. In both cases the high
frequency tail of the α relaxation is felt in the low frequency side of the
spectrum. ... 218
Figure 7.4 Relaxation map for the four monomers studied in this work:
black stars correspond to EGDMA, grey squares, triangles and circles
correspond to DEGDMA, TrEGDMA and TeEGDMA already studied in
Chapter 3. Solid lines are the VFTH and Arrhenius fittings. ... 219
Figure 7.5 Dielectric loss for EGDMA collected during real time
isothermal cold crystallization at -80 ºC. The solid lines are the overall fitting
to the experimental data obtained at different times using the sum of three HN
functions. Only the loss curves collected each 12 minutes are shown in a total
collecting time of 2 hours. The graphic in inset represents the spectrum
collected at 84 min (points) and the overall HN fit (solid line); the
corresponding HN individual curves are also included (filled areas). ... 222
Figure 7.6 a) Dielectric strength for the α -relaxation, ∆εα, obtained
from the HN fitting and b) crystallization degree, χc, as a function of
crystallization time for the isothermal cold-crystallization at temperatures, Tcr,
xxxv Figure 7.7 Avrami plot according to Equation 7.3 and corresponding
regression line (see text) for each crystallization temperature (Tcr) studied. ... 226
Figure 7.8 Isochronal plots of ε' and ε'' revealing frequency-independent
sharp steps at melting (Tm) and crystallization (Tcr), and frequency-dependent liquid to glass “transition” (Tg); all of them are indicated by the vertical arrows. The horizontal arrows indicate the different states attained by the
sample upon cooling. ... 229
Figure 7.9 Dielectric loss spectra for EGDMA obtained after
non-isothermal melt-crystallization for temperatures between -115 to -100 ºC
every 5 ºC, and after until -76 ºC every 2 ºC. The spectrum collected at
-100 ºC is represented in blue colour to help the visualization of the
β process and the incoming α process in the low frequency side. ... 230
Figure 7.10 Isothermal loss spectra for the EGDMA after non-isothermal
crystallization from melt (at -1 ºC.min-1) at the temperatures indicated. The overall fit (black line) and the corresponding individual HN functions (filled
areas) employed to reproduce the complete ε '' spectra are included. ... 232
Figure 7.11 Arrhenius plot of the semicrystalline state attained after
non-isothermal crystallization from the melt. The relaxations detected in the
amorphous state are included in grey symbols (the grey line is the VFTH fit
for the main relaxation process). Black lines correspond to the linear fits. ... 234
Figure 7.12 Dielectric loss spectra for EGDMA obtained after isothermal
cold-crystallization at Tcr=-82 ºC for temperatures between -98 and -80 ºC every 2 ºC (full symbols); the isothermal at -82 ºC is shown in blue color. The
''
ε curve measured at the end of the isothermal crystallization at -82 ºC
(i.e. after 120 min) is also included (open symbols). ... 236
Figure 7.13 Dielectric loss spectra for EGDMA collected after isothermal
cold-crystallization at -82 ºC. The overall fit (black line) and the
corresponding individual HN functions (filled areas) employed to reproduce
the complete ε '' spectra are included. Note a strong depletion of the
![Figure 1.18 Imaginary component of the permittivity, calculated using the KWW model (Equation 1.41) and the Hamon approximation [144], obtained at different β KWW values](https://thumb-eu.123doks.com/thumbv2/123dok_br/16475782.732024/102.892.226.675.309.663/imaginary-component-permittivity-calculated-equation-approximation-obtained-different.webp)
