This is an Author's Accepted Manuscript of an article published as: TAVARES, S., CARDOSO, M. and DIAS J.G. (2010) The heterogeneous best-worst choice method in market research. International Journal of Market Research, 52(4), 533-546 available online at: http://dx.doi.org/10.2501/S1470785309201430
Editorial Manager(tm) for International Journal of Market Research Manuscript Draft
Manuscript Number:
Title: The heterogeneous best-worst choice method in market research Article Type: Article
Corresponding Author: Dr. José G. Dias, Ph.D.
Corresponding Author's Institution: ISCTE - Lisbon University Institute First Author: Susana Tavares , Master Degree in Data Analysis
Order of Authors: Susana Tavares , Master Degree in Data Analysis; Margarida Cardoso, Ph.D.; José G. Dias, Ph.D.
Abstract: Although there are several methods to assess the relative importance of the attributes in decision making, the mainstream approach has been the direct method (DM). However, this method that rates attributes directly has been criticized, mainly because it does not take into account the heterogeneity in the answers. This paper aims at presenting the heterogeneous best-worst choice method (HBW) as an alternative to the direct method. We illustrate this approach with an application in educational marketing, focusing on the most relevant attributes for undergraduate students to choose a Business School. The main conclusion is that the HBW allows for more heterogeneity in the answering patterns, while proving results similar to the DM.
The heterogeneous best-worst choice method in market research
ABSTRACT
Although there are several methods to assess the relative importance of the attributes in decision making, the mainstream approach has been the direct method (DM). However, this method that rates attributes directly has been criticized, mainly because it does not take into account the heterogeneity in the answers. This paper aims at presenting the heterogeneous best-worst choice method (HBW) as an alternative to the direct method. We illustrate this approach with an application in educational marketing, focusing on the most relevant attributes for undergraduate students to choose a Business School. The main conclusion is that the HBW allows for more heterogeneity in the answering patterns, while proving results similar to the DM.
KEYWORDS:
Heterogeneous best-worst choice method, discrete choice models, latent class models. Manuscript
INTRODUCTION
The level of relevance consumers convey to the attributes of a product/service has been pivotal in understanding the purchasing decision process (Louviere et al. 2001). In order to measure those attributes’ relevance there are two main approaches: the direct and the indirect one. In the direct approach, one asks respondents to state their valuation of a given attribute, usually by grading the attributes on a metric scale (rating scale) or by allocating points to the attributes (e.g., 100 points) (constant sum scale). The direct method (DM), based on rating scales, presents well-known disadvantages (Cohen and Markowitz 2002), namely:
rating scales do not provide enough diversity in the patterns of answering, in particular
with short-amplitude scales (e.g., a 5-point scale);
different respondents tend to use different parts of the scale, either providing very
homogeneous ratings or, on the contrary, using the extreme points to indicate a higher or a lower relevance;
in multi-country studies, in general, cultural differences are observed in scale usage by
respondents (Baumgartner and Steenkamp 2001).
In the indirect approach, different methods of estimating the relative importance of the attributes are available, being the ranking method, the discrete choice method and the pairwise comparison method the best known alternatives. The indirect methods overcome most of the limitations of the direct methods, in particular:
the ranking of attributes prevents ties and too homogeneous classifications, generally
at the expenses of being more complex to the respondents to assess;
in discrete choice methods, respondents choose the most relevant (first choice)
attribute out of each subset of attributes, which allows no ties and high discrimination between alternative attributes;
the paired comparison method is easily understandable and mimics the choice process.
In spite of being more realistic than the DM, the indirect methods – asking for choices instead of preferences – are prone to information overload by respondents. Indeed, respondents tend to be asked to answer a very large number of questions, which makes the method potentially fatiguing and inefficient.
The Best-Worst (BW) method was introduced as an alternative indirect method, where respondents state the most important attribute (best) and the least important one (worst) in various subsets of all attributes in the analysis (Finn and Louviere 1992). The BW method enables the performance of discrete choice tasks, in a way that usually respondents understand quite well and provides more information than the conventional choice method. It can also be considered a more sophisticated form of the traditional pairwise comparison method, as it provides similar information yet with a small number of questions (for example, from a set of 4 attributes, two BW questions allow to obtain information about 5 of the 6 possible pairs; in the case of 5 attributes, it would be obtained information about 7 out of 10 possible pairs). One limitation of the traditional BW method is that it assumes a homogeneous population and the attributes’ weights are constant across respondents. To overcome this limitation, this article suggests the Heterogeneous Best-Worst method (HBW).
The article is organized as follows. Next section provides a short introduction to the BW method, followed by the presentation of the HBW method. Then, we compare the HBW, BW methods and DM, based on a real-world application regarding the choice of a Business Schools. The article ends with concluding remarks highlighting the main advantages of the HBW method and suggesting further research and extensions to the method.
THE BEST-WORST METHOD
The Maximum Difference Scaling (MAXDIFF) method was developed by Louviere and co-authors (Finn and Louviere 1992, Swait et al. 1995), in order to overcome the drawbacks of the direct methods. As most of the applications of the MAXDIFF were with choice-based conjoint purposes, later it became known as Best-Worst Conjoint Analysis, Best-Worst method for short.
In the Best-Worst procedure, a block of profiles (sets of attributes with specific levels or categories) are shown to the respondent. Each respondent has to select the most preferred/relevant profile/attribute (best) and the least preferred/relevant (worst) choice. This
methodology is based on the maximum difference technique (MAXDIFF): the pair
Best-Worst maximizes the difference of utilities between the best and worst alternative choices.
Data collection and experimental design
In order to determine the block of profiles/attributes in each set of alternatives to be assessed by the respondents, the experimental design maximizes the information provided by each choice. The most commonly used experimental designs are: BIB – Balanced Incomplete
Blocks and PBIB – Partial Balanced Incomplete Blocks (Cohen and Markowitz 2002).
Optimal experimental designs take into account the following properties: balance (each item appears the same number of times), orthogonality (each pair of items appears the same number of times), and positional balance (every item has the same number of permutations in the presentation ranking).
Best-worst choice model
The selections of the best and the worst alternatives are discrete choices. Discrete choice modeling, under the Random utility framework, assumes that individual i assesses sets of J alternatives and chooses the alternative from each set that provides maximum utility (McFadden 1974). As the ‘utility’ of an alternative is not directly observed, one assumes that
it contains a deterministic part (V) and a stochastic part (). Thus, the utility of the alternative j
for the subject i is:
ij ij ij V
U
. (1)Hence, the probability of the subject i to select the alternative j from a specific set of
alternatives Ci with J alternatives is:
) ' ; ( ) ' ; ( ij ij' i ij' ij ij ij' i ij P U U j j C P V V j j C p
. (2)The (conditional) multinomial logit model (McFadden 1974) assumes that the random variables are independent and identically distributed with an extreme value distribution of
type I1 with:
1
Historically, the extreme value distribution of Type I has been designated by log-Weibull, Gumbel and Double-Exponential.
)] exp( exp[ ) ( t t P
ij , (3) resulting . ) exp( ) exp( 1
J j j i ij ij V V p (4)The deterministic component of the model is linearly dependent on the levels of the factors,
ij j ij V βX , i.e.: , ) exp( ) exp( 1 '
J j j i j ij j ij p X β X β ' ' (5)where
X
ij is the matrix of independent variables (experimental conditions containing theattributes being manipulated in alternative j) and
β
j is the vector of parameters for alternativej. Note that for model identifiability, we set βJ 0.
In the Best-Worst method, the option best is identical to the discrete choice model (the one that maximizes the utility). On the other hand, the option worst in the Best-Worst method assumes that the partial utilities must be symmetrical to those for option best (Louviere, 1994). Thus, a multinomial logit regression model is obtained, doubling the number of individual assessments (and information) comparing with choice-based conjoint analysis. Hence, the probability of subject i to select alternative j as the most preferred (best) from a
given set of alternatives Ci containing J alternatives, is given by (4); while the probability of
the same subject i to select the alternative r as the least preferred (worst) is:
J j j i ir irV
V
p
1)
exp(
)
exp(
. (6)The model is easily estimated by the method of maximum likelihood. For a more detailed description of this model, we refer to Marley and Louviere (2005).
THE HETEROGENEOUS BEST-WORST METHOD
The Heterogeneous Best-Worst (HBW) model can be seen as an extension of the Best-Worst model coupled with a finite mixture model. Mixture choice modeling has become a key toolkit in market research since the seminal work by Kamakura and Russell (Kamakura and Russell, 1989). Mixture modeling has been seen mainly as a probabilistic tool of market segmentation (see, e.g., Fonseca and Cardoso 2007; Dias and Vermunt 2007). The observed
choices yij are assumed to be independent and generated from a population of S latent
segments in proportions 1,....,S. A priori it is not known to which segment a certain subject
belongs. The prior probabilities s or cluster sizes are such that:
S s s 1 1 , s 0 s=1,...,S. (7)The HBH model allows that the parameters in the linear component of model vary across segments, but are constant within segments. Within each segment, one has the Best-Worst model. Thus, the probability of the subject i to select the alternative j, conditional on belonging to segment s, is:
J j j i sj ij sj sij p 1 ' ) exp( ) exp( X β X β , s=1,…,S, (8)where
X
ij are the experimental factors (attributes of the alternatives) and βsj is the vector ofparameters in segment s. The latent class multinomial logit model simultaneously models the
conditional probabilities in equation (8) and the prior probabilities s. Under the maximum
likelihood framework, the HBW model can be estimated by the EM algorithm. The probability of individual i to select alternative j is the weighted probability:
S s sij s ijp
p
1
. (9)Note that for a single latent class (
S
1
), the HBW model reduces to the Best-Worst model.Thus, the semi-parametric nature of the HBW models improves model fit as the number of segments increases.
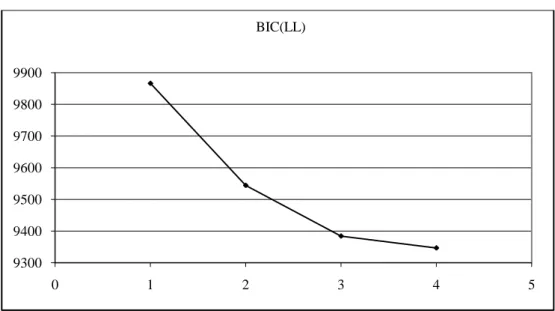
As the optimal number of groups is not known a priori. We use the Bayesian Information Criterion to select it (BIC; Schwarz 1978). It is given by:
BIC2lnL pln(n), (10) where L is the maximum value of likelihood function, p is the number of free parameters, and
n is the sample size. The minimum value of BIC represents a (good) trade-off between model
fit and complexity. The representation of the BIC values vs the number of segments gives insights concerning the number of segments to retain. In some applications, an additional segment has a marginal impact on the criterion, its addition being useless .
AN APPLICATION IN EDUCATIONAL MARKETING
This Section applies the Heterogeneous Best-Worst method (HBW) to determine high-school students’ most relevant attributes at the time of choosing a Business School. These results are compared with the Best-Worst method and the direct approach based on a rating scale.
Data collection
The attributes of a Business School included in this study were derived from preliminary qualitative research among experts. The final selection of attributes is listed in Table 1.
[Table 1 about here]
To determine the sets of options to show in the questionnaire, the BIB – Balanced Incomplete Blocks – was applied, with 13 sets of 4 alternatives each (see Figure 1). In the Best-Worst method, each respondent was asked to choose two options out of four from each of the 13 sets of attributes in the questionnaire, selecting the attributes they considered the most important (best) and the least important (worst) when choosing a Business School. Each attribute was presented exactly 4 times, each pair of attributes is only shown once and each attribute was shown in every possible position.
[Figure 1 about here]
In order to compare the results of Best-Worst methods with those of the direct approach, respondents were asked to rate the 13 attributes, shown in Table 1, in a 10-point scale from 0–
[Figure 2 about here]
The questionnaire was administered to a sample of 130 students studying Management/Economics (pre-university students) in Metropolitan Lisbon, covering 22 schools. The selection of these 22 schools ensures a good coverage of the different type of students who will apply to the Business Schools in Lisbon.
Model estimation
We estimated the HBW model that yields data disaggregation at the individual level. According to BIC results (and despite there is no minimum value observed), the curve shows an elbow when three classes are considered (Figure 3). Thus, we set a three-segment solution that is enough to take into account choice heterogeneity among respondents.
[Figure 3 about here]
Results
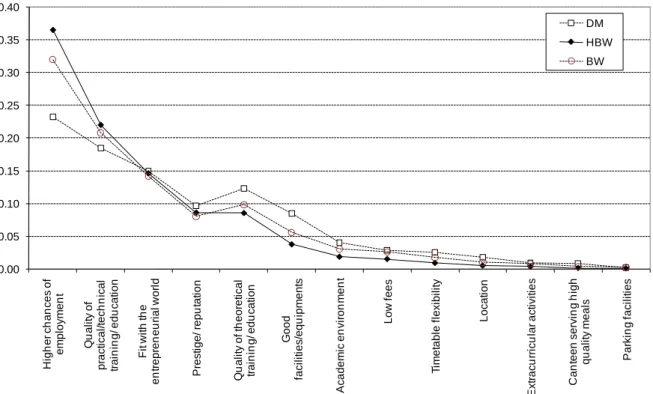
In order to evaluate/compare the results we perform the estimation of the attributes’ weights using the three techniques: the Direct Method (DM) and the Best-Worst method with (HBW) and without (BW) heterogeneity. The comparison revealed that the results of the three techniques are globally similar. Indeed, the three most important attributes in the selection of a Business School are (in decreasing order of importance):
1. higher chances of employment;
2. quality of practical/technical training/education; 3. fit with the entrepreneurial world.
From the ranking viewpoint, we conclude that the methods mostly agree (see Figure 4). In top positions, we observe a single switch between positions of the attributes prestige/reputation and quality of theoretical training/education (positions 4 and 5).
This comparison of techniques suggests that the DM (rating scale) is a utility measure that respondents ascribe to the various attributes. Thus, the probability of selecting each attribute can be calculated by the exponentiation of the 10-point ratings, considered as utilities (in equation (4), in the sense of the logit rule in market simulation conjoint analysis studies). Comparing these probabilities with those obtained by the BW and HBW techniques (Figure 5), one observes that the results are rather similar. However, it is worthwhile to note that the HBW enables more differentiation of the extreme preferences than the other two methods. The attribute higher chances of employment records the wider difference, although it ranks first for all techniques. An important advantage of the indirect method is its ability to handle social norms and to control social accepted answers (Louviere et al., 2001). Figure 5 shows that higher chances of employment is more important than directly stated. Moreover, this effect explains the reversed positions between prestige/reputation and quality of theoretical
training/education (see Figure 4). Directly, students state that on average they are more
concerned with quality factors than prestige, however the HBW method reveals that is not the case. Moreover, the aggregate BW methods (S=1) is not powerful enough to distinguish this normative effect.
CONCLUSION
In this article, we described briefly the Heterogeneous Best-Worst method to determine the relative importance of the attributes in a choice process. The results are compared with the Best-Worst method and the direct method.
The direct method has some constraints, originated by the usage of rating scales to evaluate the importance of the attributes. Namely, respondents may misunderstand the use of the scale and tend to consider all attributes relevant. Hence, they rate them very positively (every attribute is important), resulting in a lacking of differentiation between the attributes.
Despite being a time consuming and complex method of retrieving the relative importance of the attributes in decision making, the HBW approach has several advantages comparing to alternative techniques:
as the approach mimics the decision making (choice), it is more realistic and easier to understand by respondents;
being an indirect method, it controls desirably and social effects on the use of the
scale, providing more reliable results;
as it is scale free, it can also be easily used to compare multi-country studies, where
rating scales tend to be interpreted differently;
as it allows heterogeneous segments in the population, the HBW method enables a
higher differentiation of the relative importance of the attributes.
In order to compare the Best-Worst procedures with the direct approach (declared importance measured on a rating scale), a case study was conducted, in which 13 attributes considered relevant for choosing a Business School were assessed. This comparison revealed that the results using the three techniques were rather similar. From the several advantages of Best-Worst methods, it is highlighted the task realism and simplicity for respondents at the data collection stage. Consequently, indirect methods are more reliable in retrieving the impact of social norms on attitudes as they operate directly at the choice process level (behavioral data) rather than at the willingness level (attitudinal data).
The authors are not aware of any study that compares the results of these three approaches. Here, we shed light on the strengthens and weaknesses of each approach. Hopefully, this work enhances a more intensive and frequent use of the Heterogeneous Best-Worst method in modeling of the consumer decision process. We expect that this work provides a strong incentive to apply the Heterogeneous Best-Worst methods in market research studies as an alternative to the direct approach.
REFERENCES
Baumgartner, H. & Steenkamp, J. (2001) Response styles in marketing research: A cross-national investigation. Journal of Marketing Research, 38, pp. 143-156.
Cohen, S. & Markowitz, P. (2002) Renewing market segmentation: Some new tools to correct old problems. ESOMAR 2002, Amsterdam: ESOMAR.
Dias, J.G. & Vermunt, J.K. (2007) Latent class modeling of website users' search patterns: Implications for online market segmentation. Journal of Retailing and Consumer Services,
14, pp. 359-368.
Finn, A. & Louviere, J. (1992) Determining the appropriate response to evidence of public concern: The case of food safety. Journal of Public Policy and Marketing, 11, 1, pp. 19-25.
Fonseca, J.R.S. & Cardoso, M.G.M.S. (2007) Supermarket customers segments stability.
Journal of Targeting, Measurement and Analysis for Marketing, 15, 4, pp. 210-221.
Kamakura, W.A. & Russell, G.J. (1989) A probabilistic choice model for market segmentation and elasticity structure. Journal of Marketing Research, 26, November, pp. 379-390.
Louviere, J.J. (1994) Conjoint analysis. In Bagozzi, R. (Ed.), Advanced Methods of Marketing
Research. UK: Blackwell Publishers Ltd., pp. 223-259.
Louviere, J.J., Hensher, D.A., Swait, J.D. (2001) Stated Choice Methods: Analysis and
Application. New York: Cambridge University Press.
Marley, A. & Louviere, J. (2005) Some probabilistic models of best, worst and best-worst choices. Journal of Mathematical Psychology, 49, pp. 464-480.
McFadden, D. (1974) Conditional Logit Analysis of Qualitative Choice Behaviour. Frontiers
on Econometrics. P. Zarembka. New York, Academic Press, pp. 105-142.
Schwarz, G. (1978) Estimating the Dimenson of a Model. The Annals of Statistics, 6, pp. 461-464.
Swait, J., Louviere, J. J., & Anderson, D. (1995) Best worst conjoint: A new preference elicitation method to simultaneously identify overall attribute importance and attribute level partworths. Unpublished Working Paper. Department of Marketing, University of Florida.
Table 1. Influential attributes in choosing a Business School
Prestige/reputation Fit with the entrepreneurial world
Location
Quality of practical/technical Training/education Higher chances of employment
Timetable flexibility Parking facilities Academic environment Quality of theoretical training/education
Extracurricular activities Low fees
Canteen serving high quality meals Good Facilities/equipments
Figure 1. Best-Worst data collection procedure A B C D The most important attribute The least important attribute 1 Prestige/Reputation Location Quality of practical/ technical training/ education Extracurricular activities A B C D A B C D 2 Location
Fit with the entrepreneurial
world
Higher chances of
employment Low fees
A B C D
A B C D
3
Fit with the entrepreneurial
world
Quality of practical/ technical training/
education
Timetable flexibility Canteen serving high quality meals A B C D A B C D 4 Quality of practical/ technical training/ education Higher chances of
employment Parking facilities
Good facilities/ equipaments A B C D A B C D
5 Higher chances of employment Timetable flexibility environment Academic Prestige/Reputation A B C D
A B C D
6 Timetable flexibility Parking facilities Quality of theoretical
training/ education Location
A B C D
A B C D
7 Parking facilities Academic
environment
Extracurricular activities
Fit with the entrepreneurial world A B C D A B C D
8 environment Academic Quality of theoretical training/ education Low fees
Quality of practical/ technical training/ education A B C D A B C D
9 Quality of theoretical training/ education Extracurricular activities Canteen serving high quality meals Higher chances of employment A B C D A B C D
10 Extracurricular activities Low fees Good facilities/ equipaments
Timetable flexibility A B C D
A B C D
11 Low fees Canteen serving high
quality meals Prestige/Reputation Parking facilities
A B C D
A B C D
12 Canteen serving high quality meals Good facilities/ equipaments Location Academic environment
A B C D
A B C D
13 Good facilities/ equipaments Prestige/Reputation
Fit with the entrepreneurial world Quality of theoretical training/ education A B C D A B C D
Figure 2. Rating scale (direct method) data collection procedure
According a 10-points scale, in which 0 is ‘not important at all’ and 10 ‘very important’, please rate the importance of the following aspects when selecting the Business School in which you want to graduate:
Prestige/ Reputation ... |___|___| Location ... |___|___| Fit with the entrepreneurial world ... |___|___| Quality of practical/ technical training/ education ... |___|___| Higher chances of employment ... |___|___| Timetable flexibility ... |___|___| Parking facilities ... |___|___| Academic environment (relationships, colleagues, parties...) ... |___|___| Quality of theoretical training/ education ... |___|___| Extracurricular activities ... |___|___| Low fees ... |___|___| Canteen serving high quality meals ... |___|___| Good facilities/ equipments (computers, internet, library) ... |___|___|
Figure 3. BIC – Bayesian Information Criterion (HBW) 9300 9400 9500 9600 9700 9800 9900 0 1 2 3 4 5 BIC(LL)
Figure 4. Rankings based on the three methods 1 2 3 4 5 6 7 8 9 10 11 12 13 2 3 5 4 6 7 8 9 10 11 12 13 1 3 5 7 9 11 13 H ig h e r ch a n ce s o f e m p lo ym e n t Q u a li ty o f p ra ct ica l/ te ch n ica l tr a in in g / e d u ca ti o n F it w it h th e e n tr e p re n e u ri a l w o rl d P re st ig e / re p u ta ti o n Q u a li ty o f th e o re ti ca l tr a in in g / e d u ca ti o n G o o d fa ci li ti e s/ e q u ip m e n ts A ca d e m ic e n vi ro n m e n t L o w f e e s T im e ta b le f le xi b il it y L o ca ti o n E xt ra cu rr icu la r a ct ivi ti e s C a n te e n se rvi n g h ig h q u a li ty m e a ls P a rki n g f a ci li ti e s R a n ki n g HBW DM (0-10) and BW
Figure 5. Preferences: Stated (DM) vs Best-Worst values (BW and HBW) 0.00 0.05 0.10 0.15 0.20 0.25 0.30 0.35 0.40 H ig h e r ch a n ce s o f e m p lo ym e n t Q u a li ty o f p ra ct ica l/ te ch n ica l tr a in in g / e d u ca ti o n F it w it h th e e n tr e p re n e u ri a l w o rl d P re st ig e / re p u ta ti o n Q u a li ty o f th e o re ti ca l tr a in in g / e d u ca ti o n G o o d fa ci li ti e s/ e q u ip m e n ts A ca d e m ic e n vi ro n m e n t L o w f e e s T im e ta b le f le xi b il it y L o ca ti o n E xt ra cu rr icu la r a ct ivi ti e s C a n te e n se rvi n g h ig h q u a li ty m e a ls P a rki n g f a ci li ti e s DM HBW BW