Mafalda Inês Apolinário Pereira
Bachelor of Sciences in Chemical and Biochemical Engineering
Design of Peptides to Interfere with the
RANK-TRAF6 Pathway: An Integrated Approach
Dissertation to obtain the degree of Master in Chemical and Biochemical Engineering
Adviser: Doctor João Domingos Galamba Correia, Instituto Supe-rior Técnico, University of Lisbon
Co-adviser: Doctor Rita Lourenço Paiva de Melo, Instituto Superior Técnico, University of Lisbon
Examination Committee Chairperson:
Mafalda Inês Apolinário Pereira
Bachelor of Sciences in Chemical and Biochemical Engineering
Design of Peptides to Interfere with the
RANK-TRAF6 Pathway: an Integrated Approach
Dissertation to obtain the degree of Master in Chemical and Biochemical Engineering
Adviser: Doctor João Domingos Galamba Correia
Co-adviser: Doctor Rita Lourenço Paiva de Melo
Design of Peptides to Interfere with the RANK-TRAF6 axis: an Integrated Ap-proach
Copyright © Mafalda Inês Apolinário Pereira, Faculty of Sciences and Technology, NOVA University Lisbon.
The Faculty of Sciences and Technology and the NOVA University Lisbon have the right, perpetual and without geographical boundaries, to file and publish this dissertation through printed copies reproduced on paper or on digital form, or by any other means known or that may be invented, and to disseminate through scientific repositories and admit its copying and distribution for non-commercial, educational or research purposes, as long as credit is given to the author and editor.
This document was created using the (pdf)LATEX processor, based in the “novathesis” template[1], developed at the Dep. Informática of FCT-NOVA [2].
A c k n o w l e d g e m e n t s
I would like to thank my supervisors, Doctor João Domingos Galamba Correia and Doctor Rita Lourenço Paiva de Melo, for the efforts, suport and knowledge devoted to my learning over the course of 6 months, and for letting me explore the investigation fields of Biochemistry and Computational Chemistry in their research home.
Thanks also to my laboratory colleague Ruben Silva for all the help provided, and also to Doctor Célia Fernandes and Doctor Francisco Silva, who took precious time to help me and teach me to work with HPLC and mass spectrometry.
A very special thank you to my boyfriend and best friend, whose support, help and love have been phenomenal and crucial for this thesis dissertation.
A b s t r a c t
The RANK-TRAF6 pathway is involved in osteoporosis and in the development of breast cancer. One way to inhibit this pathway is to block TRAF6’s binding to RANK using decoy peptides. It is known by experimental data that a cell-penetrating decoy peptide (cpp) based on TRAF6-binding site mTRANCE-R(1) effectively inhibits this pathway because of its high affinity to TRAF6, whereas the TRAF6-binding site mTRANCE-R(2) does not. One of the goals of this work is to validate by in silico studies the stability of TRAF6 with five peptides, containing TRAF6-binding sites in human (hPEP1, hPEP2, PepH2-hTRANCE1) and mice (mPEP1, mPEP2).
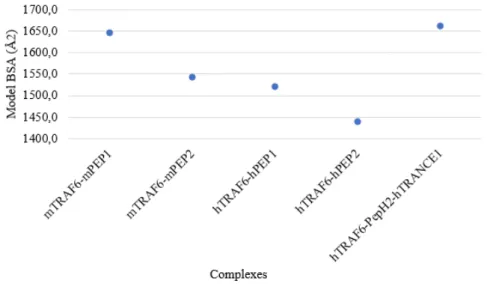
The stability of TRAF6 with the different peptides was accessed with two methods. The first method uses the complexes buried surface area (BSA) values, as a higher BSA indicates a higher complex stability. The results obtained with this method are in agreement with the experimental data, suggesting that the peptide with the sequence mTRANCE-R(1) has a higher affinity to TRAF6 than the peptide with the sequence mTRANCE-R(2), indicating that it is more stable with TRAF6. BSA(mTRAF6-mPEP1) > BSA(mTRAF6-mPEP2) and hPEP1) > hPEP2). BSA(hTRAF6-PepH2-hTRANCE1) > BSA(hTRAF6-hPEP1).
The other method uses an optimized HADDOCK score as a tool to predict binding affinity. These results are not in agreement with the literature and the ones determined by BSA studies, failing in validating the stability of TRAF6 with a peptide containing mTRANCE-R(1) and a peptide containing mTRANCE-R(2).
Peptides hTRANCE-R(1) and PepH2-hTRANCE1 (>99%) were prepared by man-ual Fmoc solid phase peptide synthesis followed by HPLC purification. In the PepH2-hTRANCE1 synthesis, besides the desired peptide, we also isolated a side product that was identified as the same peptide sequence with a Valine deletion. This peptide will also be used for future cancer cell studies. The secondary structure of the peptides was analysed by circular dichroism, showing the same fractions ofβ-sheet (0,4) and random coil (0,6) for all.
R e s u m o
A via RANK-TRAF6 está envolvida na osteoporose e no desenvolvimento do cancro da mama. Uma maneira de inibir esta via é bloquear a ligação do TRAF6 ao RANK, usando pequenos péptidos. Dados experimentais indicam que um péptido penetrante (cpp) con-tendo o local de ligação do RANK ao TRAF6, mTRANCE-R(1), inibe eficazmente esta via devido à sua elevada afinidade para o TRAF6, enquanto que outro péptido contendo o local de ligação do RANK ao TRAF6 mTRANCE-R(2) não. Um dos objetivos deste trabalho é validar, através de estudos in silico, a estabilidade dos complexos formados entre o TRAF6 e cinco péptidos que contém os locais de ligação do RANK ao TRAF6 em organismos de humano (hPEP1, hPEP2, PepH2-hTRANCE1) e de rato (mPEP1, mPEP2).
A estabilidade do TRAF6 com os diferentes péptidos foi estudada através de dois métodos.
O primeiro método utiliza os valores da área de superfície enterrada dos complexos (BSA), uma vez que uma BSA mais elevada indica uma maior estabilidade. Os resultados deste método estão de acordo com dados experimentais, sugerindo que o péptido com a sequência mTRANCE-R(1) tem uma maior afinidade para o TRAF6 do que o péptido com a sequência mTRANCE-R(2), indicando que forma um complexo mais estável com TRAF6. BSA (mTRAF6-mPEP1)> BSA (mTRAF6-mPEP2) e BSA (hTRAF6-hPEP1)> BSA (hTRAF6-hPEP2). BSA (hTRAF6-PepH2-hTRANCE1)> BSA (hTRAF6-hPEP1).
No segundo método é otimizada a equação utilizada pelo HADDOCK, servindo como uma ferramenta para prever a afinidade entre proteínas e péptidos. Estes resultados não estão de acordo com a literatura e com os resultados determinados através da BSA, não validando a estabilidade do TRAF6 com o péptido contendo mTRANCE-R(1) e o péptido contendo mTRANCE-R(2).
C o n t e n t s
xvii
Abbreviations xxv
1 Introduction 1
1.1 RANK-TRAF6 Pathway . . . 1
1.1.1 TRAF6 . . . 3
1.1.2 Decoy Peptides . . . 5
1.2 Protein Interactions . . . 7
1.2.1 Interface and Hot Spots. . . 7
1.2.2 Binding Affinity . . . 9
1.3 Computational Chemistry . . . 10
1.3.1 Tertiary Structure Prediction . . . 10
1.3.2 Molecular Docking . . . 13
1.4 Solid Phase Peptide Synthesis . . . 18
1.4.1 Circular Dichroism . . . 20
1.5 Objectives . . . 21
2 Methods and Materials 23 2.1 TRAF6 Sequence Conservation . . . 23
2.2 Interface & Hot Spots Prediction. . . 24
2.3 Tertiary Structure Prediction . . . 25
2.3.1 Structure Evaluation . . . 26
2.4 Molecular Docking . . . 27
2.4.1 HADDOCK Guru Protocol. . . 27
2.4.2 Complex Structure Evaluation. . . 28
2.5 Binding Affinity . . . 29
2.6 Peptide Synthesis . . . 30
2.6.1 Materials . . . 30
2.6.2 Synthesis and Characterization of the Peptides . . . 30
2.7 Peptide Purification . . . 33
2.8 Peptide Concentration . . . 33
CO N T E N T S
3 Results and Discussion 35
3.1 TRAF6 Sequence Conservation . . . 35
3.2 Active Residues . . . 36
3.2.1 Computational Alanine Scanning . . . 36
3.2.2 H-bonds . . . 38
3.2.3 Interface & Active Residues . . . 39
3.3 Tertiary Structure Prediction . . . 40
3.4 Molecular Docking . . . 41
3.4.1 hTRAF6-hPEP1 Cluster Analysis . . . 41
3.4.2 hTRAF6-hPEP1 Model Selection . . . 45
3.4.3 Complexes Model Selection . . . 47
3.5 Binding Affinity . . . 51
3.5.1 Buried Surface Area (BSA) . . . 51
3.5.2 Optimized HADDOCK Score . . . 53
3.6 Peptide Synthesis and Purification . . . 54
3.6.1 Circular Dichroism . . . 59
4 Conclusions and Perspectives 61
Bibliography 65
1.1 Complexes buried surface area. . . 7
1.2 Overall change in the binding free energy. . . 8
1.3 Kd reaction equation and formula.. . . 9
1.4 HADDOCK scoring function in the it0 stage. . . 15
1.5 HADDOCK scoring function in the it1 stage. . . 15
1.6 HADDOCK scoring function in the final stage. . . 15
1.7 Optimized HADDOCKscore.. . . 16
1.8 Intermolecular energy equation for HADDOCK output models. . . 17
2.1 X2function to be minimized. . . 30
2.2 Peptide concentration. . . 33
3.1 Percentage of active residues conserved in the interface. . . 46
L i s t o f F i g u r e s
1.1 Schematic illustration of NF-kB gene transcription. . . 1
1.2 Schematic overview of TRAF6 signalling pathway. . . 2
1.3 Non-scale illustration of human TRAF6 domain structure. . . 3
1.4 TRAF6-binding sites for TNFR family members and the TRAF6-binding motif. 4 1.5 Surface representation of TRAF6. . . 4
1.6 Crystal structure of TRAF-C domain of TRAF6 in complex with a human fragment of RANK. . . 5
1.7 Relationship between the log(Kd) and the BSA of peptide and protein-protein complexes. . . 9
1.8 Ab initioand heuristic methods for protein structure prediction. . . 10
1.9 Important dihedral angles . . . 11
1.10 Comparative Modelling Process . . . 12
1.11 Example of an amino acid chain with blue N and C terminal amino acid residues. . . 18
1.12 SPPS . . . 19
1.13 PS crosslinked with DVB . . . 20
1.14 Nihidrine reaction with the peptide’s free amine. . . 20
1.15 Poly-L-lysine circular dichroism spectra for the three main conformations. . 21
2.1 SPPS assembly. . . 31
2.2 Resin in the filter reaction vessel. . . 31
2.3 Kaiser test trail in two resin samples. . . 32
3.1 BLAST result in pairwise sequence alignment between hTRAF6 and mTRAF6. 35 3.2 mTRAF6 and hTRAF6 sequence alignment, with the active residues in red. . 37
3.3 H-bonds between hTRAF6 and RANK fragment. . . 39
3.4 Number of hydrogen bonds and participating residues in the 1LB5 complex. 39 3.5 hTRAF6 active and passive residues. . . 40
3.6 mTRAF6 tertiary structure. . . 41
3.7 HADDOCK score versus l-RMSDs for the hTRAF6-hPEP1 complex. . . 42
3.8 HADDOCK score versus i-RMSDs for the hTRAF6-hPEP1 complex. . . 43
L i s t o f F i g u r e s
3.10 BSA (Å2) versus the HADDOCK score for the 16 study structures representing the hTRAF6-hPEP1 complex. . . 44
3.11 hTRAF6-hPEP1 fit of the first model from each cluster. . . 45
3.12 Model3_2 aligned to complex 1LB5. . . 46
3.13 hTRAF6-hPEP2 fitting of the best models from the two first clusters.. . . 47
3.14 mTRAF6-mPEP1 fitting of the best models from the two first clusters. . . 48
3.15 mTRAF6-mPEP2 fitting of the best models from the two first clusters. . . 49
3.16 hTRAF6-PepH2-hPEP1 fitting of the best models from the two first clusters. 50
3.17 BSA (Å2) of the best chosen models.. . . 52
3.18 Average BSA (Å2) of each complex. . . 52
3.19 Correlation between the HADDOCK scores and log(Kpredicted). . . 54
3.20 TRANCE-R(1) ESI-MS before purification. . . 55
3.21 TRANCE-R(1) chromatogram after purification (analytical HPLC). . . 56
3.22 TRANCE-R(1) ESI-MS after purification. . . 56
3.23 PepH2-hPEP1 mass spectrum before purification.. . . 57
3.24 PepH2-hPEP1 chromatogram after purification. . . 57
3.25 PepH2-hPEP1 mass spectrum after purification.. . . 58
3.26 PepH2-hTRANCER1 (-V) mass spectrum after purification. . . 58
3.27 CD spectra for the three peptides synthesized. . . 60
A.1 Amino acids periodic chart. . . 77
A.2 Virtual alanine scanning from Robetta. . . 79
A.3 Virtual alanine scanning from KFC2. . . 81
A.4 Virtual alanine scanning from Hotpoint. . . 83
A.5 I-TASSER Model 1 quality score calculated by ProSA for peptide hPEP1.. . . 89
A.6 I-TASSER Model 2 quality score calculated by ProSA for peptide hPEP1.. . . 90
A.7 I-TASSER Model 3 quality score calculated by ProSA for peptide hPEP1.. . . 90
A.8 I-TASSER Model 4 quality score calculated by ProSA for peptide hPEP1.. . . 91
A.9 I-TASSER Model 5 quality score calculated by ProSA for peptide hPEP1.. . . 91
A.10 PEP-FOLD3 Model 1 quality score calculated by ProSA for peptide hPEP1. . 93
A.11 PEP-FOLD3 Model 2 quality score calculated by ProSA for peptide hPEP1. . 94
A.12 PEP-FOLD3 Model 3 quality score calculated by ProSA for peptide hPEP1. . 94
A.13 PEP-FOLD3 Model 4 quality score calculated by ProSA for peptide hPEP1. . 95
A.14 PEP-FOLD3 Model 5 quality score calculated by ProSA for peptide hPEP1. . 95
A.15 PEPstrMOD Model 1 quality score calculated by ProSA for peptide hPEP1. . 97
A.16 PEPstrMOD Model 2 quality score calculated by ProSA for peptide hPEP1. . 98
A.17 PEPstrMOD Model 3 quality score calculated by ProSA for peptide hPEP1. . 98
A.18 PEPstrMOD Model 4 quality score calculated by ProSA for peptide hPEP1. . 99
A.19 PEPstrMOD Model 5 quality score calculated by ProSA for peptide hPEP1. . 99
A.20 HADDOCK results for the complex hTRAF6-hPEP1. . . 105
L i s t o f F i g u r e s
A.22 Intermolecular energy versus i-RMSD for the hTRAF6-hPEP1 complex. . . . 109
A.23 I-TASSER Model 1 quality score calculated by ProSA for peptide hPEP2.. . . 113
A.24 I-TASSER Model 2 quality score calculated by ProSA for peptide hPEP2.. . . 113
A.25 I-TASSER Model 3 quality score calculated by ProSA for peptide hPEP2.. . . 114
A.26 I-TASSER Model 4 quality score calculated by ProSA for peptide hPEP2.. . . 114
A.27 I-TASSER Model 5 quality score calculated by ProSA for peptide hPEP2.. . . 115
A.28 I-TASSER Model 1 quality score calculated by ProSA for peptide mPEP1. . . 117
A.29 I-TASSER Model 2 quality score calculated by ProSA for peptide mPEP1. . . 117
A.30 I-TASSER Model 3 quality score calculated by ProSA for peptide mPEP1. . . 118
A.31 I-TASSER Model 4 quality score calculated by ProSA for peptide mPEP1. . . 118
A.32 I-TASSER Model 5 quality score calculated by ProSA for peptide mPEP1. . . 119
A.33 I-TASSER Model 1 quality score calculated by ProSA for peptide mPEP2. . . 121
A.34 I-TASSER Model 2 quality score calculated by ProSA for peptide mPEP2. . . 121
A.35 I-TASSER Model 3 quality score calculated by ProSA for peptide mPEP2. . . 122
A.36 I-TASSER Model 4 quality score calculated by ProSA for peptide mPEP2. . . 122
A.37 I-TASSER Model 5 quality score calculated by ProSA for peptide mPEP2. . . 123
A.38 I-TASSER Model 1 quality score calculated by ProSA for peptide PepH2-TRANCE1. 125
A.39 I-TASSER Model 2 quality score calculated by ProSA for peptide PepH2-TRANCE1. 125
A.40 I-TASSER Model 3 quality score calculated by ProSA for peptide PepH2-TRANCE1. 126
A.41 I-TASSER Model 4 quality score calculated by ProSA for peptide PepH2-TRANCE1. 126
A.42 I-TASSER Model 5 quality score calculated by ProSA for peptide PepH2-TRANCE1. 127
A.43 HADDOCK results for the complex hTRAF6-hPEP2. . . 133
A.44 HADDOCK results for the complex mTRAF6-mPEP1. . . 141
A.45 HADDOCK results for the complex mTRAF6-mPEP2. . . 152
A.46 HADDOCK results for the complex hTRAF6-PepH2-hPEP1. . . 161
A.47 Peptide hTRANCE-R(1) chromatogram before purification (preparative HPLC) 167
L i s t o f Ta b l e s
1.1 Potential therapeutic cell-penetrating peptides inhibit TRAF6 signaling . . . 6
1.2 CAPRI criteria for ranking models of protein-peptide complexes . . . 17
2.1 Peptide sequences to be studiedin silicoin complex with TRAF6, for human
and mouse complexes, and hTRANCE-R(1) (RANK’s binding site I) to be syn-thesized . . . 23
2.2 Peptides chemical formula and molecular weigh . . . 32
3.1 hTRAF6 hot spots and binding residues in PDB:1LB5 . . . 36
3.2 hTRAF6 and mTRAF6 residues used as active in molecular docking . . . 38
3.3 3 complexes considered “acceptable” from the first two clusters for hTRAF6-hPEP1 . . . 46
3.4 Models chosen for each complex, and the respective percentage of active residues conserved in the interface . . . 47
3.5 BSA (Å2) of the best chosen models and average BSA (Å2) . . . 51
3.6 Kd for each model selected in molecular docking. . . 54
3.7 Analytical data of the synthetized hTRANCE-R(1). . . 54
3.8 Analytical data of the synthetized PepH2-TRANCER1. . . 55
3.9 Peptide concentration and synthesis yield . . . 59
3.10 Deconvolutions of the spectra obtained in CD . . . 59
A.1 RANK hot spots and binding residues in complex with hTRAF6 . . . 85
A.2 hTRAF6 interface active residues for the PDB 1LB5 . . . 87
A.3 HADDOCK results of the first ranked cluster for complex hTRAF6-hPEP1 . 107
A.4 HADDOCK results of the second ranked cluster for complex hTRAF6-hPEP1 107
A.5 HADDOCK results of the third ranked cluster for complex hTRAF6-hPEP1 . 108
A.6 HADDOCK results of the fourth ranked cluster for complex hTRAF6-hPEP1 108
A.7 HADDOCK results of the fifth ranked cluster for complex hTRAF6-hPEP1 . 108
A.8 hTRAF6 interface residues divided by distances to the peptide hPEP1 for the best model . . . 111
A.9 HADDOCK results of the first ranked cluster for complex hTRAF6-hPEP2 . 135
A.10 HADDOCK results of the second ranked cluster for complex hTRAF6-hPEP2 135
L i s t o f T a b l e s
A.12 HADDOCK results of the first ranked cluster for complex mTRAF6-mPEP1. 143
A.13 HADDOCK results of the second ranked cluster for complex mTRAF6-mPEP1 143
A.14 mTRAF6 interface active residues for the mTRAF6-mPEP1 best models . . . 145
A.15 HADDOCK results of the first ranked cluster for complex mTRAF6-mPEP2. 153
A.16 HADDOCK results of the second ranked cluster for complex mTRAF6-mPEP2 153
A.17 mTRAF6 interface active residues for the mTRAF6-mPEP2 best models . . . 155
A.18 HADDOCK results of the first ranked cluster for the complex hTRAF6-PepH2-hPEP1 . . . 163
A.19 HADDOCK results of the second ranked cluster for the complex hTRAF6-PepH2-hPEP1 . . . 163
A b b r e v i a t i o n s
3D Three dimensional.
ACN Acetronitrile.
AIR Ambiguous interaction restraints. ASA Accessible surface area.
BC Breast cancer.
BLAST Basic Local Alignment and Search Tool. BSA Buried surface area.
CAPRI Critical Assessment of Predicted Interactions. CD Circular Dichroism.
Cpp Cell-penetrating peptide.
DCM Dichloromethane.
DIPEA N,N-diisopropylethylamine. DMF N,N-dimethylformamide. DVB Divinylbenzene.
Eint Intermolecular energie.
ESI-MS Electrospray ionisation mass spectrometry.
FCC Fraction of Common Contacts.
H-bonds Hydrogen bonds.
HADDOCK High Ambiguity Driven DOCKing.
A B B R E V I AT I O N S
IkB kB inhibitor.
I-TASSER Iterative Threading ASSEmbly Refinement. i-RMSD Interface root-mean-square-deviation. iL-RMSD Interface ligand RMSD.
ITC Isothermal titration calorimetry.
Kd Dissociation constant.
L-RMSD Ligand root-mean-square-deviation.
NF-kB Transcription nuclear factor kB.
OCs Osteoclasts.
PA Polyacrylamide. PEG Polyethylene glycol.
PPIs Protein-protein interactions. PR Progesterone receptors.
ProSA-web Protein Structure Analysis-web. PS Polystyrene.
RANK Receptor activator of NF-kB. RANKL RANK ligand.
RING Really Interesting New Gene.
RP-HPLC Reversed Phase High Performance Liquid Chromatography.
SA Structural Alphabet.
SPPS Solid phase peptide synthesis. SVM Support vector machine models.
TBM Template based modeling.
TD TRAF domain.
TFA Trifluoroacetic acid. TIS Triisopropylsilane. TNF Tumour necrosis factor. TNFR TNF receptor.
A B B R E V I AT I O N S
C
h
a
p
t
e
r
1
I n t r o d u c t i o n
1.1 RANK-TRAF6 Pathway
Protein-protein interactions (PPIs) mediate most cellular processes in the cell, such as differentiation, proliferation, signal transduction and cell death [1].
The transcription nuclear factor kB (NF-kB) is a dimeric protein that, bond to its in-hibitor IkB, is present inactively in the cell cytoplasm, being its pathway activated by an extracellular stimulus that allows it to enter the nucleus, bind to specific DNA genes and activate target genes expression that mediate cell differentiation, proliferation, survival, and the release of antimicrobial molecules and cytokines for immune response [2–4]. This differential gene expression control allows a variety of responses depending on the stim-ulus. The transcription factor NF-kB can be activated, among others, by many cytokines that signal through different cell surface receptors. Some cytokines are tumour necrosis factors (TNFs), multifunctional proinflammatory cytokines secreted predominantly by macrophages [5][6].
Figure 1.1: Schematic illustration of NF-kB gene transcription [7].
C H A P T E R 1 . I N T R O D U C T I O N
RANK binds to its ligand RANKL, a member of TNF cytokine family, activating an intra-cellular pathway that culminates with NF-kB activation [3][6][8].
RANK signalling can only activate NF-kB when mediated by TNF receptor-associated factors (TRAFs), adaptor proteins that bind to the cytoplasmic tail of TNFRs and allow intracellular signalling pathways [9][10].
There are seven different TRAF members in human and mice (TRAF1-TRAF7) but only TRAF6 is necessary and sufficient for RANK-induced NF-kB activation [9][11][12].
Figure 1.2: Schematic overview of TRAF6 signalling pathway [13].
In this way, RANKL signalling is followed by the RANK’s interaction with TRAF6, which in turn recruits the NF-kB inducing kinase IKK by intermediary factors [14].
This pathway controls osteoclastogenesis, inducing differentiation and activation of osteoclasts, responsible for bone destruction [15][16]. Thus, this pathway is required for the proper formation of cytoskeletal structures [9][17]. However, an increased osteoclast activation leads to osteoporosis, a decreased bone mass condition that causes skeletal abnormalities [18].
TRAF6 is also involved in the development of structures such as mammary glands [19–23]. Studies have shown that NF-kB is involved in the development of carcinomas, as breast cancer (BC), by NF-kB binding to DNA of the cancer cells [24–26]. Once NF-kB has an anti-apoptotic action, its activity during inflammation or infection prevents the elimination of mutated cells and enhances its proliferation [10].
1 . 1 . R A N K-T R A F 6 PAT H WAY
the bone microenvironment. Since RANKL is highly expressed in the bone marrow, is thought that chemo-attracts BC cells [22][29][30].
According to American Cancer Society (2017), BC represents 25% of all new cancer diagnoses in woman globally, which translate to hundreds of millions of women. Al-though treatments have been improved, some types of BC are still very aggressive, and bone metastasis in cancer patients increase the morbidity and mortality rates [31][32].
1.1.1 TRAF6
Human TRAF6 is a 522-amino acid protein, illustrated in Figure 1.3. TRAF1 up to TRAF6 have in common a specific region near the C-terminal denominated TRAF domain (TD), containing 180 residues responsible for TRAFs interaction with TNFR members, other proteins and kinases. TRAF6 protein sequence and phylogenetic studies revealed that it is the less conserved TRAF family member, despite maintaining all the structural characteristics of the other members of the family, sharing the smallest amount of homology to the prototypical TD because of the TRAF-C, a domain located in the TD that determines protein function, TRAF6’s TRAF-C shares only 30% sequence identity with the ones in TRAFs 1-5. Thus, TRAF6 does not share the same binding site as other TRAFs [10][27][33–36].
Figure 1.3: Non-scale illustration of human TRAF6 domain structure [19][37].
C H A P T E R 1 . I N T R O D U C T I O N
Structure sequence alignment of human and mouse TRAF6-binding sites presented in Figure 1.4, allowed to conclude that in RANK (TRANCE-R), and other members of the TNFR family, the TRAF6-binding motif, an amino acid sequence pattern that is widespread, is Pro-X-Glu-X-X-(aromatic/acid residue) [19][38–40]. Analysing RANK’s residues that contact TRAF6 when in a complex, the buried surface area (BSA, Å) is greater in the motif residues mentioned above. These residues are considered “hot spots”, which are essential for maintaining the integrity of the interface. The residue Glu is deter-mined to be in the positionP0, being the remaining hot spots in positionsP−2(Pro) andP3 (Ar/Ac) [19]. Isothermal titration calorimetry (ITC) measurements showed that peptides with acidic residues atP1andP2positions possess higher affinity to TRAF6 owing to their complementarity to the basic TRAF6 surface in that region (Figure1.5) [19].
Figure 1.4: TRAF6-binding sites for TNFR family members in human (h) and mouse (m) and the TRAF6-binding motif Pro-X-Glu-X-X-(aromatic/acid residue) [19].
1 . 1 . R A N K-T R A F 6 PAT H WAY
The TRAF6-RANK complex represented in the Figure1.6 is related to the TRAF-C domain of TRAF6 binding with hTRANCE-R(1).
Figure 1.6: Crystal structure of TRAF-C domain (blue) of TRAF6 in complex with a human fragment of RANK (PDB:1LB5) [41].
In the human TRAF6-RANK complex, Hong Ye, et al. described residues Arg392 and Pro468-Tyr473 of TRAF6 as important residues involved in the interaction. Moreover, residues Arg392, Phe471 and Tyr473 are considered hot spots.
1.1.2 Decoy Peptides
Inhibition of TRAF6 or a cell-penetrating TRAF6 decoy peptide decreases NF-kB sig-nalling pathway activity, reduces breast cancer proliferation, enhances apoptosis of can-cer cells, and reduces RANKL-mediated osteoclastogenesis and bone resorption [42][43]. Given the importance of TRAF6, it is rather important to design TRAF6 inhibitors in order to develop therapeutics for controlling inflammation and the discussed diseases.
C H A P T E R 1 . I N T R O D U C T I O N
Different cell-penetrating decoy peptides based on RANK-TRAF6 binding sites (Fig-ure 1.4) were testedin vitro to potentially inhibit TRAF6 signalling (Table 1.1), and some of them effectively inhibit NF-kB activation by blocking TRAF6 binding to RANK [19][46][47][48].
Table 1.1: Potential therapeutic cell-penetrating peptides inhibit TRAF6 signaling
TRAF6-binding site Peptide sequence Effectiveness References
mTRANCE-R(1) AAVALLPAVLLALLAP-RKIPTEDEYTDRPSQPST High [19]
mTRANCE-R(2) AAVALLPAVLLALLAP-IPPFQE
PLEVGEND Low [19] mTRANCE-R(1) AAVALLPAVLLALLAP-RKI
PTEDEYTDRPSQPST High [46] mTRANCE-R(1) J-RKIPTEDEYTDRPSQ Medium [47]
mTRANCE-R(1) J-RKIPTEDEYTDR Medium [47]
mTRANCE-R(1) J-RKI
PTEDEY High [47]
mTRANCE-R(1)
J-PTEDEY Null [47]
mTRANCE-R(1) J-PTEDEYTDR Null [47]
hTRANCE-R(1) AVALLPAVLLALLAP-RQMPTEDEY High [48]
The peptide sequences comprise two parts: the first residues belong to the cell-penetrating sequence and the second part contains the residues of the TRAF6-binding site. Two different cell-penetrating peptides (cpp) were tested: AAVALLPAVLLALLAP, a hydrophobic sequence of the Kaposi fibroblast growth factor signal peptide; and J which represents palmitic acid, linked to the N-terminus as a way to internalize the peptide by making a smaller scaffold.
Ye et al. showed that only mTRANCE-R(1) is an effective inhibitor, not registering NF-kB activation and decreasing osteoclasts formation [19]. As mentioned in the subsection
1.1.1, this is explained by the degree of complementarity between TRAF6’s basic surface with the peptidesP1andP2positions, whose binding to TRAF6 is stronger if occupied by acidic residues. In fact, the residues at the positionsP1(Valine) andP2 (Glycine) in mTRANCE-R(2) are not acid, different from the residues at the positionsP1 (Aspartic Acid) andP2(Glutamic Acid) of mTRANCE-R(1) [19].
1 . 2 . P R O T E I N I N T E R AC T I O N S
with less extent [47].
1.2 Protein Interactions
Most cellular proteins form complexes, requiring specific interactions that became the basis for almost all biological process as signal transduction [49]. PPIs can be homomeric or heteromeric (constituted by identical or different molecules, respectively), and can be classified as either obligate - strong and long lived - or non-obligate - weaker and transient [50]. Various factors influence proteins interactions, like shape complementarity, electrostatic complementarity, hydrophobicity and flexibility [50–54].
1.2.1 Interface and Hot Spots
PPI studies commonly requires a deeper understanding of their structure by regions, such as the surface, the interior and the interface, the latter defined as a set of amino acids which represents a region that links two chains by non-covalent interactions [55].
During the protein folding process, the physical process by which a polypeptide folds into its characteristic and functional tertiary structure, hydrophobic residues shield them-selves from the solvent, resulting in a hydrophobic protein interior and a hydrophilic surface [56]. The basic description of the protein surface is the atomic layer of exposed residues [57]. This distinction between interior and surface residues has profound impli-cations in stability and evolution, as residues at the surface of proteins are more likely to mutate than those that are buried, once mutations in the protein interior are more destabilizing to its structure and function [53][55][58–63].
This surface-interior contradistinction coming from protein folding can be applied to protein-protein or protein-peptide interfaces, where the BSA (equation1.1) is defined as the surface buried away from the solvent when a complex is formed [64–67].
BSA= NXcomp
n=1
ASAnf ree−ASAcomplex (1.1)
Equation 1.1: Complexes buried surface area (Å2).
Where:
ASAnf reeindicates the accessible surface area of the unbound molecules (Å2); ASAcomplexindicates the accessible surface area of the complex (Å2);
Ncompindicates the total number of free components in the complex;
nis relative to the free reactant.
C H A P T E R 1 . I N T R O D U C T I O N
are a small subset of the buried residues that mostly contribute to the binding affinity, defined as the strength of these interactions [68]. Not only are hot spots structurally con-served, mutating at a slower rate when compared to other surface residues, core residues in general are more evolutionary conserved than those at the rim [69–76]. To know which residues are structurally and evolutionary conserved, sequence alignment is fundamen-tal to infer homology (common ancestry) between two proteins. If two sequences are in alignment and part or all the polypeptides pattern match, then they are similar and may be homologous. Moreover, if the sequence of a protein significantly matches another sequence with a known structure and function, then the molecules may share the same structure and function as well [77].
PPI interfaces differ from their type of obligation, as non-obligate PPI interfaces are typically smaller than obligate PPI interfaces [78]. An area between 1150–1200Å2 is considered small, standard-size interfaces are roughly 1600Å2 (+/- 400Å2) and a large interface bury 2000 to 4660Å2[66][79].
A part of structural analysis of a 3D macromolecular complex is the annotation of the intermolecular interactions present in the interface [80]. The cut-offs for inter-residue interactions range from 5 to 14Å, depending on the literature, so non-covalent interac-tions do not have a consensus on geometrical definition [81–84]. The only consensus is in hydrophobic contacts, defined between atoms within 5Å from each other [85]. Besides hydrophobic contacts, hydrogen bonds (H-bonds) are the most important in defining a stable contact between a protein and its binding partner [86]. Because interfaces consist in a central desolvated region surrounded by energetically less important residues in con-tact with water, an appropriate approach to obtain information on which residues belong to the interface is mutagenesis, the mutation of a residue followed by the observation of its consequence in protein stability [66]. One example of this approach is Alanine scanning, which is based on the principle that when a residue is mutated by this amino acid, getting rid of side chain atoms beyond Cβ, a loss of binding affinity indicates that the mutated residue mediates the interaction between molecules, and therefore is present in the interface [87]. Alanine is used because is viewed as neutral, once its relatively inert methyl functional group does not contribute additional flexibility [88–90].
For all proteins, the energy distribution is not uniform across the interface, as a small subset of residues will have a more significant contribution to the binding [68][73][74][91–
95]. Hot spots have been defined as sites where Alanine mutations cause a significant decrease in the binding energy (∆∆G). In equation1.2, the∆Gmutis the binding energy with the alanine substituted and∆Gwt is referent to the wild type residues in the protein complex [91][96].
∆∆G=∆Gmut−∆Gwt (1.2)
1 . 2 . P R O T E I N I N T E R AC T I O N S
1.2.2 Binding Affinity
Protein interactions play an important role in living cells, and their stability and affinity affects the cell’s function [58][97].
The binding affinity is associated with the dissociation constant (Kd), an experimental measure that determines whether an interaction occurs in solution (lowKd) or not (high Kd). Kd equation (Equation1.3) consists on the dissociation of a complex (PL) into its unbound molecules, the ligand (L) and the protein (P) [98].
PL→
Kd
P+L
Kd =[P][L] [PL]
(1.3)
Equation 1.3:Kd reaction equation and formula.
Where:
Kd is the dissociation constant (M);
[P] is the concentration of the protein (M); [L] is the concentration of the ligand (M); [PL] is the concentration of the complex (M).
Jieming Chen et al. demonstrated that for protein-protein and protein-peptide com-plexes there is a correlation between binding affinity and the amount of buried surface area at the interface (Figure1.7), indicating that as the BSA increases, theKd decreases,
which means that the affinity increases [97]. In conclusion, as BSA increases the bind-ing affinity also increases. This correlation will be used as a tool to molecular docking analysis.
Figure 1.7: Relationship between the log(Kd) and the BSA of protein-peptide (magenta
C H A P T E R 1 . I N T R O D U C T I O N
1.3 Computational Chemistry
Computational chemistry combines chemical theory and model experimental data, us-ing mathematical algorithms, statistics and databases. It is an important field to validate results and for the design of new experiments and materials. For example, computational chemistry is used to simulate and identify protein sites that most probably bind to a new molecule as drug, to determinate properties that are not accessible experimentally and to interpret experimental data [99].
The analysis and the prediction of the protein-peptide mechanism, and the conse-quent design of novel protein-peptide complexes, have been applied in the fields of biology, medicine and pharmaceutical sciences [100].
The modelling of protein-peptide complexes is most often approached in two steps, firstly by identifying the peptide binding site on a protein and lastly determining the native pose of the peptide [100].
1.3.1 Tertiary Structure Prediction
Mapping the molecular details of individual proteins and their interactions with each other and with small molecules is crucial to understand life at the molecular level. Drug design and protein engineering are highly related to protein interactions and struc-ture–function relationships, which can only be understood if proteins 3D structure is determined [101].
There are two main computational alternatives to predict tertiary structures of pro-teins and peptides from sequence data (Figure1.8) [77].
1 . 3 . COM P U TAT I O N A L C H E M I S T RY
Ab Initio
This approach involves methods that rely on molecular physics without knowledge of any biologic relationship between the target structure and other proteins/peptides [97].
The shape of a protein/peptide can be defined as a function of the amino acid sequence (primary structure), the temperature, the pressure, the pH, among others. Having only the primary structure, the secondary structure is designed having into account bond lengths, bond angles and dihedral angles [77].
Dihedral angles, refer to the torsion of two planes defined by the two atoms that form the bond, being in this way four atoms involved in total (2 atoms in each plane). There are three dihedral angles for each residue that define the backbone of a polypeptide (Figure
1.9) [77].
Figure 1.9: Important dihedral angles [77].
The omega (Ω) Cβ and N angle assumed constant at 180º; the psi (ψ) Cα and Cβ angle, restricted due to the interaction of side chain residues; and the phi (φ) N and Cα angle, restricted for the same reason as the psi angle.
Furthermore, to generate the tertiary structure techniques such as molecular dynam-ics, Monte Carlo and Rosetta are needed. The first uses Newtonian physics to calculate atom force and moves that atom in a short fraction of time, so the final structure has the most stable molecular conformation. The Monte Carlo method identifies structural com-binations with the lowest free energy, by repeating structure construction simulations, clustering the resulting structures and choosing the one that is in the centre of the largest clusters. Finally, Rosetta is a hybrid method, where the target is broken into chains of three and nine residues, and the conformations of these segments are limited and created with fragment libraries extracted from protein structure databases. The combination of local conformations with the lowest overall energy is taken as a candidate structure [77].
Ab initiomodelling will be used to predict the tertiary structure of the five inhibitor peptides.
Heuristic methods
C H A P T E R 1 . I N T R O D U C T I O N
the knowledge of existing protein structures combined in databases as templates, and as-suming that changes in amino acid sequences may not alter protein structure as similarity in sequences implies similarity in structure [77].
Heuristic methods are based on comparative modelling, which finds similarities in amino acid sequence not having into account the protein’s lineage. Homology modelling is another heuristic method similar to comparative modelling but takes into account the protein’s lineage and assumes that proteins from the same families share folding motifs, even if they have different sequences [77]. Comparative modelling will be the one considered for this project, once it is the main method used.
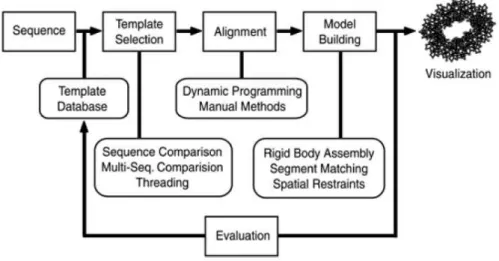
Figure1.10shows the main phases of comparative modelling, given protein sequence data.
Figure 1.10: Comparative Modelling Process [77].
The search for a template in a database that could be a match to the target structure is based on the amino acid sequence. The template could have similar amino acid sections with the target, and so the structure of those sections is considered the same for the target [77].
The comparison threading involves the sequence alignment of the target with the 3D structure of the template and compare the spatial and chemical similarity. Only the templates that fit these parameters are potential templates. One way to do threading is based on contact potential, where the position of amino acids and the resulting association energy are evaluated, being only considered energetically stable conformations for target structure representation [77].
1 . 3 . COM P U TAT I O N A L C H E M I S T RY
formed by structural areas coming from different templates, once in this way each area of the target assembly has the most similar conformation possible to the sequence [77].
Finally, the models created are evaluated given their final accuracy. The greater the similarity between the model and the template, the more likely the model is an accurate structure prediction.
Comparative modelling will be used to predict the tertiary structure of the mice TRAF6’s TRAF-C. The ModBase1database of comparative protein structure models will be used to this end, where comparative modeling is only applicable when the target sequence is detectably related to a known protein structure, and it is carried out in four sequential steps [102]:
• Identifying known structures (templates) related to the sequence to be modelled (target);
• Aligning the target sequence with the templates;
• Building model;
• Assessing the models.
1.3.2 Molecular Docking
Molecular docking is a computational method that aims to study complexes formed between two or more molecules, starting from several possible conformations, which can be either experimentally determined or predicted [100]. The docking method is based on the complementarity between interacting molecules, which could be geometric, electro-static or hydrophobic, or all three [57]. It can be divided in two main steps [1][103][104]:
1. Sampling: Exploration of binding poses;
2. Scoring: Identification of the best biological models.
This methodology allows a pre-selection of the most potential compounds to be syn-thesized, which involve techniques known to be time-consuming and resource-intensive [105].
The experimental determination of high-resolution biomolecular complexes atomic structures is usually time-consuming and expensive. Moreover, flexibility of the peptides and their transient interactions, along with the fact that they do not adopt a well-defined conformation when unbound, make the recognition of these complex mechanisms dif-ficult to study experimentally [106]. Therefore, integrated with x-ray crystallography and nuclear magnetic resonance (NMR) spectroscopy, molecular docking has become an
C H A P T E R 1 . I N T R O D U C T I O N
important tool in designing novel potential drugs, allowing the modulation of three di-mensional (3D) complexes constituted by a target (protein or nucleic acids) and a ligand (peptide, protein or small organic molecule), and study their interactions [100][103][107].
In molecular docking, there are two main strategies that can be followed: ab initio and template-based modelling (TBM) [108]. Although most docking methods are ab initio, which only considers the coordinates of the starting structures disregarding any experimental knowledge about the system, TBM, whenever 3D structures of complexes with the homologs of the structures to be docked are available, is the best alternative [109][110]. Moreover, the conservation of interfaces across homologous complexes can improve docking [111].
Furthermore, it is also possible to do molecular docking with residue restraints, evi-dencing their presence in the interface or the distance between them [112].
1.3.2.1 High Ambiguity Driven DOCKing
HADDOCK (High Ambiguity Driven DOCKing) is a web server that incorporates experimental data as restraints and uses them to guide the docking process alongside traditional energetics and shape complementarity [113].
One of the most important parts in HADDOCK is the ambiguous interaction restraints (AIR), which are defined by active and passive residues [1]:
1. Active residues: are those of main importance for the interaction, such as residues whose absence enables the interaction between molecules or those where the chem-ical shift perturbation is higher. Throughout the molecular docking process, active residues are restrained to be part of the interface;
2. Passive residues: are those that contribute for the interaction but are less important and only might be at the interface.
AIRs are created between each active residue of a partner and the combination of active and passive residues of the other partner. The scoring penalty is a critical tool to define conveniently active and passive residues, directly influencing the molecular docking success if active residues are defined and that do not belong to the interface. Def-inition of a very strict set of AIRs leads to a very narrow sampling of the conformational space, meaning that the generated poses will be very similar. Conversely, very sparse restraints (e.g. the entire surface of a partner) will result in very different solutions, dis-playing greater variability in the region of binding [1]. So, if the restraints are wrong, the true interface might never be sampled.
1 . 3 . COM P U TAT I O N A L C H E M I S T RY
To allow the molecules to experience varying degrees of flexibility and chemical envi-ronments, HADDOCK protocol consists of three stages [1][106]:
1. "it0": Rigid-body docking by energy minimization from random orientations of the starting conformations;
HADDOCKscore−it0 = 0.01Evdw+ 1.0Eelec+ 1.0Edesol+ 0.01Eair−0.01BSA (1.4)
Equation 1.4: HADDOCK scoring function in the it0 stage.
2. "it1": Semi-flexible refinement of the interface, being the protein interface and the ligand treated as flexible;
HADDOCKscore−it1 = 1.0Evdw+ 1.0Eelec+ 1.0Edesol+ 0.1Eair−0.01BSA (1.5)
Equation 1.5: HADDOCK scoring function in the it1 stage.
3. "water": Molecular dynamics refinement in solvent to further improve scoring, sol-vating the complex in a shell of water molecules.
HADDOCKscore−water= 1.0Evdw+ 0.2Eelec+ 1.0Edesol+ 0.1Eair (1.6)
Equation 1.6: HADDOCK scoring function in the water (final) stage.
Where:
Evdwis the non-bonded intermolecular van der Waals energy (adimensional); Eelecis the non-bonded intermolecular electrostatic energy (adimensional); Edesolis the empirical desolvation energy term (adimensional);
Eairis the AIR energy (adimensional); BSAis the buried surface area (Å2).
HADDOCK ranks the output clusters with the scoring function 1.6, based on the average score of the top 4 members of each cluster [116]. The cluster numbering reflects the size of the cluster, with cluster 1 being the most populated cluster [1][113].
In protein-peptide interfaces, the recognition of long-range electrostatic interactions is very important [117]. Therefore, it should be specified charged N and C terminals when working with naturally occurring peptides, or uncharged terminal(s) when the peptide is a protein fragment, avoiding undesired interaction with the terminal(s) [106].
C H A P T E R 1 . I N T R O D U C T I O N
measure that captures conformational changes about the interface by fitting on the inter-face of the receptor and calculating the RMSDs on the interinter-face of the smaller partner. The other is the Fraction of Common Contacts (FCC), grouping models based on the similarity of their contact networks at the interface [1]. By default, a cluster is defined if a minimum of 4 models fall into the same group.
There is also statistics analysis of energetic terms and other structural measures for each cluster as the z-score, a quality measure parameter given by HADDOCK that in-dicates how many standard deviations from the average HADDOCK score a cluster is located, so the more negative the z-score, the better it is [106][113].
HADDOCK has also been used as a tool to predict binding affinity. This approach consists on a multiple linear regression analysis used to create an optimized HADDOCK score (1.7) [118].
log(Kpred) =HADDOCKscore
=β1Evdw+β2Eelec+β3Edesol+β4Eair+β5BSA+f (1.7)
Equation 1.7: Optimized HADDOCKscore.
Where:
Log(Kpred)is the logarithm base 10 of the predicted dissociation constant of the peptides. Evdwis the non-bonded intermolecular van der Waals energy (adimensional);
Eelecis the non-bonded intermolecular electrostatic energy (adimensional); Edesolis the empirical desolvation energy term (adimensional);
Eairis the AIR energy (adimensional); BSAis the buried surface area (Å2); βi andf are constants.
1.3.2.2 Docking assessment
The difference among clusters considering the HADDOCK score and z-score allows a quick assessment of the quality of the generated models and the overall molecular docking simulation [1][113].
The docked models that have a reference structure are qualitative evaluated according to the CAPRI (Critical Assessment of Predicted Interactions) parameters. CAPRI is a communitywide experiment on the comparative evaluation of protein-ligand docking for structure prediction, where typically given the structure or the sequence of the unbound partners the aim is to predict the correct 3D structure of an unknown biomolecular protein-ligand complex in a limited time [57][116][119]. For peptide-protein complexes the parameters are [120]:
1 . 3 . COM P U TAT I O N A L C H E M I S T RY
2. Interface root-mean-square-deviation (i-RMSD): calculated on backbone atoms of both protein and peptide residues which are within 8Å from each other in the reference crystal structure of the complex;
In bioinformatics, the root-mean-square deviation (RMSD) of atomic positions is the measure of the average distance between the atoms (usually the backbone atoms) of superimposed proteins. CAPRI criteria for ranking models of protein-peptide complexes is present in the Table 1.2 [120]. This previous analysis is very important since it is possible to produce false positives, i.e., structures with good scores but high RMSDs [121].
Table 1.2: CAPRI criteria for ranking models of protein-peptide complexes
Incorrect Acceptable Medium High L-RMSD (Å) >5.0 5.0 - 2.0 2.0 - 1.0 1.0≥
i-RMSD (Å) >2.0 2.0 - 1.0 1.0 - 0.5 0.5≥
Although the RMSD value provides a quantitative measure of fit, visualizing the overlap of structure pairs is more intuitive and provides information on the difference in what the RMSD value represents in each case [77].
It is also possible to evaluate and rank clusters considering its intermolecular energies, considering equation1.8[115].
Eint=Eelec+Evdw+Eair (1.8)
Equation 1.8: Intermolecular energy equation for HADDOCK output models.
Where:
Eintis the intermolecular energie (adimensional);
C H A P T E R 1 . I N T R O D U C T I O N
1.4 Solid Phase Peptide Synthesis
Peptides are short amino acid sequences up to 30 or 50 amino acids, depending on the literature source. They result from sequencial reactions of theα-carboxyl group of one amino acid with theα-amino group of another amino acid in a successive manner, forming peptidic bonds (Figure1.11). What distinguishes a peptide from a protein is not only the number of amino acids but also its physicochemical properties [122][123].
Figure 1.11: Example of an amino acid chain with blue N and C terminal amino acid residues, both onα carbon [124].
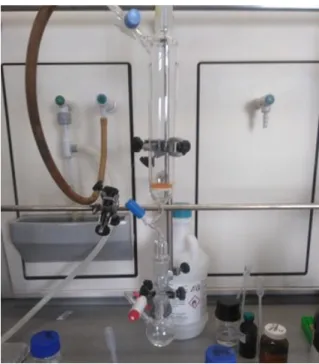
Solid phase peptide synthesis (SPPS) is a method based on the sequential addition of protected amino acid residues to an insoluble polymeric matrix (resin), through the carboxyl group of the first amino acid anchored, via a linker, to the resin in a covalent manner. Hence, the peptide grows in the C to N direction [125]. Two different strategies for SPPS can be followed: the Boc-SPPS which resorts to the use of a t-butyloxycarbonyl (Boc) to protect theα-amino group of the amino acids, and the Fmoc-SPPS in which the α-amino is protected with a flurenylmethoxycarbonyl group (Fmoc). The Boc group is removed by an acid, normally hydrofluoric acid (HF), whereas the Fmoc group is removed with a base [126]. The Boc-SPPS methodology was the first to be used, but the Fmoc-SPPS is the most used nowadays, as it does not require the use of HF, which makes it safer and easier to automatize [125]. In this thesis we have used Fmoc-SPPS and piperidine for Fmoc deprotection [127]. The overall process is shown in Figure1.12.
The side chains of some amino acids are protected as well but in a different manner from theα-amino groups, while the protection of theα-amino group is temporary, so the next amino acid could be linked to one already in the resin, the protection of the side chains is "permanent", being only removed when the peptide is cleaved from the solid support (Figure1.12).
The synthesis consists in a set of cyclic steps [126]:
• Cleavage of theα-amino protecting groups;
• Washing to remove the cleavage reagent;
• Coupling of the protected amino acid;
1 . 4 . S O L I D P H A S E P E P T I D E S Y N T H E S I S
Figure 1.12: SPPS [127].
Dichloromethane (DCM) and N,N-dimethylformamide (DMF) are the primary sol-vents used for resin deprotection, coupling and washing [128].
The final step is the cleaveage of the peptide from the resin, usually with trifluo-roacetic acid (TFA). The resulting peptide could have a carboxamide group or carboxylic acid at its C-terminus, or other functional group like a alcohol group, depending on the linkeror the type of the resin used. The final product contains the desired peptide and impurities that must be removed, such as deletion peptides, incompletely deprotected peptides, modified peptides, scavengers and by-products [128]
C H A P T E R 1 . I N T R O D U C T I O N
PS crosslinked with 1% divinylbenzene (DVB) (Figure1.13) is the most used resin in SPPS, because it is chemical inert, allows the introduction of a large variety of an-choring groups and swells easily with the right solvents [127]. Having this into account, and because polystyrene resins are normally employed for batch-wise synthesis (the one performed in this project), this type of resin was used for SPPS [128].
Figure 1.13: [130].
To control the manual SPPS, we have performed a qualitative color test to monitor the completeness of amino acid coupling and the presence of free amine after deprotection [131][132]. This test (Kaiser test) consists in the reaction of ninhydrin with free primary amines, generating an intensive blue color, which indicates that the amine group in free and another amino acid can be coupled. By the contrary, when an amino acid is coupled and the amine group is not free, the color of the solution stays yellow, indicating that the amino acid coupling is complete [133]. The test does not yield the typical dark blue color with serine, asparagine, aspartic acid, and proline (that as a secondary amine) [132]. Only the latter two exist in the peptides that are going to be synthesized.
Figure 1.14: Nihidrine (first molecule) reaction with the peptide’s free amine [132].
1.4.1 Circular Dichroism
1 . 5 . O B J E C T I V E S
Figure 1.15: Poly-L-lysine circular dichroism spectra for the three main conformations [135].
1.5 Objectives
The work presented herein aims at the design of innovative peptides able to interfere with the RANK-TRAF6 interaction, which is a relevant PPI, with a key role in the NF-kB regulation.
As already mentioned in the subsection1.1.2, only the cell-penetrating peptide with mTRANCE-R(1) inhibits effectively the TRAF6-RANK pathway. A computational frame-work that combinesab initiomodelling, comparative modelling and molecular docking will be performed to clarify peptide-TRAF6 interactions by structural and energetic anal-ysis. The goal is to validate by in silico studies the stability of TRAF6 with a peptide containing mTRANCE-R(1) and a peptide containing mTRANCE-R(2). Throughout this document, this peptide will be refered as mPEP1 and mPEP2, respectively, and the com-plexes as mTRAF6-mPEP1 and mTRAF6-mPEP2, (m) representing "mouse". The stability of TRAF6 with a peptide containing R(1) and a peptide containing hTRANCE-R(2) will also be evaluated. Throughout this document, these peptides will be refered as hPEP1 and hPEP2, respectively, and the complexes as hPEP1 and hTRAF6-hPEP2, (h) representing "human".
Firstly we will model the peptide sequences and determine the active residues present in the TRAF6-RANK complex, necessary for molecular docking, which will be made using HADDOCK. The stability of TRAF6 with the different peptides will be accessed with two methods, one using the BSA values of the complexes and the other using the HADDOCK optimized score as a tool to predict binding affinity.
C H A P T E R 1 . I N T R O D U C T I O N
and accumulating inside cells. This peptide, designated PepH2, will also be linked to hTRANCE-R(1), giving the fusion peptide PepH2-hPEP1. A comparative study will be performed between this peptide and hPEP1, as it would be interesting to compare byin silicostudies the stability of TRAF6 with a peptide containing PepH2 towards hTRAF6 with the peptide containing the Kaposi fibroblast growth factor signal peptide towards hTRAF6.
C
h
a
p
t
e
r
2
M e t h o d s a n d M a t e r i a l s
Among the human peptide sequences proposed (hPEP1, hPEP2 and PepH2-hPEP1), the one that gives the most stable complex with TRAF6 in silico will be synthesized, along with hTRANCE-R(1) (RANK’s binding site I). The Table 2.1 lists the five pep-tide sequences that are going to be studied in silico in complex with TRAF6, and also hTRANCE-R(1).
Table 2.1: Peptide sequences to be studiedin silicoin complex with TRAF6, for human and mouse complexes, and hTRANCE-R(1) (RANK’s binding site I) to be synthesized
Peptide nomenclature Peptide sequence Complex
hPEP1 AAVALLPAVLLALLAP-RQMPTEDEY hTRAF6-hPEP1
hPEP2 AAVALLPAVLLALLAP-FSEPLEVGE hTRAF6-hPEP2
mPEP1 AAVALLPAVLLALLAP-RKIPTEDEY mTRAF6-mPEP1
mPEP2
AAVALLPAVLLALLAP-FQEPLEVGE mTRAF6-mPEP2
PepH2-hPEP1 KLFMALVAFLRFLT-RQMPTEDEY hTRAF6-PepH2-hPEP1
hTRANCE-R(1) RQMPTEDEY
-2.1 TRAF6 Sequence Conservation
C H A P T E R 2 . M E T H O D S A N D M AT E R I A L S
Aiming to evaluate sequence conservation (homology) between both sequences (mTRAF6 and hTRAF6), an alignment of both sequences was performed. This method involves the matching of two sequences and finding the best alignment of two sequences with some degree of similarity. The chosen alignment is typically based on a score that reflects the number of paired characters in the two sequences and the number and length of gaps required to adjust the sequences [77]. For this purpose, the web-based heuristic tool BLAST1(Basic Local Alignment and Search Tool) was used.
2.2 Interface & Hot Spots Prediction
In order to identify the hot spots and important residues, besides the ones already mentioned in the subsection1.1.1, and to validate that information as well, computational alanine scanning was performed with the RANK-TRAF6 3D crystal structure retrieved from the PDB (PDB Code: 1LB5) [19]. Several web servers were used to get a consensus result in hot spots prediction and important interfacial residues identification:
• Robetta Beta2
Robetta is an energy-based computational method that considers Van der Waal poten-tial, Coloumb electrostatics, solvation energy and hydrogen bonds [136].
As an output, positive values for the∆∆Gcomplex indicate that alanine mutation is predicted to destabilize the complex, which means that the residues are important for the binding, and∆∆Gcomplex negative values predict a stabilizing effect. Hot spot residues have a predicted∆∆Gcomplex> 1 kcal/mol [96].
This analysis allows knowing besides which residues are hot spots, but also other residues that may be involved in the binding site. Robetta cannot identify hot spots that are involved in water-mediated hydrogen bonds, and when waters can compensate for a mutation, it will incorrectly predict mutations as hot spots, so the input PDB cannot have water molecules [96].
• KFC23
KFC2 is a machine learning-based method that incorporates two support vector ma-chine models (SVM): KFC2a and KFC2b. KFC2a is composed by eight features primarily related to solvent accessibility, interface position, packing density, and local plasticity, and the specific features of KFC2b are residue size and hydrophobicity. KFC2b has a higher specificity as it predicts less number of hot spot residues but with higher accuracy, and KFC2a predicts a larger number of hot spot residues but with lower accuracy [137].
Thus, KFC2a has higher reported sensitivity and accuracy when compared to KFC2b, but KFC2b has higher specificity [96].
1https://blast.ncbi.nlm.nih.gov/Blast.cgi 2http://robetta.bakerlab.org/
2 . 3 . T E R T I A RY S T R U C T U R E P R E D I C T I O N
These structural features return a binary answer as to whether a residue is a hot spot or a interface residue, and a confidence score with each prediction is given. KFC2 labels a residue a hot spot if the prediction confidence is greater than zero. When KFC is combined with Robetta’s computational alanine scanning technique described previously, the predictive accuracy increases significantly [96].
• Hotpoint4
Hotpoint is an empirical model that characterizes the interface and hot spot residues on the basis of accessible surface area (ASA) and knowledge-based pairwise residue con-tact potential of the interface, labelling a hot spot if the relative accessible surface area is up to 20% and the total pair potential is greater or equal to 18.0 [96][138].
2.3 Tertiary Structure Prediction
The peptides structures used in this study are unknown. Therefore their tertiary structures were predicted byab initiomethods, relying on three web-servers picked based on their accuracy, diversity and capacity to accept small amino acid sequences (23 and 25 residues) as a input.
The selected web-servers are briefly explained below:
• I-TASSER5
Iterative Threading ASSEmbly Refinement (I-TASSER) is a hybrid approach for pro-tein structure prediction based on the comparison modelling andab initioMonte Carlo folding [139][140]. Firstly, I-TASSER identifies structural templates from the PDB based on sequence alignments. The threading-aligned regions are built by template fragment assembly simulations, and the threading-unaligned regions are constructed by an opti-mized knowledge-based force field. Finally, the structures are clustered and the lowest five free-energy conformations are identified. These models are refined to remove steric clashes [139].
These five models were used to make the docking ensemble.
• PEP-FOLD36
PEP-FOLD3 is also a hybrid approach, with a rigid body assembly component and an ab initio Monte Carlo final step. This 3D structure peptide prediction web-server divides the structure into a series of fragments of four amino acids in aqueous solution, and describes them as a Structural Alphabet (SA) composed by patterns of a number of
4http://prism.ccbb.ku.edu.tr/hotpoint
5https://zhanglab.ccmb.med.umich.edu/I-TASSER/
C H A P T E R 2 . M E T H O D S A N D M AT E R I A L S
consecutive residues, where the 3D protein structures can be related to a library of 3D fragments [141][142].
This method is divided in [143]:
1. Prediction of SA letters from the amino acid sequence;
2. Alignment and a probability profile is returned for each SA letter.
3. 3D assembly of the prototype fragments associated with the letters selected. This step is repeated 100 times starting from various positions in the sequence;
4. Monte-Carlo method for the final refinement of the 100 simulations and for cluster-ing, using the RMSD.
The obtained five models were used to make the docking ensemble.
• PEPstrMOD7
PEPstrMOD is anab initiomethod developed specifically for predicting the tertiary structure of peptides containing natural, non-natural and modified residues, given the se-quence as an input. The software integrates structure prediction with force field libraries and simulations [144].
For structure prediction PEPstrMOD uses ideal dihedral angles as restraints for sec-ondary structure prediction [144][145]:
• Helix:φ=-60º andψ=-40º
• Strand:φ=-60º andψ=-40º
The initial structure is energetically minimized followed by molecular dynamics sim-ulation to generate a final tertiary peptide structure [144]. Since molecular dynamics simulation was used, the software also gives a five cluster output with diferent peptides conformations, each with five models. Without any criteria, cluster 1 was used to make the docking ensemble, so five models were used by each web-server.
The peptide environment was set as hydrophilic.
2.3.1 Structure Evaluation
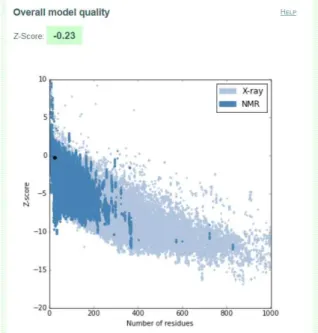
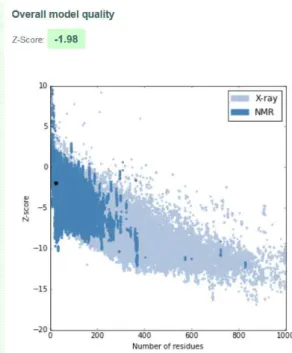
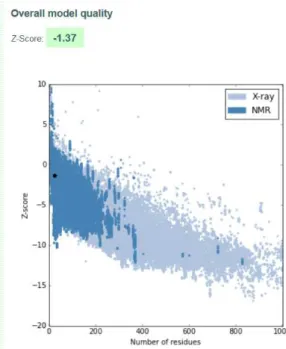
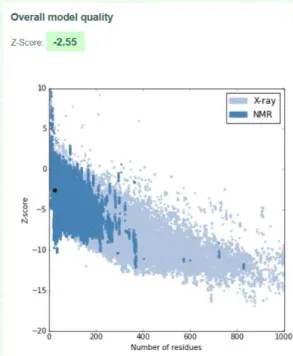
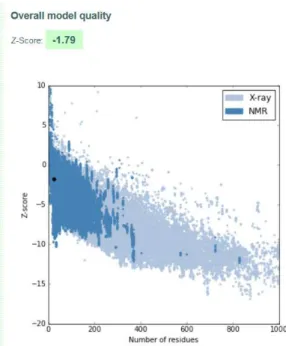
The assessment of the accuracy and reliability of the predicted peptide structures was made by ProSA-web8(Protein Structure Analysis-web), a validation tool used to check
errors in 3D protein structures [146].
This platform gives a final z-score score to an input structure and displays a plot with the scores of all experimentally determined structures that are in the database PDB, relating the two. Z-scores outside a characteristic range for native proteins of similar size indicate incorrect structures [147].
2 . 4 . M O L E C U L A R D O C K I N G
2.4 Molecular Docking
A web browser, an internet connection and registration to the HADDOCK web server are the only pre-requisites to access HADDOCK. The HADDOCK Guru interface along with a docking protocol were used [1].
It was made an ensemble docking, that refers to the use of multiple starting conforma-tions for one or more of the binding partners within the same docking run. In this case the first complex to be docked was hTRAF6-hPEP1. For that, the ensemble contains 15 starting conformations of the peptide hPEP1, 5 from each structure predictor web server (I-TASSER, PEP-FOLD and PEPstrMOD), and one conformation of the protein (hTRAF6), which was selected from the Protein Data Bank (PBD:1LB5) [148]. Five different models from each web server were evaluated in complex with hTRAF6, allowing HADDOCK to adopt the most stable and probable bound peptide conformation. The web-server that predicted the peptide tertiary structure present in the chosen hTRAF6-hPEP1 model was the web-server used to predicted also the tertiary structures of the peptides hPEP2, mPEP1, mPEP2 and PepH2-hTRANCE1. For the molecular docking of the complexes with these peptides it was performed an ensemble docking with 5 conformations of each peptide, given by the selected web-server.
In order to avoid HADDOCK docking errors, the input PDBs need to comply with three requirements [1][113]:
1. Remove any irrelevant water and other small molecules from the PDB files;
2. The PDB files must have an END statement as a last line;
3. When submitting an ensemble, all members must contain exactly the same atoms.
2.4.1 HADDOCK Guru Protocol
In the Guru interface, the following was taken into account [1][106]:
1. Is important for the final clustering that the PDB file of the largest molecule is entered first, because in HADDOCK the structures are first fitted on the interface residues of the first molecule and then the RMSD is calculated on the interface residues of the second molecule;
2. Passive residues were selected automatically by HADDOCK;
3. Peptide residues were considered fully-flexible, contrarily to protein residues;
![Figure 1.8: Ab initio and heuristic methods for protein structure prediction versus experi- experi-mental protein structure determination methods [77].](https://thumb-eu.123doks.com/thumbv2/123dok_br/16696150.743822/40.892.241.654.754.1023/figure-heuristic-methods-protein-structure-prediction-structure-determination.webp)
![Figure 1.15: Poly-L-lysine circular dichroism spectra for the three main conformations [135].](https://thumb-eu.123doks.com/thumbv2/123dok_br/16696150.743822/51.892.135.763.146.476/figure-poly-lysine-circular-dichroism-spectra-main-conformations.webp)