Universidade de Lisboa
Faculdade de Farmácia
Evaluation of the therapeutic potential of several compounds
in Human Herpesvirus 8 using a Chimera Virus Mouse
Infection Model
Tânia Alexandra da Cruz Rodrigues
Dissertation supervised by Professor Doctor João Pedro Monteiro e Louro Machado de Simas and co-supervised by Professor Doctor José Miguel Azevedo
Pereira
Master in Biopharmaceutical Sciences
1
Abstract
Kaposi’s sarcoma-associated herpesvirus (KSHV), also known as human herpesvirus 8, is an infectious agent able to establish a lifelong infection in B cells of the host. KSHV is associated with several malignancies such as Kaposi’s sarcoma (KS), primary effusion lymphoma (PEL), multicentric Castleman disease (MCD) and KSHV-associated inflammatory cytokine syndrome (KICS). The latent phase of the life cycle is responsible for the long-term persistence of the virus. KSHV latency-associated nuclear antigen (LANA) is an essential protein in the latent phase, regulating the transcription of both virus and host, genome replication and tumorigenesis and, given this, it is a potential target to clear latent infection. Nowadays, the conventional treatment of KSHV-associated malignancies is based on anti-tumour agents, which control the evolution of the disease but do not eliminate the KSHV infection. Since the discovery of effective drugs is imperative, a chimeric virus in which KSHV LANA (kLANA) was cloned in a murine herpesvirus 68 background, the mouse homologue of KSHV, was used to study kLANA as a target, to assess whether sulfathiazole, sulfanilamide, glybenclamide and JQ1 were able to eliminate persistence of the virus in vivo. Frequency of infection, capacity to establish latency by ex vivo reactivation assay and the infection on germinal centre (GC) B cells assessed by yellow fluorescent protein (YFP) expression were determined and analysed, after infection of mice and treatment with these drugs. Sulfathiazole, a drug that has been used as an antibiotic, showed to be very effective by impairing the formation of the murine double minute 2 (MDM2)-p53 complex, detaching the viral genome from the cellular DNA and diminishing viral infection in vivo using the chimeric mouse model of infection. Sulfanilamide has also been used as an antibiotic and, even though it has the same mechanism of action of sulfathiazole, it did not show a significant effect in clearing the viral infection but reduced the capacity of viral reactivation. Glybenclamide is broadly used in the management of diabetes mellitus type 2. It also reduces KSHV infection in vitro, possibly using a mechanism similar to that of both sulfathiazole and sulfanilamide. At the studied dose, glybenclamide did not display any effect and the viral infection was not affected. JQ1 is an inhibitor of bromodomain proteins, a family of proteins that allows the establishment of latency by the association of the viral genome with cellular chromatin and the transcription of the proto-oncogene c-myc, important to cell cycle progression, as well as to germinal centre formation and maintenance. JQ1 confirmed to be effective in reducing the GC B cells, but not specifically targeting latent virus. Since it decreased the number of GC B cells, including the infected cells, JQ1 was able to significantly reduce the level of systemic infection. In this study, two new effective approaches against the viral infection in vivo, sulfathiazole and JQ1, were discovered. Although the known molecular mechanism of action of the drugs is different, both drugs revealed to be promising for treating patients with KSHV infection.
2
Resumo
O herpesvírus associado ao sarcoma de Kaposi (KSHV, em inglês), também denominado por herpesvírus humano 8, é um agente infeccioso com a capacidade de estabelecer uma infeção latente vitalícia nas células B do hospedeiro. Este vírus está associado a várias doenças, tais como o sarcoma de Kaposi e a doença de Castleman, e está amplamente disperso pelo mundo. O ciclo de vida é constituído por duas fases: lítica e latente. A fase latente é responsável pela persistência vitalícia do vírus. Embora nesta fase a expressão génica seja bastante limitada, o antigénio nuclear associado à latência (LANA, em inglês) do KSHV (kLANA, em inglês), é expresso abundantemente, sendo uma proteína essencial da fase latente. kLANA é responsável por regular vários processos a nível celular, tais como a transcrição, tanto do vírus como do hospedeiro, a replicação do genoma viral, a reativação lítica, entre outros. Desta forma, kLANA controla a latência do KSHV.
Atualmente, o tratamento convencional para as doenças associadas ao KSHV é baseado em agentes anti-tumorais que, apesar de controlarem a evolução da doença, não eliminam a infeção viral. Tendo em conta a epidemiologia e a severidade das doenças associadas ao KSHV, novos fármacos que tenham a capacidade de eliminar a infeção são urgentes. No entanto, a inexistência de um modelo adequado in vivo tem limitado o estudo do KSHV. Face a isto, em 2017 foi desenvolvido um vírus quimérico em que, no genoma do herpesvírus murino 68 (MHV-68), o vírus homólogo de murganho do KSHV, foi substituído o MHV-68 LANA (mLANA) pelo kLANA. Este vírus quimérico permite estudar kLANA como um alvo terapêutico para eliminar a persistência do vírus in vivo.
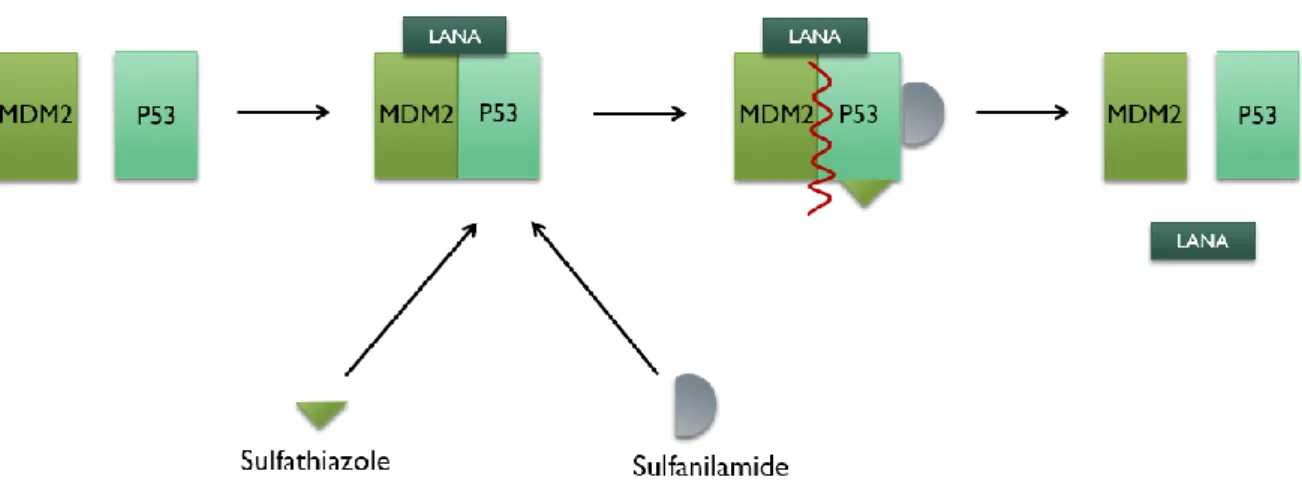
Sulfatiazol e sulfanilamida são dois fármacos que têm sido utilizados como antibióticos. Foi descoberto, in vitro, que podem ser eficazes na eliminação da infeção pelo KSHV, afetando a formação do complexo murino duplo minuto 2 (MDM2)-p53, que inativa a p53 e permite a ligação e estabilização do kLANA ao DNA celular.
Glibenclamida é um fármaco atualmente muito utilizado para controlar a diabetes mellitus tipo 2 e que demonstrou ter efeito no KSHV, in vitro, sendo também capaz de eliminar a infeção. Embora ainda sejam necessários estudos para esclarecer o mecanismo de ação da glibenclamida, pensa-se que atua da mesma forma que o sulfatiazol e a sulfanilamida, no complexo MDM2-p53.
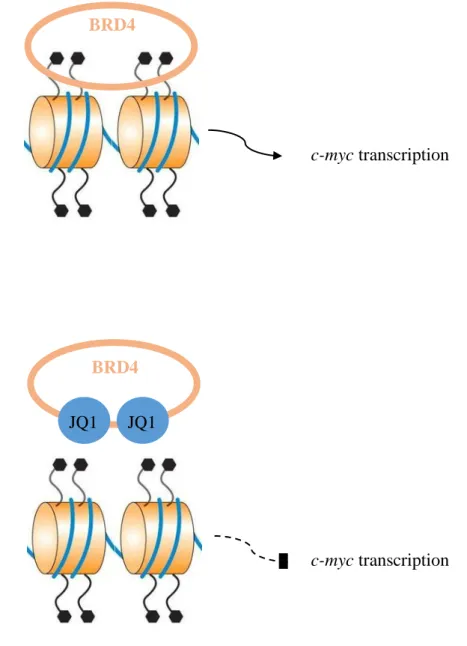
JQ1 é inibidor de bromodomínios (BRD), uma família de proteínas que está envolvida na transcrição de c-myc. c-myc é um proto-oncogene importante para a formação e manutenção de centros germinais, assim como para o ciclo celular. Para além disso, as proteínas BRD permitem o estabelecimento de latência, associando o genoma viral à cromatina celular.
Após a infeção dos murganhos com o vírus quimérico, a eficácia dos fármacos foi avaliada através da determinação da frequência de infeção, quantificação da infeção em centros germinais por expressão da proteína amarela fluorescente (YFP, em inglês) e análise da capacidade de estabelecer latência através de ensaio de reativação ex vivo.
Neste estudo, sulfatiazol foi testado em três doses diferentes, 0,25 mg/g de peso corporal, 0,5 mg/g e 1 mg/g. A dose de 0,25 mg/g apresentou uma taxa de sobrevivência de 100%, sem sinais de toxicidade A frequência de infeção, a percentagem de células infetadas nas células GC B pela expressão de YFP e a capacidade de estabelecer latência apresentaram uma diminuição significativa, demonstrando que, nessa dose, o sulfatiazol é eficaz na eliminação da infeção viral. O aumento da dose para 0,5 mg/g apresentou uma diminuição da latência nos três ensaios realizados, em comparação com
3 o controlo, e uma taxa de sobrevivência de 100%, também sem sinais de toxicidade. Apenas na frequência de infeção foi observado um decréscimo menor do que com 0,25 mg/g, sendo que nos outros ensaios esta dose demonstrou ser mais eficaz que a dose de 0,25 mg/g. No entanto, com 1 mg/g, a taxa de sobrevivência desceu para 30%, sendo esta dose altamente tóxica. Os resultados obtidos demonstraram uma diminuição significativa da latência viral face ao controlo, apesar da referida redução ser menor do que com 0,5 mg/g, exceto a frequência de infeção. Desta forma, foi concluído que o sulfatiazol é um fármaco eficaz em diminuir a infeção do vírus kLANA.yfp em todas as doses testadas. Na medida em que a dose deve ser obrigatoriamente menor que 1 mg/g, dada a toxicidade associada, e de acordo com os resultados significativos obtidos em 0,25 mg/g e 0,5 mg/g, a dose ideal será igual ou superior a 0,25 mg/g e menor que 1 mg/g.
Sulfanilamida foi testada a 0,25 mg/g e a 1 mg/g. A 0,25 mg/g, não se registou nenhum sinal de toxicidade, bem como nenhuma alteração face ao controlo, em todos os ensaios. O aumento para 1 mg/g diminuiu a taxa de sobrevivência para 90%, no entanto os resultados foram significativamente melhores do que com apenas 0,25 mg/g, tendo sido observada uma diminuição significativa face ao controlo, no ensaio de reativação. Por outro lado, a frequência de infeção apresentou uma pequena diminuição e o percentual de células infetadas nas células GC B também teve uma redução, apesar de não ter atingido significância estatística. Assim sendo, pensa-se que a sulfanilamida não tenha efeito na eliminação da infeção viral, sendo apenas capaz de afetar a capacidade de reativação do vírus. Concluiu-se, também, que a dose apropriada para ensaios futuros terá de ser maior que 0,25 mg/g e, dada a toxicidade, obrigatoriamente menor que 1 mg/g.
A glibenclamida foi testada a 0,005 mg/g de modo a evitar um efeito letal, dado ser um fármaco hipoglicémico. Embora a taxa de sobrevivência tenha sido 100%, foram observados sinais de toxicidade nesta dose. Para além disso, não foram obtidos resultados significativos nos três ensaios, concluindo que o fármaco não teve efeito na infeção latente.
JQ1 foi administrado a 0,05 mg/g e a taxa de sobrevivência obtida foi 100%. Foi observada uma diminuição estatisticamente significativa na capacidade do vírus em estabelecer latência, demonstrada em todos os ensaios realizados. Foi também detetada uma redução no número de esplenócitos totais e de centros germinais. No entanto, ao avaliar a percentagem de células infetadas do centro germinal, observou-se uma diminuição estatisticamente não significativa, e a percentagem de células infetadas com fenótipo de centro germinal permaneceu semelhante. Com base nisso, e sabendo que JQ1 afeta a transcrição de c-myc, essencial para a formação e manutenção de centros germinais, os centros germinais foram isolados e foi determinada a frequência de células positivas para DNA viral em centros germinais. O resultado obtido foi concordante e confirmou o que tinha sido concluído nos primeiros ensaios, não tendo sido observado um decréscimo muito elevado na frequência de infeção em centros germinais. Foi também realizada uma hibridação in situ, de forma a analisar as células infetadas. Foi observada uma diminuição no tamanho das secções do baço de murganho tratados com JQ1, afetando a área, embora o perímetro não tenha sido afetado, uma vez que a diminuição é maior na largura. Apesar de o número de folículos registados ter sido semelhante ao controlo, o tamanho foi significativamente menor (tanto na área como no perímetro), tal como esperado, uma vez que os murganhos tratados com JQ1 apresentam menos centros germinais. Por fim, observou-se uma diminuição estatisticamente significativa nos folículos positivos para RNA viral (com, pelo menos, uma célula infetada), mostrando que a infeção está diminuída devido ao facto de haver
4 menos centros germinais. Desta forma, concluiu-se que o JQ1 aparenta afetar somente o número de centros germinais, o que leva a uma consequente diminuição generalizada da infeção, embora não afete o vírus nem a infeção latente.
Neste estudo, duas novas abordagens eficazes contra a infeção viral foram descobertas. Embora o mecanismo de ação dos fármacos seja diferente, tanto o sulfatiazol como o JQ1 revelaram ser promissores para o tratamento de pacientes infetados pelo KSHV.
5
Acknowledgements (Agradecimentos)
Primeiramente, ao Professor Pedro, meu orientador, por ter permitido que exercesse a minha paixão por farmacologia, ainda que esta abordagem não se inserisse nos objetivos do laboratório. Obrigada pela oportunidade, por todos os ensinamentos e disponibilidade. Foi incrível desenvolver esta tese!
Ao Miguel. Por toda a paciência e apoio, por todas as vezes em que acreditaste em mim quando eu não acreditei. Por teres estado lá, às 3h da manhã, ao meu lado, quando só me apetecia desistir e ir para casa. Por me animares em todos os finais de tarde quando saía desnorteada do lab. Por todas as vezes em que me limpaste as lágrimas. Por teres sempre a única palavra amiga que me consegue levantar. Por tudo, obrigada! Juro por nós que, sem ti, não tinha conseguido. Metade desta tese é tua.
Ao Fael e aos meus pais. Obrigada por me terem aturado quando estava insuportável, por terem continuado a perguntar sobre a tese quando a minha resposta era sempre “não me apetece falar sobre isso agora” e por aceitarem tão bem a possibilidade de só sair de casa aos 30 por me meter em áreas em que vou para o desemprego, são os maiores! (Ah, e obrigada por pagarem as propinas, sem isso de certeza que não tinha sido possível).
Ao resto da minha família, principalmente ao meu avô Augusto, muito obrigada por todo o apoio e carinho, e por reconhecer sempre todo o esforço envolvido nisto.
À Anita, Catarina e Andreia, não há palavras para vocês! Obrigada por terem sido a melhor companhia este ano! Por toda a ajuda, gargalhadas, conversas e choro partilhado. Por não me terem levado a sério quando fui pessimista e por terem deixado bilhetes encorajadores ao sábado de manhã. Sem vocês não tinha conseguido aguentar este ano!
À Marta Miranda, por toda a ajuda, orientação, paciência e ensinamentos ao longo deste ano.
Ao Fabrizio Angius, por esclarecer todas as dúvidas e estar sempre disponível, tal como um orientador.
Ao professor José Pereira, meu co-orientador, por ter sido sempre tão amável e disponível.
A todos os meus amigos, a todos vocês que mereciam tanto que escrevesse o nome individual de cada um. A todos os que me ajudaram a abstrair fim-de-semana após fim-de-semana e que, mesmo sem perceberem o que eu dizia, perguntavam sempre como estava a correr. A todos o que me ouviram a lamentar vezes sem conta e disseram sempre “já está quase, vai correr tudo bem”. A todos os que me obrigaram a escrever a tese e a todos os que foram para a biblioteca comigo. A todos os que a primária, o básico, o secundário, a FCUL e a FFUL me deram, e a todos os aleatórios que não sei de onde vieram, e que continuam cá, ao meu lado. E a todos os ativistas que puseram a nossa amizade acima do que eu fazia aos ratinhos. Cliché, mas vocês são os melhores amigos do mundo! Sem vocês e as vossas palavras de motivação eu não tinha conseguido chegar ao fim deste mestrado.
A todos vocês, um obrigada gigante do fundo do coração. Tânia
6
Contents
Abstract ... 1 Resumo ... 2 Acknowledgements (Agradecimentos) ... 5 Contents ... 6 List of Figures ... 9 List of Tables ... 15 List of Abbreviations ... 16 1. Introduction ... 19 1.1. Virus ... 19 1.2. Herpesviridae ... 191.3. The Gammaherpesvirinae subfamily ... 22
1.3.1. Kaposi’s sarcoma-associated herpesvirus ... 22
1.3.1.1. Lytic phase ... 24
1.3.1.2. Latent phase ... 24
1.3.1.2.1. KSHV latency-associated nuclear antigen ... 26
1.3.1.3. KSHV-related Diseases ... 28
1.3.1.3.1. Kaposi’s sarcoma ... 28
1.3.1.3.2. Other diseases associated to KSHV ... 28
1.3.1.4. Epidemiology ... 29
1.3.2. Murine herpesvirus 68 ... 30
1.3.2.1. MHV-68 latency-associated nuclear antigen ... 30
1.3.2.2. MHV-68 infection ... 31
1.3.3. Chimeric virus to study kLANA functions in vivo ... 32
1.4. Antivirals and Antiviral Strategies ... 33
1.5. Treatment ... 34
1.6. Studied Drugs ... 35
1.6.1. Sulfathiazole and Sulfanilamide ... 35
1.6.2. Glybenclamide ... 36
1.6.3. JQ1 ... 37
2. Aim of the project ... 39
3. Material and Methods... 40
3.1. Cells and Viruses ... 40
3.1.1. BHK-21 ... 40
7
3.2. In vitro assays ... 41
3.2.1. Production of viral stocks ... 41
3.2.2. Virus titration using suspension assay – plaque assay ... 41
3.2.3. Protein expression analysis ... 41
3.2.3.1. Sodium dodecyl sulphate-polyacrylamide gel electrophoresis (SDS-PAGE) ... 42
3.2.3.2. Western blot ... 43
3.2.4. One-step growth curves ... 44
3.3. In vivo assays ... 44
3.3.1. Mice ... 44
3.3.2. Ethics statement ... 44
3.3.3. Mice infection ... 44
3.3.4. Treatment with drugs ... 45
3.3.4.1. Sulfathiazole and Sulfanilamide ... 45
3.3.4.2. Glybenclamide ... 45
3.3.4.3. JQ1 ... 45
3.3.5. Preparation of splenocyte suspensions ... 46
3.3.6. Infectious Centre Assay (ICA) ... 46
3.3.7. Frequency of viral DNA positive in total splenocytes ... 47
3.3.8. Flow Cytometry ... 48
3.3.8.1. Determination of the percentage of cells by YFP expression ... 48
3.3.8.2. Sorting of GC B cells ... 48
3.3.9. Frequency of viral DNA positive cells in GC B cells ... 49
3.3.10. In situ hybridization to detect virally infected cells in spleen sections ... 49
3.3.10.1. Tissue preparation ... 49 3.3.10.2. In situ hybridization ... 49 3.4. Statistical Analysis ... 50 4. Results ... 52 4.1. In vitro assays ... 52 4.1.1. Viral stock ... 52
4.1.2. Protein expression analysis ... 52
4.1.3. Effect of the studied drugs during lytic replication ... 53
4.2. In vivo assays ... 54
4.2.1. Effect of Sulfathiazole and Sulfanilamide in latent infection ... 54
4.2.1.1. Toxicity ... 55
4.2.1.2. Infectious Centre Assay ... 55
4.2.1.3. Frequency of DNA positive cells in total splenocytes ... 57
8
4.2.2. Effect of Glybenclamide in latent infection ... 61
4.2.2.1. Toxicity ... 62
4.2.2.2. Infectious Centre Assay ... 62
4.2.2.3. Frequency of DNA positive cells in total splenocytes ... 63
4.2.2.4. Flow Cytometry ... 64
4.2.3. Effect of JQ1 in latent infection ... 64
4.2.3.1. Toxicity ... 64
4.2.3.2. Infectious Centre Assay ... 64
4.2.3.3. Frequency of DNA positive cells in total splenocytes ... 65
4.2.3.4. Flow Cytometry ... 66
4.2.3.5. Frequency of viral DNA positive cells in GC B cells ... 69
4.2.3.6. In situ hybridization to detect virally infected cells in spleen sections ... 70
5. Discussion ... 75
6. Conclusions and Future Perspectives ... 80
References ... 82
Appendix I – Sulfathiazole and Sulfanilamide (0.25 mg/g) ... 92
9
List of Figures
Figure 1. 1. Schematic representation of the multilayer organization of herpesvirus
(Adapted from Prasad and Schmid, 2012). ... 19
Figure 1. 2. Schematic representation of the KSHV genome. TRs (blue), v-ORFs
(brown), miRNAs (dark gray) and ncRNAs (light gray) are represented. Alternative protein names are written in parenthesis. Arrows indicate transcription direction (From Juillard et al., 2016). ... 23
Figure 1. 3. Representation of the two phases of KHSV life cycle, regarding the genes
expressed in each phase (From Purushothaman et al., 2016). ... 25
Figure 1. 4. Schematic representation of kLANA protein, divided by the different parts
which constitute it, namely the proline-rich (P), the aspartate and glutamate (DE), the glutamine (Q), the leucine zipper (LZ), the glutamate and glutamine (EQE) and the DNA binding domain (DBD) regions. Numbers indicate amino acid residues (Adapted from Piolot et al., 2001, De Leon Vazquez et al., 2013, Ponnusamy et al., 2015). ... 26
Figure 1. 5. Schematic representation of tethering mechanism of kLANA to a
chromosome. N-terminal (N) associates with histones H2A and H2B while C-terminal (C) binds to terminal repeats (TR) of KSHV episome and to a putative protein (X) that associates with the mitotic chromosome (From Juillard et al., 2016). ... 27
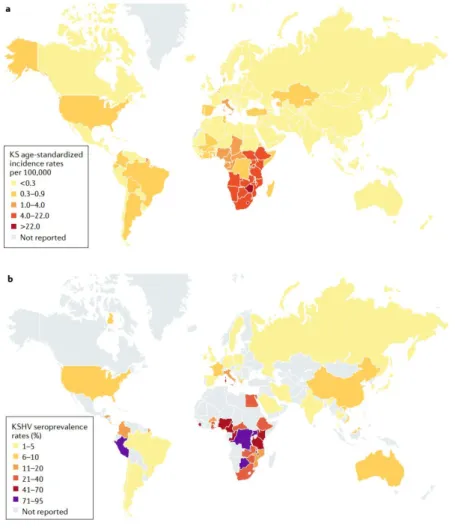
Figure 1. 6. Geographical prevalence of KS age-standardized incidence rates per
100.000 (a) and percentage of seroprevalence of KSHV (b) (From Cesarman et al., 2019). ... 29
Figure 1. 7. Schematic representation of the comparison between kLANA and mLANA
proteins. Shaded regions represent homology between proteins and unshaded regions lack homology. The intensity of the shade refers to the level of homology (dark means more homology). Proline-rich (P), the aspartate and glutamate (DE), the glutamine (Q), the leucine zipper (LZ), the glutamate and glutamine (EQE) and the DNA binding domain (DBD) regions. Numbers indicate amino acid residues (Adapted from Habison et al., 2012; Ponnusamy et al., 2015)... 31
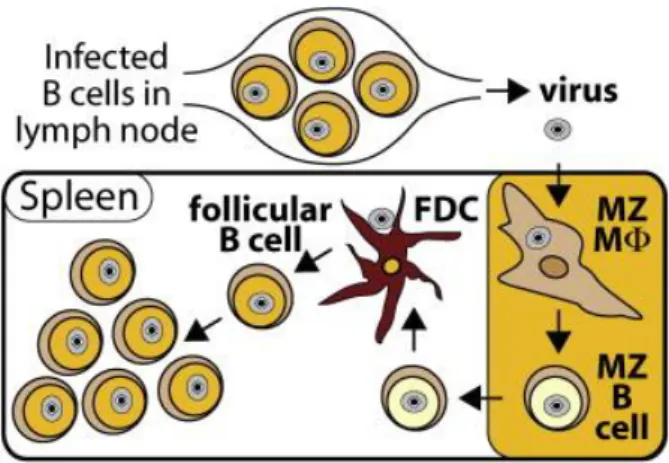
Figure 1. 8. Schematic representation of MHV-68 infection. The virus infects marginal
zone (MZ) macrophages and MZ B cells, thus reaching the spleen. MZ B cells move to the white pulp of the spleen, where the transference of the virus to follicular dendritic cells (FDC) occurs. After this, the virus reaches GC B cells (From Frederico et al., 2014). ... 32
Figure 1. 9. Schematic representation of the construction of v-kLANA. The insertion of
the kLANA cassette occurred between the M11 stop codon and the mORF72 exon in place of MHV-68. The mORF72 non-coding exon (black) is positioned within the mLANA coding region (Adapted from Habison et al., 2017). ... 32
10
Figure 1. 10. Structural formula of the drugs. a) Sulfathiazole. b) Sulfanilamide
(Adapted from Göko and Esra, 2014; Trontelj et al., 2019). ... 35
Figure 1. 11. Schematic representation of the mechanism of action of sulfathiazole and
sulfanilamide, acting on the MDM2-p53 complex (Adapted from Angius et al., 2017). ... 36
Figure 1. 12. Structural formula of glybenclamide (Adapted from Sanz et al., 2012). . 37
Figure 1. 13. JQ1. a) Structural formula. b) Schematic representation of the mechanism
of action, inhibiting c-myc transcription. The hexagons represent the acetylated lysine residues of the histones (Adapted from Ferri et al., 2015). ... 38
Figure 4. 1. Western blot analysis of proteins in total cellular lysate of infected cells
with v-kLANA.yfp (molecular weight indicated on the left). 2.5x10⁵ BHK-21 cells were
infected with v-kLANA.yfp with a MOI of 3 PFU/cell for 6 hours. Control is a sample from uninfected cells. ... 52
Figure 4. 2. One-step growth curve of v-kLANA.yfp in presence of sulfathiazole (25.5
μg/mL, blue), sulfanilamide (17.2 μg/mL, green), and glybenclamide (5 and 25 μg/mL, pink and orange, respectively). 5x10⁴ BHK-21 cells were infected with 5 PFU per cell of v-kLANA.yfp and at the indicated times, in hours, post-infection (0, 4, 8, 12, 24 and 48), cells and respective media were harvested, freeze-thawed and titrated by plaque assay. There was no statistically significant difference between experimental groups (One-way ANOVA statistical test). ... 54
Figure 4. 3. Quantification of latent infection in the spleen, 14 dpi, by ex vivo
reactivation assay. BALB/c mice were intranasally inoculated with 104 PFU of v-kLANA.yfp. At day 9 post-infection, groups of four mice were treated with: 0.25 mg/g/day of sulfathiazole in water (■); 0.25 mg/g/day of sulfathiazole in 17% DMSO/water (▲); or PBS (control, ●) by intraperitoneal injection. A daily dose was administered until mice were sacrificed at day 14 post-infection. Spleens were dissected, single splenocyte suspensions were prepared and latent viruses were titrated by ex vivo co-culture assay (closed symbols). Titres of infectious viruses were determined in freeze-thawed splenocyte suspensions (open symbols). Each circle represents the titre of an individual mouse and the horizontal bars denote mean values. The dashed line represents the limit of detection of the assay. (***: p-value<0.001; non-significant (ns): p-value>0.05, by unpaired t-test). ... 56
11
Figure 4. 4. Quantification of latent infection in the spleen, 14 dpi, by ex vivo
reactivation assay. BALB/c mice were intranasally inoculated with 104 PFU of
v-kLANA.yfp. At day 9 post-infection, four groups of mice were treated with: 0.5 mg/g/day of sulfathiazole in water ( ); 1 mg/g/day of sulfathiazole in water (■); 1 mg/g/day of sulfanilamide in 17% DMSO/water (▲); or PBS (control, ●) by intraperitoneal injection. A daily dose was administered until mice were sacrificed at day 14 post-infection. Spleens were dissected, single splenocyte suspensions were prepared and latent viruses were titrated by ex vivo co-culture assay (closed symbols). Titres of infectious viruses were determined in freeze-thawed splenocyte suspensions (open symbols). Each circle represents the titre of an individual mouse and the horizontal bars denote mean values. The dashed line represents the limit of detection of the assay. (*: p-value<0.05; **: p-value<0.01, by unpaired t-test). ... 56
Figure 4. 5. Frequency of viral DNA positive cells in total splenocytes, obtained by
limiting dilution assay and real-time PCR. Bars represent frequency of viral DNA positive cells with 95% confidence intervals. a) Data obtained from pools of five mice. b) Data obtained from pools of three (sulfathiazole 1 mg/g); four (sulfanilamide 1 mg/g); and five (sulfathiazole 0.5 mg/g) mice. ... 57
Figure 4. 6. Flow cytometry analysis. Percentage quantification of GC B cells (CD19+
GL7+ CD95+). a) Representative flow cytometry plot gated on B cells. The indicated value refers to a percentage. b) Each dot represents an individual mouse and the horizontal bars denote mean values. (*: p-value<0.05, by unpaired t-test). ... 59
Figure 4. 7. Flow cytometry analysis. Percentage quantification of infected GC B cells
(CD19+ GL7+ CD95+ YFP+). a) Representative flow cytometry plot gated on GC B
cells. The indicated value refers to a percentage. b) Each dot represents an individual mouse and the horizontal bars denote mean values. (***: value<0.001; ns: p-value>0.05, by unpaired t-test). ... 60
Figure 4. 8. Flow cytometry analysis. Percentage quantification of infected B cells with
GC phenotype (CD19+ YFP+). a) Representative flow cytometry plot gated on YFP positive B cells. The indicated value refers to a percentage. b) Each dot represents an individual mouse and the horizontal bars denote mean values. (ns: p-value>0.05, by unpaired t-test). ... 61
Figure 4. 9. Quantification of latent infection in the spleen, 14 dpi, by ex vivo
reactivation assay. BALB/c mice were intranasally inoculated with 104 PFU of v-kLANA.yfp. At day 9 post-infection, four groups of mice were treated with: 0.005 mg/g/day of glybenclamide (◆); or PBS (control, ●) by intraperitoneal injection. A daily dose was administered until mice were sacrificed at day 14 post-infection. Spleens were dissected, single splenocyte suspensions were prepared and latent viruses were titrated by ex vivo co-culture assay (closed symbols). Titres of infectious viruses were determined in freeze-thawed splenocyte suspensions (open symbols). Each circle represents the titre of an individual mouse and the horizontal bars denote mean values. The dashed line represents the limit of detection of the assay. (ns: p-value>0.05, by unpaired t-test). ... 62
12
Figure 4. 10. Frequency of viral DNA positive cells in total splenocytes, obtained by
limiting dilution assay and real-time PCR. Bars represent frequency of viral DNA positive cells with 95% confidence intervals. Data was obtained from pools of five mice. ... 63
Figure 4. 11. Quantification of latent infection in the spleen, 14 dpi, by ex vivo
reactivation assay. BALB/c mice were intranasally inoculated with 104 PFU of v-kLANA.yfp. At day 9 post-infection, four groups of mice were treated with: 0.05 mg/g of JQ1 in a solution of DMSO and 10% 2-hydropropil-β-ciclodextrin, in 1:10 (■); or 1:10 DMSO/10% 2-hydropropil-β-ciclodextrin (control, ●) by intraperitoneal injection. A daily dose was administered until mice were sacrificed at day 14 post-infection. Spleens were dissected, single splenocyte suspensions were prepared and latent viruses were titrated by ex vivo co-culture assay (closed symbols). Titres of infectious viruses were determined in freeze-thawed splenocyte suspensions (open symbols). Each circle represents the titre of an individual mouse and the horizontal bars denote mean values. The dashed line represents the limit of detection of the assay. (*: p-value<0.05, by unpaired t-test). ... 65
Figure 4. 12. Frequency of viral DNA positive cells in total splenocytes, obtained by
limiting dilution assay and real-time PCR. Bars represent frequency of viral DNA positive cells with 95% confidence intervals. Data was obtained from pools of four mice. ... 65
Figure 4. 13. Flow cytometry analysis. Percentage quantification of GC B cells (CD19+
GL7+ CD95+). a) Representative flow cytometry plot gated on B cells. The indicated
value refers to a percentage. b) Each dot represents an individual mouse and the horizontal bars denote mean values. (**: p-value<0.01, by unpaired t-test)... 66
Figure 4. 14. Flow cytometry analysis. Percentage quantification of infected GC B cells
(CD19+ GL7+ CD95+ YFP+). a) Representative flow cytometry plot gated on GC B cells. The indicated value refers to a percentage. b) Each dot represents an individual mouse and the horizontal bars denote mean values. (ns: p-value>0.05, by unpaired t-test). ... 67
Figure 4. 15. Flow cytometry analysis. Percentage quantification of infected B cells
with GC phenotype (CD19+ YFP+). a) Representative flow cytometry plot gated on YFP
positive B cells. The indicated value refers to a percentage. b) Each dot represents an individual mouse and the horizontal bars denote mean values. (ns: p-value>0.05, by unpaired t-test). ... 68
Figure 4. 16. Quantification of cells per spleen, each dot represents an individual mouse
and the horizontal bars denote mean values. a) Quantification of total splenocytes per spleen estimated by trypan blue exclusion. b) Quantification of the total number of GC B cells (CD19+ GL7+ CD95+) per spleen, calculated through the counted cells and the parental percentage, acquired by flow cytometry. (**: p-value<0.01, by unpaired t-test). ... 69
Figure 4. 17. Frequency of viral DNA positive cells in GC B cells, obtained by limiting
dilution assay and real-time PCR. Data were obtained from pools of five mice. Bars represent frequency of viral DNA positive cells with 95% confidence intervals. ... 70
13
Figure 4. 18. Analysis of spleen sections of untreated (control) and treated (JQ1) mice
after in situ hybridization (20x). a) Spleen sections of the four mice of each experimental group. Brown dots indicate infected follicles. Unspecific background is observed in the spleen sections. Scale bar: 5 mm. b) Representative spleen sections of the control group (left) and JQ1 group (right), highlighting the infection (brown dots, indicated by the arrow). Scale bar: 1 mm... 71
Figure 4. 19. Analysis of spleen sections of untreated (control) and treated (JQ1) mice
after in situ hybridization. Quantification of the perimeter (mm) of the spleen sections. Each dot represents an individual mouse and the horizontal bars denote mean values. (ns: p-value>0.05, by unpaired t-test). ... 71
Figure 4. 20. Analysis of spleen sections of untreated (control) and treated (JQ1) mice
after in situ hybridization. Quantification of the area (mm2) of the spleen sections. Each dot represents an individual mouse and the horizontal bars denote mean values. (*: p-value<0.05, by unpaired t-test). ... 72
Figure 4. 21. Analysis of spleen sections of untreated (control) and treated (JQ1) mice
after in situ hybridization. Quantification of the number of follicles per spleen section. Each dot represents an individual mouse and the horizontal bars denote mean values. (ns: p-value>0.05, by unpaired t-test). ... 72
Figure 4. 22. Analysis of spleen sections of untreated (control) and treated (JQ1) mice
after in situ hybridization. Quantification of the mean perimeter (mm) of the follicles of the spleen sections. Each dot represents an individual mouse and the horizontal bars denote mean values. (****: p-value<0.0001, by unpaired t-test). ... 73
Figure 4. 23. Analysis of spleen sections of untreated (control) and treated (JQ1) mice
after in situ hybridization. Quantification of the mean area (mm2) of the follicles of the
spleen sections. Each dot represents an individual mouse and the horizontal bars denote mean values. (****: p-value<0.0001, by unpaired t-test). ... 73
Figure 4. 24. Analysis of spleen sections of untreated (control) and treated (JQ1) mice
after in situ hybridization. Quantification of the percentage of viral miRNA (v-miRNA) or viral tRNA (v-tRNA) positive follicles of the spleen sections. Each dot represents an individual mouse and the horizontal bars denote mean values. (**: p-value<0.01, by unpaired t-test). ... 74
Appendix I. 1. Flow cytometry analysis. Percentage quantification of GC B cells
(CD19+ GL7+ CD95+). a) Representative flow cytometry plot gated on B cells. The
indicated value refers to a percentage. b) Each dot represents an individual mouse and the horizontal bars denote mean values. (*: p-value<0.05, by unpaired t-test). ... 92
Appendix I. 2. Flow cytometry analysis. Percentage quantification of infected GC B
cells (CD19+ GL7+ CD95+ YFP+). a) Representative flow cytometry plot gated on GC B cells. The indicated value refers to a percentage. b) Each dot represents an individual mouse and the horizontal bars denote mean values. (***: value<0.001; ns: p-value>0.05, by unpaired t-test). ... 93
14
Appendix I. 3. Flow cytometry analysis. Percentage quantification of infected B cells
with GC phenotype (CD19+ YFP+). a) Representative flow cytometry plot gated on YFP
positive B cells. The indicated value refers to a percentage. b) Each dot represents an individual mouse and the horizontal bars denote mean values. (ns: p-value>0.05, by unpaired t-test). ... 94
Appendix II. 1. Flow cytometry analysis. Percentage quantification of GC B cells
(CD19+ GL7+ CD95+). a) Representative flow cytometry plot gated on B cells. The indicated value refers to a percentage. b) Each dot represents an individual mouse and the horizontal bars denote mean values. (ns: p-value>0.05, by unpaired t-test). ... 95
Appendix II. 2. Flow cytometry analysis. Percentage quantification of infected GC B
cells (CD19+ GL7+ CD95+ YFP+). a) Representative flow cytometry plot gated on GC B cells. The indicated value refers to a percentage b) Each dot represents an individual mouse and the horizontal bars denote mean values. (ns: p-value>0.05, by unpaired t-test). ... 96
Appendix II. 3. Flow cytometry analysis. Percentage quantification of infected B cells
with GC phenotype (CD19+ YFP+). a) Representative flow cytometry plot gated on YFP
positive B cells. The indicated value refers to a percentage. b) Each dot represents an individual mouse and the horizontal bars denote mean values. (ns: p-value>0.05, by unpaired t-test). ... 97
15
List of Tables
Table 1. 1. Human herpesvirus and some of their characteristics (Adapted from
Davison, 2010). ... 21
Table 3. 1. Composition of electrophoresis gels. ... 42
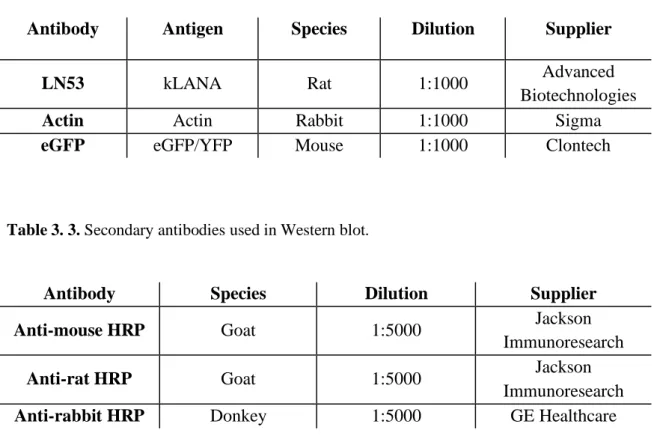
Table 3. 2. Primary antibodies used in Western blot. ... 43
Table 3. 3. Secondary antibodies used in Western blot. ... 43
Table 3. 4. Primers and probe specific for M9 gene used to detect MHV-68 DNA. ... 47
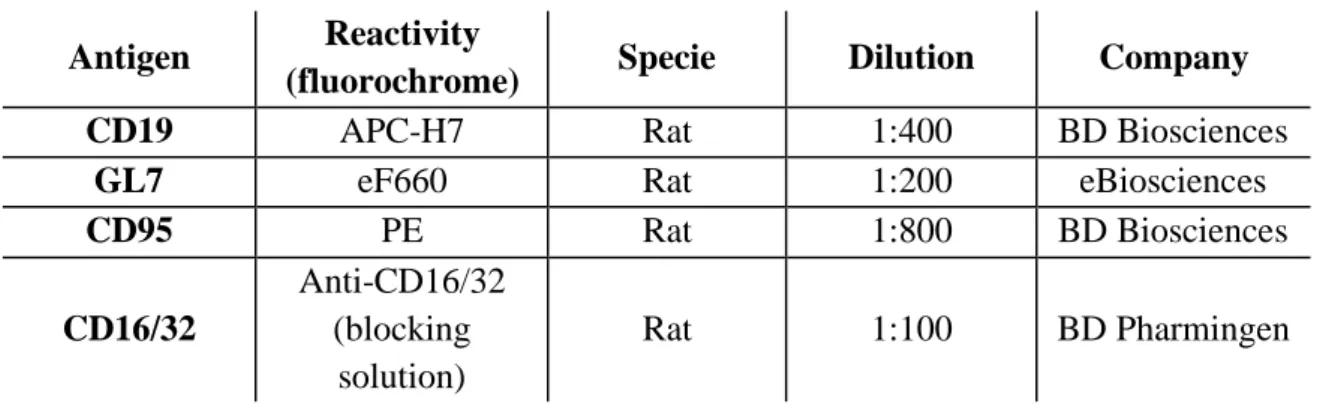
Table 3. 5. Antibodies used in flow cytometry assays. ... 48
Table 4. 1. Reciprocal frequency of viral DNA positive cells in total splenocytes related to Figure 4.5.A.. ... 58
Table 4. 2. Reciprocal frequency of viral DNA positive cells in total splenocytes related to Figure 4.5.B.. ... 58
Table 4. 3. Reciprocal frequency of viral DNA positive cells in total splenocytes related to Figure 4.10.. ... 63
Table 4. 4. Reciprocal frequency of viral DNA positive cells in total splenocytes related to Figure 4.15.. ... 66
Table 4. 5. Reciprocal frequency of viral DNA positive cells in GC B cells related to Figure 4.20.. ... 70
Table 5. 1. Summary of both the decrease observed in the assays in treated mice comparing with the control (untreated mice) and the survival rate, after treatment with the drugs at all of the tested doses. ... 76
16
List of Abbreviations
AIDS Acquired immunodeficiency syndrome
AKT Protein kinase B
AP Alkaline phosphatase
ATP Adenosine triphosphate
BET Bromodomain and extraterminal domain
BHK Baby hamster kidney
BHK-21 BHK strain 21
BRD Bromodomain
cART Combination antiretroviral therapy
CSR Class switch recombination
CWS Cell working stock
DBD DNA binding domain
DE Delayed-early
dH2O Distilled H2O
DIG Digoxigenin
DMSO Dimethyl sulfoxide
DNA Deoxyribonucleic acid
Dpi Days post-infection
DSB DNA double-strand break
dsDNA Double-stranded DNA
DTT Dithiothreitol
EBV Epstein-Barr virus
EDTA Ethylenediamine tetraacetic acid
FBS Fetal bovine serum
G+C Guanine and cytosine
GC Germinal centre
GFP Green fluorescent protein
GMEM Glasgow minimum essential medium
HCMV Human cytomegalovirus
HHV-6 Human herpesvirus 6
HHV-7 Human herpesvirus 7
HHV-8 Human herpesvirus 8
17
HRP Horse radish peroxidase
HSV-1 Herpes simplex virus type 1
HSV-2 Herpes simplex virus type 2
HVS Herpesvirus saimiri
ICA Infectious centre assay
ICTV International Committee on Taxonomy of Viruses
IE Immediate-early
IFN-α Interferon alpha
IRIS Immune reconstitution inflammatory syndrome
KICS KSHV-associated inflammatory cytokine syndrome
kLANA KSHV latency-associated nuclear antigen
KS Kaposi’s sarcoma
KSHV Kaposi’s sarcoma-associated herpesvirus
L Late
LANA Latency-associated nuclear antigen
LBS kLANA binding site
LUR Long unique coding region
LZ Leucine zipper
MCD Multicentric Castleman disease
MDM2 Murine double minute 2
MHV-68 Murine herpesvirus 68
mLANA MHV-68 latency-associated nuclear antigen
MOI Multiplicity of infection
miRNA Micro RNA
MZ Marginal zone
NBT Nitroblue tetrazolium chloride
ncRNA Non-coding RNA
NHEJ Non-homologous end joining
ns Non-significant
O/N Overnight
ORF Open reading frame
Ori-P Origin of replication
PABA Para-aminobenzoic acid
PBS Phosphate buffered saline
18
PCR Polymerase chain reaction
PEL Primary effusion lymphoma
PFU Plaque forming unit
RBL Red blood cell lysis buffer
RE Replication element
RNA Ribonucleic acid
RNase Ribonuclease
rpm Revolutions per minute
RT Room temperature
RTA Replication and transcription activator
SDS Sodium dodecyl sulphate
SDS-PAGE Sodium dodecyl sulphate-polyacrylamide gel electrophoresis
SHM Somatic hypermutation
SHPM Single-hit Poisson model
siRNA Small interfering RNA
SSC Saline sodium citrate
TEMED Tetramethylethylenediamine
TGS Tris-Glycine-SDS
TPB Tryptose phosphate broth
TR Terminal repeat
tRNA Transfer RNA
v-cyclin Viral cyclin
v-FLIP Viral Fas-associated death domain-like interleukin-1β-converting
enzyme-inhibitory protein
v-GPCR Viral G protein-coupled receptor
v-miRNA Viral micro RNA
v-ORF Viral open-reading frame
v-tRNA Viral transfer RNA
VEGF Vascular endothelial growth factor
VZV Varicella-zoster virus
WSM Working stock media
19
1. Introduction
1.1. Virus
A virus is an infectious agent that needs living cells to replicate. According to Baltimore classification, viruses are divided in seven groups, varying in several properties, such as the type of nucleic acid (deoxyribonucleic acid (DNA), ribonucleic acid (RNA) or both, at different stages of the life cycle), shape (linear, circular or segmented), strandedness (single, double or both), sense (positive, negative or both – ambisense), and the use or not of reverse transcriptase (Baltimore, 1971).
Virion is the infectious particle designed for the transmission of the viral genome. A typical virion consists in an external protein shell, capsid, and an internal core of nucleic acid. While the capsid adds specificity to the virus, the genetic material provides infectivity (Forterre, 2010). The characteristics of the virion vary according to the virus (Forterre, 2010).
1.2. Herpesviridae
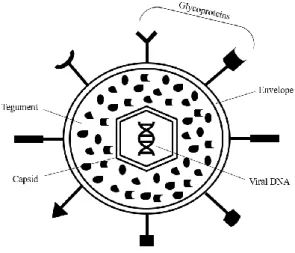
Herpesviridae is a family of viruses characterized by a large double-stranded DNA (dsDNA) genome and the capacity of maintaining their genomes in a latent state in the nucleus of distinct cells for the life of the host (Mettenleiter et al., 2009). An architecturally similar virion is another characteristic that herpesviruses, denomination given to the members of Herpesviridae family, have in common. A typical herpesvirus virion consists in a core containing a linear double stranded DNA, an extremely ordered icosahedral shape nucleocapsid, surrounded by a semi-ordered tegument (the space between the envelope and nucleocapsid which contains proteins and RNAs), and a lipid bilayer envelope containing viral glycoprotein spikes on its surface, accountable for viral connection and entry to host cells (Figure 1.1.) (Bândea, 1983; Forterre, 2010).
Figure 1. 1. Schematic representation of the multilayer organization of herpesvirus (Adapted
20 Herpesvirus are largely disseminated in nature and there are more than a hundred herpesviruses identified. Eight herpesviruses have been isolated from humans (Table 1.1.). It is known that there was a co-evolution of herpesviruses and their hosts, so they are very well adapted to each one of them (Davison et al., 2002).
One of the characteristics of herpesviruses is the transition of their life cycle between the latent and the lytic phase (Jenner et al., 2001). The virus has the ability to establish a quiescent infection, in which it stays dormant within the host cell and there is no replication – latent phase. The virus can reactivate and start producing huge quantities of viral progeny without the host being infected by new external virus – lytic phase (Traylen et al., 2011). However, this phase is deleterious for the virus, since a dynamic replication will tend to induce the immune system of the host or internal cell signalling that lead to the death of the infected cell. The transition between phases involves several changes at cellular level. The latent phase is characterized by circularized viral genome that forms episomal DNA element packed in histones (Deshmane and Fraser, 1989; Grinde, 2013). Furthermore, the viral DNA is copied by cellular DNA polymerases along with the chromosomes when the cell engages in mitosis. There are also some mechanisms for the silencing of viral genes, such as specific methylation programs and packaging of the DNA in particular types of histones (Wilson and Mohr, 2012). So, the production of viral proteins stays reduced to a minimum in order to escape from the immune system of the host. However, the genome is not completely silenced due to its necessity to maintain long-term latency (Amon and Farrell, 2005; Calderwood et al., 2007; Klein et al., 2007). On the other hand, there is an evident takeover of the cell in the lytic phase: viral genome is linearized, viral DNA is copied by the viral DNA polymerase and viral proteins are largely produced (Wilson and Mohr, 2012). Nevertheless, during chronic infection there may also occur the production of infectious viruses at the sites of persistent infection, allowing transmission to new hosts.
According to the International Committee on Taxonomy of Viruses (ICTV), the Herpesviridae family belongs to the order Herpesvirales, along with Alloherpesviridae and Malacoherpesviridae families. Herpesviridae family is divided in three subfamilies (i) Alphaherpesvirinae, (ii) Betaherpesvirinae and (iii) Gammaherpevirinae, that vary in the main site of latent infection, as listed in Table 1.1..
21 Table 1. 1. Human herpesvirus and some of their characteristics (Adapted from Davison, 2010).
Besides the site of latent infection, the members of this family also differ significantly in some properties such as the features of their DNAs, content and linear arrangement of the genes in viral genomes, host range, duration of the replication cycle and the mechanism by which the viruses maintain the latent state in the host (Davison, 2010).
Virus Abbreviation ICTVspecies
name Subfamily
Main site of latent infection Genome size (kbp) Herpes simplex virus type 1 HSV-1 Human herpesvirus 1 Alpha Herpesvirinae Sensory nerve ganglia ≅ 152 Herpes simplex virus type 2 HSV-2 Human herpesvirus 2 ≅ 154 Varicella-zoster virus VZV Human herpesvirus 3 ≅ 125 Human Cytomegalovirus HCMV Human herpesvirus 5 Beta Herpesvirinae Secretory glands, kidneys and cells
of the reticuloendothelial system ≅ 230 Human herpesvirus 6 HHV-6 Human herpesvirus 6 ≅ 159 Human herpesvirus 7 HHV-7 Human herpesvirus 7 ≅ 144
Epstein-Barr virus EBV Human
herpesvirus 4 Gamma Herpesvirinae B cells ≅ 171 Kaposi’s sarcoma-associated herpesvirus KSHV Human herpesvirus 8 ≅ 140
22
1.3. The Gammaherpesvirinae subfamily
The Gammaherpesvirinae subfamily includes four genera based on genomic organization and DNA homology: Lymphocryptovirus (gamma-1-herpesvirus), Rhadinovirus (gamma-2-herpesvirus), Macavirus and Percavirus (Simas and Efstathiou, 1998). In humans, two gammaherpesviruses have been identified: Epstein-Barr virus (EBV), that belongs to genus Lymphocryptovirus, and Kaposi’s sarcoma-associated herpesvirus (KSHV), included in genus Rhadinovirus (Baer et al., 1984; Davison et al., 2009). Likewise, the murine herpesvirus 68 (MHV-68), the mouse homologue of KSHV, also belongs to Rhadinovirus (Virgin IV et al., 1997).
Gammaherpesvirinae, similarly to all the herpesvirus, encodes several genes that can manipulate the host cell machinery and establish a lifelong infection. The main site of latent infection of gammaherpesviruses is the nucleus of lymphoid cell populations, particularly B cells, where the viral episome is maintained in the nucleus and replicated along with cellular mitosis (Damania, 2004; Barton et al., 2011). Thereby, both EBV and KSHV induce lymphoproliferative diseases and lymphomas in hosts with a compromised immune system (Nash et al., 2001; Cesarman, 2011). EBV and KSHV are also related with the development of human cancers, which distinguishes themselves from other viruses (Wen and Damania, 2010).
1.3.1. Kaposi’s sarcoma-associated herpesvirus
Kaposi’s sarcoma-associated herpesvirus, also known as human herpesvirus 8, is a member of Gammaherpesvirinae subfamily and the infectious agent responsible for Kaposi’s sarcoma (KS).
KS is a tumour of endothelial cell lineage with an inflammatory component and characterized by cutaneous, visceral, and mucosal lesions. Due to the characteristic lesions, KS was first described in 1872 by Moritz Kaposi as an idiopathic multiple pigmented sarcoma. More than a century later, in 1994, KSHV was discovered by Chang and colleagues and only then described as the cause of KS (Chang et al., 1994).
KSHV has a genome of approximately 165 kbp that consists in nearly 140 kbp of a long unique coding region (LUR) that is flanked by a guanine and cytosine (G+C)-rich long terminal repeat (TR) sequence with 801 bp, that encodes for approximately 86 viral open-reading frames (v-ORF), 12 microRNAs (miRNA), non-coding RNAs (ncRNA) and antisense RNAs (Figure 1.2.) (Renne et al., 1996; Russo et al., 1996; Juillard et al., 2016).
23 Figure 1. 2. Schematic representation of the KSHV genome. TRs (blue), v-ORFs (brown),
miRNAs (dark gray) and ncRNAs (light gray) are represented. Alternative protein names are written in parenthesis. Arrows indicate transcription direction (From Juillard et al., 2016).
Like other herpesvirus, the virion has an icosahedral capsid, a tegument and an envelope that contains glycoproteins that interact with cell-type specific cellular entry receptors (Damania and Cesarman, 2013; Kumar and Chandran, 2016).
Since KSHV is able to infect more than one cell type (mainly B cells, but also endothelial cells, monocytes, epithelial cells and keratinocytes), it is thought that KSHV interacts with ubiquitous cellular molecules (Chakraborty et al., 2012). From this interaction results the delivery of the virion capsid into the cytoplasm, after viral envelope fusion with plasma or endosome membrane where it is uncoated. Then, the genome is transferred to the nucleus where its circularization occurs using the cellular enzymatic machinery. It remains as an episome, entering in a latent state and, consequently, escaping from the DNA-sensing mechanisms of the host (Spear and Longnecker, 2003; Uppal et al., 2015). Sporadically, the virus has bouts of lytic reactivation (Bechtel et al., 2003).
24
1.3.1.1. Lytic phase
The lytic phase allows the replication of the viral genome as well as the production of infectious viral progeny. During the reactivation, the viral genome is linearized, the viral DNA is copied and there are viral genes that are expressed in a chronological order and that can be divided in three groups: immediate-early (IE) genes, delayed-early (DE) genes and late (L) genes (Wilson and Mohr, 2012; Damania and Cesarman, 2013; Purushothaman et al., 2016). IE genes are responsible for controlling transcription. Furthermore, the principal lytic protein, replication and transcription activator (RTA), is encoded by an IE gene. RTA is a transcription factor, encoded by open reading frame (ORF) 50, that triggers several cellular and viral promoters and guarantees the expression of essential viral genes for viral replication (Damania and Cesarman, 2013; Thakker and Verma, 2016). DE genes are expressed after IE genes and encode proteins related with viral DNA replication, a mechanism that occurs after the DE genes phase and produces linear genomes that are packaged into capsids (Damania and Cesarman, 2013). L genes encode all the viral structural proteins, concluding the process of the production of infectious viruses.
Some genes are responsible for blocking innate and adaptative recognitions of the host (Kwun et al., 2007). There are also genes that contribute to tumorigenesis, encoding proteins that damage non-homologous end joining (NHEJ) repair mechanism or inducing DNA double-strand breaks (DSB) (Damania and Cesarman, 2013; Xiao et al., 2013; Purushothaman et al., 2016).
1.3.1.2. Latent phase
The capacity of entering in a latent phase is the characteristic that allows KSHV to maintain a lifelong infection, remaining hidden from the host. To achieve this, the virus keeps the genome circularized, downregulates some cell surface markers typically detected by the immune system of the host, and maintains an extremely limited gene expression (only the genes located in the latency locus are expressed) (Cai et al., 2010; Cesarman et al., 2019). The latency locus is composed by four ORF: ORF71, also called ORFK13, that encodes the viral Fas-associated death domain-like interleukin-1β-converting enzyme-inhibitory protein FLIP); ORF72, that encodes the viral cyclin (v-cyclin) D homolog; ORF73, that encodes latency-associated nuclear antigen (LANA); and ORFK12, that encodes kaposins (A, B and C), signalling proteins. Besides these, there are also some miRNAs that are expressed in this phase, promoting endothelial cell reprogramming, migration and invasion of endothelial cells by activating protein kinase B (AKT) - miR-K12-3 – and impairing the synthesis of RTA to prevent reactivation from latency - miRK9* - (Sarid et al., 1998; Cai et al., 2005; Bellare and Ganem, 2009; Cai et al., 2010; Hansen et al., 2010; Hu et al., 2015). Since miRNAs cannot be identified by the immune system, their expression represents an efficient mechanism for the persistence of KSHV (Coscoy, 2007; Mesri et al., 2010).
25 LANA, v-cyclin and v-FLIP promote tumorigenesis by interfering with some pathways responsible for cell growth and apoptosis, and by inhibiting tumour suppressors. These mechanisms are essential for the persistence of the virus, once the replication of viral genome occurs at the same time of the replication of cellular genome, so the G1/S checkpoint arrest and apoptotic programs have to be inhibited in order to allow the persistence of the viral infection (Dittmer, 1998; Moore and Chang, 2003). v-FLIP promotes vascular proliferation, as well as an inflammatory phenotype in endothelial cells (Ballon et al., 2015). However, in contrast to lytic genes being expressed in a very low proportion of tumour cells, latent genes are expressed in all tumour cells (Damania and Cesarman, 2013).
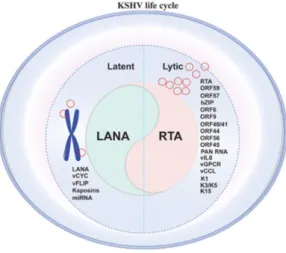
The interchange between latent and lytic phases is triggered by certain physiological and environmental factors, such as oxidative stress, hypoxia, co-infection, inflammation, host immune suppression and pharmacological agents, being controlled by the interplay of RTA and LANA (Figure 1.3.) (Cai et al., 2010; Purushothaman et al., 2016). A perfect balance between the two life cycle phases is essential for the lifelong persistence of the virus (Ohsaki and Ueda, 2012; Purushothaman et al., 2016).
Figure 1. 3. Representation of the two phases of KHSV life cycle, regarding the genes
26
1.3.1.2.1. KSHV latency-associated nuclear antigen
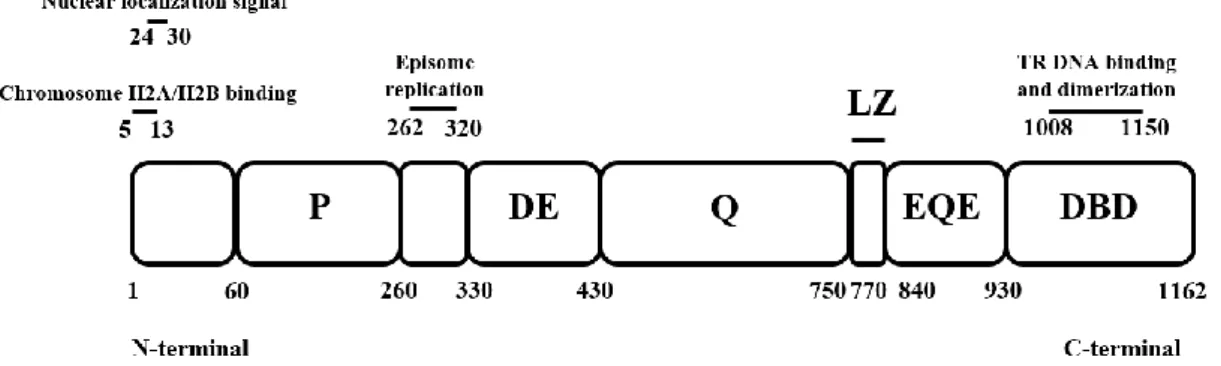
KSHV latency-associated nuclear antigen (kLANA) is a dimer protein encoded by the ORF73 and it is an essential protein expressed during latent phase (Purushothaman et al., 2016). It is a 1162 amino acid protein constituted by several parts: a proline-rich N-terminal domain; an internal repeat region constituted by aspartate-glutamate, glutamine, and glutamate-glutamine regions; a predicted leucine zipper; and a C-terminal DNA binding domain (Figure 1.4.) (Komatsu et al., 2004; Uppal et al., 2014).
Figure 1. 4. Schematic representation of kLANA protein, divided by the different parts which
constitute it, namely the proline-rich (P), the aspartate and glutamate (DE), the glutamine (Q), the leucine zipper (LZ), the glutamate and glutamine (EQE) and the DNA binding domain (DBD) regions. Numbers indicate amino acid residues (Adapted from Piolot et al., 2001, De Leon Vazquez et al., 2013, Ponnusamy et al., 2015).
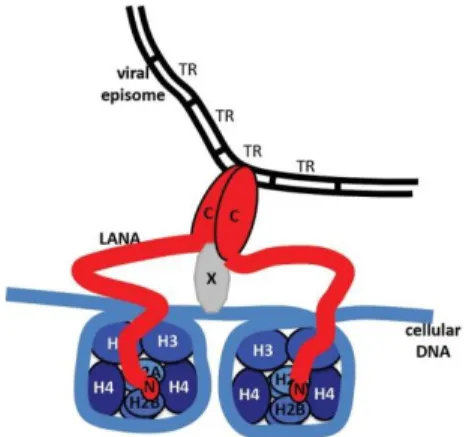
kLANA is vital for the long-term persistence of viral episome, being responsible for the segregation and replication of TR-containing plasmids in proliferating cells by acting directly on the TR of the virus (Ballestas et al., 1999; Ye et al., 2004). Through its N-terminal domain, a flexible and disordered region, kLANA is attached to the cell chromosomes via histones H2A and H2B, on the surface of the nucleosome (Figure 1.5.) (Decker et al., 1996; Ballestas et al., 1999; Ballestas & Kaye, 2001; Barbera et al., 2006). C-terminal, a stable and ordered region, contains a DNA binding domain that recognizes two kLANA binding sites (LBS) located in the terminal repeats of the episome – LBS-1 and LBS-2 – to which kLANA binds. There is LBS-3, also designated by replication element (RE). It is thought that the LBS-RE constitutes the latent DNA origin of replication (ori-P) (Ueda, 2012). The internal region is the less studied, but it was found that it adds stability to kLANA, decelerates protein synthesis, suppresses proteosomal degradation and it is also related with the efficiency of DNA replication (Kwun et al., 2007; De Leon Vazquez et al., 2013). Among KSHV strains, the length of the internal repeat region varies, resulting in kLANA molecules with different sizes (Gao et al., 1999).
27 The interaction with both mitotic chromosomes and viral episome is essential for viral persistence, since it allows passive segregation of viral DNA to progeny nuclei during mitosis and maintenance of a stable copy number in latently infected cells (Figure 1.5.) (Ballestas & Kaye, 2001; Uppal et al., 2014). kLANA is also essential for several processes that involve cellular machinery, such as the replication of the episome, recruiting host cell DNA replication system (Sun et al., 2014); modulation of host cell gene expression, interacting with transcription factors (Uppal et al., 2014); and regulation of cell growth and survival, interacting with cellular proteins (Verma et al., 2007). Moreover, the maintenance of viral latency is responsibility of kLANA, that acts by repressing the transcriptional activity of RTA. kLANA can regulate these processes by modulating both cellular and viral gene expression (Lan et al., 2004).
Figure 1. 5. Schematic representation of tethering mechanism of kLANA to a chromosome.
N-terminal (N) associates with histones H2A and H2B while C-N-terminal (C) binds to N-terminal repeats (TR) of KSHV episome and to a putative protein (X) that associates with the mitotic chromosome (From Juillard et al., 2016).
Tumorigenesis is also related with kLANA, which is expressed at high levels in tumours cells (Komatsu et al., 2001). kLANA interacts with p53, a tumour suppressor protein, whose stability is regulated by the ubiquitin ligase activity of the murine double minute 2 (MDM2), a negative regulator of p53, that is also a target for kLANA. MDM2 inhibits the function of p53 in two distinct ways. It blocks the transcriptional activity of p53 by binding directly to the transcriptional activation domain of p53. Additionally, as an E3 ligase, MDM2 ubiquitinates p53, inducing its nuclear export and proteosomal degradation (Moll and Petrenko, 2003). Thus, the formation of the MDM2-p53 complex inhibits p53, leading to the suppression of cellular apoptosis and development of a tumour (Petre et al., 2007; Di Domenico et al., 2016). In addition, this complex is very important for KSHV latency, as it allows kLANA to bind to cellular DNA and to stabilize itself (Paul et al., 2011).
Essentially, kLANA is a multifunctional protein that regulates both virus and host DNA transcription, as well as the episomal maintenance and lytic reactivation, viral genome replication, tumorigenesis and KSHV latency (Verma et al., 2007). Therefore, kLANA is potentially a good target to clear the viral infection.
28
1.3.1.3. KSHV-related Diseases
1.3.1.3.1. Kaposi’s sarcoma
KS, the principal malignancy associated to KSHV infection, can be divided in four subtypes, according to the epidemiology and clinical manifestations: classic, characterized by few lesions and restricted to lower limbs, found in ethnic groups from regions where KSHV highly occurs; iatrogenic, that occurs after a solid-organ allograft and presents, essentially, cutaneous lesions; endemic, in which children (mostly sub-Saharan Africa) present lymph nodes and a very violent form of the disease; and acquired immunodeficiency syndrome (AIDS)-associated, that presents cutaneous lesions on the limbs, face and trunk and often mucosal and visceral lesions, as well as tumour-associated oedema (Cai et al., 2010; Wen and Damania, 2010). KSHV can be transmitted by sexual and non-sexual modes, including saliva, blood and organ transplant (Vitale et al., 2001; Mbulaiteye et al., 2006; Bagni and Whitby, 2009; Uppal et al., 2014).
1.3.1.3.2. Other diseases associated to KSHV
Although the most common disease caused by KSHV is KS, primary effusion lymphoma (PEL), multicentric Castleman disease (MCD) and KSHV-associated inflammatory cytokine syndrome (KICS) are also consequences of KSHV infection. PEL, originally called body cavity lymphoma, is a B cell lymphoma that affects mostly body cavities, such as peritoneal and pericardial, and can also be manifested as solid lesions outside of cavities. This disease is commonly related with co-infection with EBV (Nador et al., 1996; Chadburn et al., 2004; Narkhede et al., 2018). MCD is a lymphoproliferative disorder characterized by abnormal lymph nodes (in size, number or consistency) and systemic symptoms. It is thought that the symptoms are a consequence of excessive production of inflammatory cytokines, such as IL-6. MCD is highly found in patients with human immunodeficiency virus (HIV) infection (Polizzotto et al., 2013). KICS is a systemic disease, displaying symptoms of systemic inflammation and cytokine release without any indicator of generalized lymphadenopathy or histological features of MCD. Patients with KICS recurrently have other KSHV- associated tumours (Polizzotto et al., 2016a). KSHV are also related with rare cases of bone marrow failure, hepatitis, acute inflammatory syndromes and KSHV immune reconstitution inflammatory syndrome (IRIS) (Giffin and Damania, 2014; Mariggiò et al., 2017).
29
1.3.1.4. Epidemiology
Currently, the highest seroprevalence of KSHV is in sub-Saharan Africa, where the occurrence can get up to 90% in adults of some populations. Although the virus can be found in 20-30% of the Mediterranean population, in Asia, northern Europe and United States of America, it affects less than 10%. The geographical variation is not completely understood, but environmental factors, like co-infection with malaria and other parasitic infections, might increase shedding of KSHV in saliva, increasing transmission rates (Wakeham et al., 2011). The geographical variance in the occurrence of KS reflects differences in the prevalence of KSHV (Figure 1.6.) (Mesri et al., 2010). It is known that KS was rare before the AIDS epidemic, in the 1980s, when the occurrence of KS increased, reflecting the impact of sexual transmission (Grulich et al., 1992).
Figure 1. 6. Geographical prevalence of KS age-standardized incidence rates per 100.000 (a)
30
1.3.2. Murine herpesvirus 68
MHV-68 is a gamma-2-herpesvirus and is the mouse homologue of KSHV. MHV-68 is able to establish a lifelong latent infection (Sunil-Chandra et al., 1992a). It was first isolated from free-living rodents like bank voles (Myodes glareolus) and yellow-necked field mice (Apodermus flavicollis), in Slovakia (Blaskovic et al., 1980). However, the wood mice (Apodermus sylvaticus) is the natural reservoir of this virus (Blasdell et al., 2003).
The MHV-68 genome is composed by a 118 kbp of a unique sequence of DNA flanked by multiple copies of 1213 bp terminal repeats and has a G+C content of approximately 45% (Efstathiou et al., 1990). The virus encodes around 80 genes, 63 of them collinear with herpesvirus saimiri (HVS) and KSHV, and some of them homologous to cellular genes (Simas and Efstathiou, 1998; Nash et al., 2001).
MHV-68 is capable of infecting laboratory mice (Mus musculus), contrarily to KSHV (Speck and Ganem, 2010).
1.3.2.1. MHV-68 latency-associated nuclear antigen
MHV-68 latency-associated nuclear antigen (mLANA), also encoded by ORF73, is homologous to human KSHV LANA, both in function and sequence, namely
in the C-terminal domain and N-terminal proline rich region (Figure 1.7.) (Correia et al., 2013). However, since mLANA has a lack of internal acidic and glutamine-rich repeat elements, it is smaller than kLANA, being composed by 314 amino acids (Barton et al., 2011; Habison et al., 2012).
mLANA is expressed in germinal centre (GC) B cells and it is essential for MHV-68 to establish an efficient latent infection in mice, since it has a DNA binding domain that acts on the TRs elements of the MHV-68 genome and both N- and C- terminals that interact with cellular proteins (Fowler et al., 2003; Marques et al., 2003; Moorman et al., 2003; Habison et al., 2012; Correia et al., 2013).
31 Figure 1. 7. Schematic representation of the comparison between kLANA and mLANA
proteins. Shaded regions represent homology between proteins and unshaded regions lack homology. The intensity of the shade refers to the level of homology (dark means more homology). Proline-rich (P), the aspartate and glutamate (DE), the glutamine (Q), the leucine zipper (LZ), the glutamate and glutamine (EQE) and the DNA binding domain (DBD) regions. Numbers indicate amino acid residues (Adapted from Habison et al., 2012; Ponnusamy et al., 2015).
1.3.2.2. MHV-68 infection
After MHV-68 infection, mice develop an acute lytic infection in the lungs, affecting alveolar epithelial cells, which is cleared by the immune system of the host from 9 to 12 days post-infection (dpi) (Sunil-Chandra et al., 1992a; Sunil-Chandra et al., 1992b).
Then, the virus infects naïve B cells and disseminates to lymph nodes via dendritic cells and helper T cells. After that, it reaches the spleen by infecting marginal zone (MZ) macrophages first, and then MZ B cells, followed by GC B cells (Frederico et al., 2014). There occurs an expansion of latently infected B cells trough GC reaction. This reaction is marked by fast proliferation, somatic hypermutations (SHM) and class switch recombination (CSR), in order to increase the antibody/antigen affinity. Then, an interaction with follicular dendritic and T cells occurs, in which cells with low affinity suffer apoptosis, and the ones that survive can differentiate into memory B cells, the principal long-term reservoir of the virus (Figure 1.8.) (Sunil-Chandra et al., 1992b; Simas et al., 1999; Flaño et al., 2002). The peak of latency (approximately 14 dpi) is coupled with splenomegaly and followed by a decrease in the number of infected cells that ultimately reach a steady-state level (Simas and Efstathiou, 1998). MHV-68 latent infection is established predominantly in B cells, but macrophages, dendritic and epithelial cells can also be latently infected (Stewart et al., 1998; Weck et al., 1999; Flaño et al., 2000; Marques et al., 2003).