No Reliable Association between Runs of
Homozygosity and Schizophrenia in a
Well-Powered Replication Study
Emma C. Johnson1,2*, Douglas W. Bjelland2, Daniel P. Howrigan3,4,5, Abdel Abdellaoui6, Gerome Breen7, Anders Borglum8,9,10,11, Sven Cichon12,13,14,15,
Franziska Degenhardt12,15, Andreas J. Forstner12,15, Josef Frank16, Giulio Genovese4, Stefanie Heilmann-Heimbach12,15, Stefan Herms12,13,15, Per Hoffman12,13,15,
Wolfgang Maier17, Manuel Mattheisen15, Derek Morris18, Bryan Mowry19,20,
Betram Mu¨ller-Mhysok21,22,23, Benjamin Neale3,4,5, Igor Nenadic24, Markus M. No¨then12,15, Colm O’Dushlaine25, Marcella Rietschel16, Douglas M. Ruderfer26, Dan Rujescu27,28, Thomas G. Schulze29, Matthew A. Simonson30, Eli Stahl4,26, Jana Strohmaier16, Stephanie H. Witt16, Schizophrenia Working Group of the Psychiatric Genomics Consortium¶, Patrick F. Sullivan31,32,33, Matthew C. Keller1,2*
1Department of Psychology and Neuroscience, University of Colorado at Boulder, United States of America,2Institute for Behavioral Genetics, University of Colorado at Boulder, United States of America,
3Center for Human Genetic Research, Massachusetts General Hospital, Boston, Massachusetts, United States of America,4Broad Institute, Cambridge, Massachusetts, United States of America,5Analytic and Translational Genetics Unit, Massachusetts General Hospital, Boston, United States of America,
6Department of Biological Psychology, VU University Amsterdam, Amsterdam, Netherlands,
7IDepartment of Social Genetic and Developmental Psychiatry, King’s College London, London, United Kingdom,8The Lundbeck Foundation Initiative for Integrative Psychiatric Research, iPSYCH, Denmark,
9Centre for Integrative Sequencing, iSEQ, Aarhus University, Aarhus, Denmark,10Department of Biomedicine, Aarhus University, Aarhus, Denmark,11Department P, Aarhus University Hospital, Risskov, Denmark,12 Department of Genomics, Life and Brain Center, University of Bonn, Germany,13Division of Medical Genetics, Department of Biomedicine, University Basel, Basel, Switzerland,14 Institute of Neuroscience and Medicine (INM-1), Structural and Functional Organisation of the Brain, Genomic Imaging, Research Centre Juelich, Juelich, Germany,15 Institute of Human Genetics, University of Bonn, Bonn, Germany,16 Department of Genetic Epidemiology in Psychiatry, Central Institute of Mental Health, Medical Faculty Mannheim / Heidelberg University, Mannheim, Germany,17 Department of Psychiatry, University of Bonn, Bonn, Germany,18Department of Psychiatry & Neuropsychiatric Genetics Research Group, School of Medicine, The Trinity Centre for Health Sciences, St. James’s Hospital, Ireland,19 Queensland Centre for Schizophrenia Mental Health Research, The Park, Centre for Mental Health, Wacol, Australia,
20Department of Psychiatry, University of Queensland, Brisbane, Australia,21 Max Planck Institute of Psychiatry, Munich, Germany,22Munich Cluster for Systems Neurology (SyNergy), Munich, Germany,
23University of Liverpool, Institute of Translational Medicine, Liverpool, United Kingdom,24 Department of Psychiatry and Psychotherapy, Jena University Hospital, Jena, Germany,25 Neuropsychiatric Genetics Research Group, Department of Psychiatry and Institute of Molecular Medicine, Trinity College Dublin, Ireland,26 Division of Psychiatric Genomics, Department of Psychiatry, Icahn School of Medicine at Mount Sinai, New York, NY, United States of America,27Molecular and Clinical Neurobiology, Department of Psychiatry, Ludwig-Maximilians-University, Munich, Germany,28Department of Psychiatry, University of Halle-Wittenberg, Halle, Germany,29Institute for Psychiatric Phenomics and Genomics (IPPG), Ludwig-Maximilians-University, Munich, Germany,30Mayo Clinic, Department of Health Sciences, Division of Biomedical Statistics and Informatics, Rochester, Minnesota, United States of America,31 Department of Medical Epidemiology and Biostatistics, Karolinska Institute, Stockholm, Sweden,32Department of Genetics, University of North Carolina, Chapel Hill, NC, United States of America,33Department of Psychiatry, University of North Carolina, Chapel Hill, NC, United States of America
¶Membership of the Schizophrenia Working Group of the Psychiatric Genomics Consortium is provided in
the acknowledgments.
*[email protected];[email protected]. a11111
OPEN ACCESS
Citation:Johnson EC, Bjelland DW, Howrigan DP, Abdellaoui A, Breen G, Borglum A, et al. (2016) No Reliable Association between Runs of
Homozygosity and Schizophrenia in a Well-Powered Replication Study. PLoS Genet 12(10): e1006343. doi:10.1371/journal.pgen.1006343
Editor:Amanda J. Myers, University of Miami, Miller School of Medicine, UNITED STATES
Received:April 14, 2016
Accepted:September 7, 2016
Published:October 28, 2016
Copyright:©2016 Johnson et al. This is an open access article distributed under the terms of the
Creative Commons Attribution License, which permits unrestricted use, distribution, and reproduction in any medium, provided the original author and source are credited.
Data Availability Statement:Genotype data for the samples where the ethics permit deposition are available upon application from the NIMH Genetics Repository (https://www.nimhgenetics.org).
Abstract
It is well known that inbreeding increases the risk of recessive monogenic diseases, but it is less certain whether it contributes to the etiology of complex diseases such as schizophre-nia. One way to estimate the effects of inbreeding is to examine the association between disease diagnosis and genome-wide autozygosity estimated using runs of homozygosity (ROH) in genome-wide single nucleotide polymorphism arrays. Using data for schizophre-nia from the Psychiatric Genomics Consortium (n = 21,868), Keller et al. (2012) estimated that the odds of developing schizophrenia increased by approximately 17% for every addi-tional percent of the genome that is autozygous (β= 16.1, CI(β) = [6.93, 25.7],Z= 3.44,p= 0.0006). Here we describe replication results from 22 independent schizophrenia case-con-trol datasets from the Psychiatric Genomics Consortium (n = 39,830). Using the same ROH calling thresholds and procedures as Keller et al. (2012), we were unable to replicate the significant association between ROH burden and schizophrenia in the independent PGC phase II data, although the effect was in the predicted direction, and the combined (original + replication) dataset yielded an attenuated but significant relationship betweenFrohand schizophrenia (β= 4.86,CI(β) = [0.90,8.83],Z= 2.40,p= 0.02). Since Keller et al. (2012), several studies reported inconsistent association of ROH burden with complex traits, partic-ularly in case-control data. These conflicting results might suggest that the effects of auto-zygosity are confounded by various factors, such as socioeconomic status, education, urbanicity, and religiosity, which may be associated with both real inbreeding and the out-come measures of interest.
Author Summary
It is well known that mating between relatives increases the risk that a child will have a rare recessive genetic disease, but there has also been increasing interest and inconsistent findings on whether inbreeding is a risk factor for common, complex psychiatric disorders such as schizophrenia. The best powered study to date investigating this theory predicted that the odds of developing schizophrenia increase by approximately 17% for every addi-tional percent of the genome that shows evidence of inbreeding. In this replication, we used genome-wide single nucleotide polymorphism data from 18,562 schizophrenia cases and 21,268 controls to quantify the degree to which they were inbred and to test the hypothesis that schizophrenia cases show higher mean levels of inbreeding. Contrary to the original study, we did not find evidence for distant inbreeding to play a role in schizo-phrenia risk. There are various confounding factors that could explain the discrepancy in results from the original study and our replication, and this should serve as a cautionary note–careful attention should be paid to issues like ascertainment when using the data from genome-wide case-control association studies for secondary analyses for which the data may not have originally been intended.
Introduction
Close inbreeding (e.g., cousin-cousin mating) is known to decrease fitness in animals[1] and to increase risk for recessive Mendelian diseases in humans[2], a phenomenon known as
Runs of Homozygosity and Schizophrenia Replication
inbreeding depression. Inbreeding depression is thought to occur due to evolutionary selection against genetic variants that decrease fitness—e.g., variants that increase risk of disorders[3]. Such fitness-reducing variants should not only be more rare, but also more recessive than expected under a neutral evolution model (i.e., show directional dominance). If so, individuals with a greater proportion of their genome in autozygous stretches (two homologous segments of a chromosome inherited from a common ancestor identical by descent [IBD]) should have higher rates of disorders. This is because autozygous regions reveal the full, harmful effects of any deleterious, recessive alleles that existed on the haplotype of the common ancestor.
Whether inbreeding increases risk for complex disorders like schizophrenia is less clear. Previous studies have found that inbreeding is associated with higher rates of complex disor-ders[4–9]. However, sample sizes have typically been small and the possibility that confound-ing factors might explain the results has left the links inconclusive. Moreover, close inbreedconfound-ing accounts for fewer than 1% of marriages in industrialized countries[10], and information on pedigrees going back many generations is difficult to collect reliably. For these reasons, investi-gators have recently begun looking at signatures of very distant inbreeding (e.g., common ancestry up to ~100 generations ago) using genome-wide single nucleotide polymorphism (SNP) data in an attempt to understand whether autozygosity increases the risk to schizophre-nia and other complex diseases[11]. Autozygosity in SNP data is typically inferred from runs of homozygosity (ROHs): long, contiguous stretches (e.g.,>40) of homozygous SNPs. The pro-portion of the genome contained in such ROHs,Froh, can then be used to predict complex traits[12–19]. Keller et al.[11] showed thatFrohis the optimal method for detecting inbreeding signals that are due to rare, recessive to partially recessive mutations, such as those thought to occur when traits are under directional selection[3]. The low variation inFrohmeans that large sample sizes (e.g.,>12,000) are required to uncover realistic effects of distant inbreeding on complex diseases in samples unselected for inbreeding[11].
In 2012, Keller et al.[20] used the original Psychiatric Genomics Consortium schizophrenia data (17 case-control datasets, totaln= 21,831) to investigate whetherFrohis associated with increased risk of schizophrenia. The authors estimated that the odds of developing schizophrenia increased by approximately 17% for every additional percent of the genome that is contained in autozygous regions (β= 16.1, CI(β) = [6.93, 25.7],p= 6x10⁻⁴.) This was by far the largest study to that date examining the association betweenFrohand any psychiatric disorder, and the signifi-cant relationship betweenFrohand case-control status remained robust through secondary anal-yses of various covariate combinations, common vs. rare IBD haplotypes, and SNP thresholds used to define ROHs. These results are consistent with the hypothesis that autozygosity causally increases the risk of schizophrenia. Nevertheless, because various confounding factors may increase likelihood of distant inbreeding as well as the probability of having offspring with phrenia, these results do not imply a causal relationship. For example, parents higher on schizo-phrenia liability may pass their higher liability to offspring and mate with more genetically similar partners (e.g., due to decreased mobility, educational opportunities, etc.).
The current study seeks to provide a well-powered, independent replication of Keller et al. (2012)[20]. In light of the growing concern about publication bias[21,22] and dearth of well-powered replications[23,24], this follow-up analysis is a necessary step in validating theFroh—
Results
SNP data from 28,985 schizophrenia cases and 35,017 controls were collected as detailed in Ripke et al.[25]. Quality control (QC) and analyses were conducted separately for the original and replication datasets. The “original” dataset included subjects from the PGC’s SCZ1[26] samples used by Keller et al[20] (n= 21,868 after QC), and the “replication” dataset contained all subjects (n= 39,830 after QC) in the PGC SCZ2[25] samples not included in the original Keller et al. study, making the replication dataset independent of the original dataset analyzed in Keller et al.
Despite the number of imputed SNPs ranging from ~1.8 million to ~4.2 million in the data-sets, there were not enough well imputed SNPs in common across all 22 datasets to conduct a viable ROH analysis in the same way as in the original study (seeMethods). Nevertheless, Kel-ler et al. also reported results from ROHs estimated from unimputed SNP data, and these results were highly consistent with imputed SNPs. Therefore, our primary analyses were con-ducted using post-QC, unimputed genotype data. We also report results on imputed SNPs (see
S5–S12Figs andS1 Table) using slightly different QC procedures than used in the original report (seeMethods), which do not change the conclusions below. While ROHs from the imputed data were called from a common SNP set, ROHs from the unimputed data were called on unique sets of SNPs for each dataset.
Keller et al.[20] found that all ROH length thresholds were significantly associated with schizophrenia, but because ROH thresholds are ultimately arbitrary, they focused their discus-sion on the thresholds (e.g., 110 consecutive homozygous SNPs in the unimputed data) that maximized the schizophrenia-ROH relationship. In an attempt to follow as closely as possible the method used by Keller et al., we report two sets of ROH results. The first approach—a direct replication attempt of Keller et al.—defined ROHs as being110 consecutive homozy-gous SNPs in a row (with median Mb ranging from ~1 to ~3.4 Mb, depending on sample) in the unimputed data. Because using unimputed SNP data introduces large differences in mean ROH length across datasets (when defined by number of consecutive homozygous SNPs) due to varying SNP densities, we also employed a secondary replication approach using a 2.3 Mb minimum length threshold that corresponds to 110 SNPs-in-a-row average length in the origi-nal report. As in the origiorigi-nal report, we also show results across all thresholds to ensure that no results were missed.
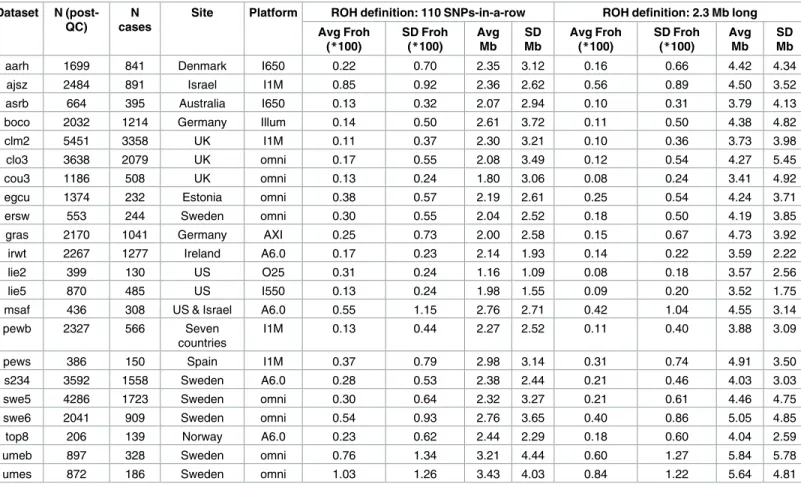
Table 1gives the descriptive statistics for average ROH lengths andFrohacross datasets, where ROHs were defined as110 consecutive homozygous SNPs. There was wide variation in averageFrohand ROH lengths between datasets, a consequence of using unimputed SNP data, which introduces more between-dataset variability inFrohand mean ROH length[20]. Across datasets, meanFrohwas also higher (0.30% vs. 0.14%) and average ROH lengths shorter (1.1–3.4 Mb vs. 2.0–4.7 Mb) in the replication versus original datasets. Part of the reason for the meanFrohdiscrepancy seemed to be due to replication datasets being genotyped on denser SNP chips, because this discrepancy reduced when we defined ROHs as2.3 Mb homozygous SNPs (0.22% vs. 0.13%;Table 1). The remaining higher averageFrohin the replication datasets appears to be due to more samples being from countries with higher overallFroh(e.g., Sweden, Estonia, Israel) in the replication datasets; the averageFrohlevels were very similar across repli-cation vs. original datasets within the same countries.
ROH burden results
For each dataset, we regressed case-control status onFrohusing mixed effects logistic regres-sion treating dataset as a random factor, and controlled for 20 principal components (PCs) from the genomic relationship matrix[27] and two SNP quality measures (excess
heterozygosity and SNP missingness; seeMethods). In Keller et al. (2012), the authors used mixed effects models to test the ROH burden association with schizophrenia. However, in the current analysis we used fixed effect logistic regression models, treating dataset as a fixed, because a minority of the mixed effects models failed to converge. When the mixed effects models did converge, the results were highly similar to the respective fixed effect models. Figs1
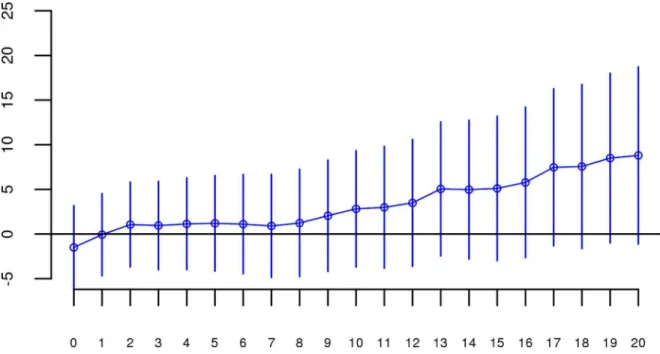
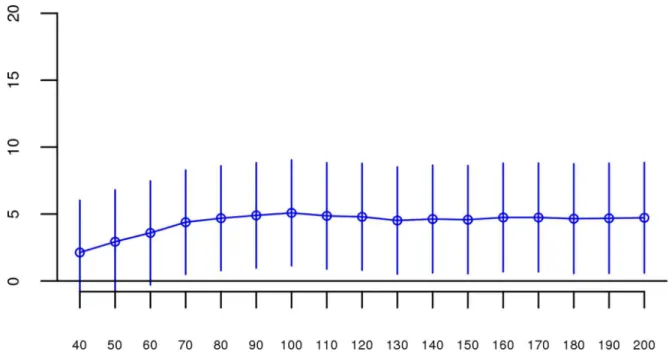
andS1show the predicted change in odds of schizophrenia risk (and 95% confidence intervals) for every 1% increase in averageFrohfor each logistic regression in the replication data using ROHs defined by either110 consecutive homozygous SNPs (Fig 1) or ROH length2.3 Mb (S1 Fig). The overall association between schizophrenia andFrohin the replication data was in the predicted direction but not significant for ROHs defined as at least 110 consecutive homo-zygous SNPs (β= 0.19, CI(β) = [−4.50,4.88],Z= 0.08,p= 0.94) or for ROHs defined as2.3 Mb (β= 0.75, CI(β) = [−4.05,5.56],Z= 0.31,p= 0.76). The results from analyses on ROHs called from imputed rather than raw SNP data were also non-significant (S5 Fig). As in Keller et al., we also explored increasingly long SNP and Mb ROH thresholds to assess the stability of theFroh-schizophrenia relationship (Figs2and3). Across all thresholds, the only thresholds that approached significant associations betweenFrohand schizophrenia in the replication data were at the upper limits of the Mb-length ROH thresholds; the strongest association was for ROHs defined as19 Mb (β= 8.64, CI(β) = [−0.85,18.13],Z= 1.78,p= 0.07).
We conducted a series of follow-up analyses to ensure that the failure to replicate our origi-nal report was not due to aorigi-nalytical error, inclusion of outlier individuals or datasets, or Table 1. Descriptive data for the unimputed (post-QC) PGC replication data—ROHs defined as110 consecutive homozygous SNPs or as2.3 Mb long.
Dataset N (post-QC)
N cases
Site Platform ROH definition: 110 SNPs-in-a-row ROH definition: 2.3 Mb long
Avg Froh (*100)
SD Froh (*100)
Avg Mb
SD Mb
Avg Froh (*100)
SD Froh (*100)
Avg Mb
SD Mb
aarh 1699 841 Denmark I650 0.22 0.70 2.35 3.12 0.16 0.66 4.42 4.34
ajsz 2484 891 Israel I1M 0.85 0.92 2.36 2.62 0.56 0.89 4.50 3.52
asrb 664 395 Australia I650 0.13 0.32 2.07 2.94 0.10 0.31 3.79 4.13
boco 2032 1214 Germany Illum 0.14 0.50 2.61 3.72 0.11 0.50 4.38 4.82
clm2 5451 3358 UK I1M 0.11 0.37 2.30 3.21 0.10 0.36 3.73 3.98
clo3 3638 2079 UK omni 0.17 0.55 2.08 3.49 0.12 0.54 4.27 5.45
cou3 1186 508 UK omni 0.13 0.24 1.80 3.06 0.08 0.24 3.41 4.92
egcu 1374 232 Estonia omni 0.38 0.57 2.19 2.61 0.25 0.54 4.24 3.71
ersw 553 244 Sweden omni 0.30 0.55 2.04 2.52 0.18 0.50 4.19 3.85
gras 2170 1041 Germany AXI 0.25 0.73 2.00 2.58 0.15 0.67 4.73 3.92
irwt 2267 1277 Ireland A6.0 0.17 0.23 2.14 1.93 0.14 0.22 3.59 2.22
lie2 399 130 US O25 0.31 0.24 1.16 1.09 0.08 0.18 3.57 2.56
lie5 870 485 US I550 0.13 0.24 1.98 1.55 0.09 0.20 3.52 1.75
msaf 436 308 US & Israel A6.0 0.55 1.15 2.76 2.71 0.42 1.04 4.55 3.14
pewb 2327 566 Seven
countries
I1M 0.13 0.44 2.27 2.52 0.11 0.40 3.88 3.09
pews 386 150 Spain I1M 0.37 0.79 2.98 3.14 0.31 0.74 4.91 3.50
s234 3592 1558 Sweden A6.0 0.28 0.53 2.38 2.44 0.21 0.46 4.03 3.03
swe5 4286 1723 Sweden omni 0.30 0.64 2.32 3.27 0.21 0.61 4.46 4.75
swe6 2041 909 Sweden omni 0.54 0.93 2.76 3.65 0.40 0.86 5.05 4.85
top8 206 139 Norway A6.0 0.23 0.62 2.44 2.29 0.18 0.60 4.04 2.59
umeb 897 328 Sweden omni 0.76 1.34 3.21 4.44 0.60 1.27 5.84 5.78
umes 872 186 Sweden omni 1.03 1.26 3.43 4.03 0.84 1.22 5.64 4.81
Fig 1. Estimated changes in odds of schizophrenia for each 1% increase inFroh(odds ratios; asterisks) and their 95% confidence intervals (bars) across the independent replication datasets (colored according to SNP platform) and for the total sample (black) from the unimputed SNP data, for ROHs defined as110 consecutive homozygous SNPs.Boxes are proportional to the square root of sample sizes (also shown at the bottom). Dataset names are on the x-axis. Only one of the individual estimated odds ratios significantly differs from one (“clm2” dataset), and the overall effect (black) isnotsignificant (β= 0.19,Z= 0.08,p= 0.94).
doi:10.1371/journal.pgen.1006343.g001
Fig 2. Slope estimates (the change in log odds for a 1% increase inFroh; points) and their 95% confidence intervals (bars) ofFrohfrom unimputed SNP data predicting schizophrenia for different SNP thresholds of calling ROHs.No SNP homozygosity threshold was significant.
doi:10.1371/journal.pgen.1006343.g002
suppressing covariates in the replication data. We reran the same analyses described above on SNP data from the “original” report using the exact same quality control and analytic proce-dures performed on the replication data. Results were virtually identical to those obtained in Keller et al.’s 2012 study (S2–S4Figs), increasing our confidence that the procedures used in the replication attempt were identical to those used in the original analysis and that the results from the original analysis were not due to analytic or procedural errors. We then reran analyses in the replication data after (a) omitting individuals with very long (>30 Mb) ROHs, (b) omit-ting only long ROHs, (c) including all combinations of covariates in the model (SNP missing-ness, average heterozygosity, 10 or 20 principle components), and (d) including only the longest ROH for each individual. TheFroh-schizophrenia relationship remained non-signifi-cant in these follow-up analyses (results shown inS2 Table).
We noticed that there was greater variability inFrohin the replication datasets and that this greater variability was mostly driven by replication datasets that hadn<300. Under the prem-ise that smaller samples might differ in genotypic or phenotypic quality, we excluded seven samples that contained fewer than 300 cases (“egcu”, “ersw”, “lie2”, “pews”, “top8”, “umes”), reran our baseline analysis (including all covariates mentioned above and using an ROH threshold of110 consecutive homozygous SNPs), but still observed a non-significant
Froh-schizophrenia relationship (β= 1.04, CI(β) = [−3.88,5.96],Z= 0.42,p= 0.68) in the predicted direction. Therefore, this post-hoc analysis does not lend support to the possibility that small samples in the replication set added noise to our analysis, obscuring anFroh-schizophrenia relationship.
Although results from the replication analysis were not significant, they were in the same direction as the original analysis. It could therefore be argued that the best estimate of the asso-ciation between ROHs and schizophrenia is obtained by combining the two datasets. When we reran our analyses on the combined original + replication data (n = 61,661), allFroh associa-tions based on ROH thresholds greater than 60 consecutive homozygous SNPs or longer than Fig 3. Slope estimates (the change in log odds for a 1% increase inFroh; points) and their 95% confidence intervals (bars) ofFrohfrom unimputed SNP data predicting schizophrenia for different Mb thresholds of calling ROHs.No Mb length thresholds reached significance.
1 Mb were significant (Figs4and5). For an ROH threshold of110 consecutive homozygous SNPs), we observed a significantFroh-schizophrenia relationship in the combined data (β= 4.86, CI(β) = [0.90,8.83],Z= 2.40,p= 0.02). In this combined dataset, we also used a replica-tion status-by-Frohinteraction to conclude that the Froh-schizophrenia association was only Fig 4. Slope estimates (the change in log odds for a 1% increase inFroh; points) and their 95% confidence intervals (bars) ofFrohfrom the combined unimputed SNP data predicting schizophrenia for different SNP thresholds of calling ROHs.All SNP thresholds greater than 60 SNPs-in-a-row were significant.
doi:10.1371/journal.pgen.1006343.g004
Fig 5. Slope estimates (the change in log odds for a 1% increase inFroh; points) and their 95% confidence intervals (bars) ofFrohfrom the combined unimputed SNP data predicting schizophrenia for different Mb thresholds of calling ROHs.All length thresholds longer than 1 Mb were significant.
doi:10.1371/journal.pgen.1006343.g005
marginally higher in the original compared to the replication datasets (interactionβ= −3.98,
Z= −1.84,p= 0.07) for ROHs defined as at least 110 consecutive homozygous SNPs.
The effects of close versus distant inbreeding
To assess the relative importance of distant versus close inbreeding, we compared the effects of short versus long ROHs. As in the original study, we chose our ROH length threshold based on the Mb length cutoff that resulted in equalFrohvariances, calculatingFroh_shortas the pro-portion of the genome contained in ROHs<8 Mb long, andFroh_longas the proportion of the genome contained in ROHs>8 Mb long. Although neither association was significant, the effect ofFroh_short(β= −5.06, CI(β) = [−12.08,1.95],Z= −1.42,p= 0.16), caused by autozyg-osity arising from more ancient common ancestors, was negative (“protective”) and in the opposite direction of effect ofFroh_long(β= 1.23, CI(β) = [−4.78,7.25],Z= 0.40,p= 0.69), caused by autozygosity arising from more recent common ancestors, which predicted increased risk for schizophrenia (Fig 6).
Discussion
Despite exploring various homozygous SNP length thresholds, Mb thresholds, and combina-tions of covariates, the findings from this study do not lend much support to the original obser-vation of a highly significantFroh-schizophrenia association[20], and provide only equivocal support, based on combining the original and replication data, for the hypothesis that autozyg-osity is a risk factor for schizophrenia.
Perhaps the simplest explanation for this pattern of results is that the conclusions about dis-tant inbreeding from the original data represent a type-I error or that the lack of replication in the current report was a type-II error. Despite the fact that the effect in the original study was highly significant (p= 6x10⁻⁴) and the statistical power in the replication study to detect the observed effect size in the original study was nearly 100%, it is possible that the estimated effects of the original analysis could have been over-estimated and/or those of the replication analysis under-estimated, due to sampling variability. There is some support for this interpre-tation, as there was not a significant difference in results between replication versus original datasets (interactionp= 0.07).
the causation may be reversed: schizophrenia liability in parents could cause not only higher schizophrenia risk, but also higherFroh, in offspring rather thanFrohin offspring increasing their schizophrenia liability. Such reverse and third variable causation possibilities can only be tested if relevant socio-demographic variables in subjects and (optimally) their parents are collected.
The possibility of unmeasured variables confoundingFroh-disorder relationships seems particularly likely in analyses conducted on ascertained samples. Ascertainment of cases and controls not perfectly matched on socio-demographic factors that might affect degree of out-breeding (e.g., socioeconomic status, education level, age, religion, urbanicity) can mask any trueFrohassociation and bias the observed association in either direction. Such a scenario might explain otherwise contradictory findings in previous ROH case-control analyses [18,28,30–36]. For example, following two studies showing that genome-wide autozygosity was significantly associated with schizophrenia risk, including the original Keller et al. study [13,20], two newer studies failed to replicate this association[34,35], although both replication sample sizes (n= 3,400 and 11,244 respectively) were substantially smaller than the current one (n =39,830). (It should be noted that the sample used in the latter study[36] overlapped with the samples in both the original Keller et al.[20] study and the current replication study). Even within the same study,Frohresults in ascertained samples have been inconsistent. Using PGC MDD data, Power et al.[36] found a significant positiveFroh-MDD relationship in data from three German sites but a significantnegative Froh-MDD relationship in six non-German sites. A possible explanation for this and other such examples of heterogeneity across sites they observed is that cases and controls differed on socio-demographic factors that were associated withFroh, and the direction of this ascertainment bias was inconsistent across data collection sites.
We believe that similar ascertainment biases could have affected results in the present study as well as in the original Keller et al.[20] report. Many of the PGC schizophrenia datasets used cases ascertained from hospitals, clinics, health surveys, and advertisements but controls from previous biomedical research volunteers, university students, blood donors, and population registries. While such differences in ascertainment between cases and controls are highly unlikely to lead to allele frequency differences, and thus are of little concern to genome-wide association studies, they could very easily lead toFrohdifferences due to differences in degree of inbreeding/outbreeding in the populations from which cases and controls were drawn. Con-trolling for ancestry principal components in this case would only help to the degree that degree of inbreeding/outbreeding is associated with ancestry. Unfortunately, none of the other variables that might statistically control for such biases due to differences in case/control ascer-tainment are currently available in the PGC data collection. The PGC collection of studies was designed for association analyses; it was not optimally designed for ancillary purposes, such as ROH analyses.
It is important to recognize that even ascertainment biases that differ at random across sites would substantially inflate type-I error rates because the proper degrees of freedom for the test should be closer to the number of independent sites rather than the number of independent cases and controls. To demonstrate this, we permuted data under the null hypothesis of no relationship betweenFrohand schizophrenia in the 17 datasets from the original 2012 study by randomly flipping case or control status within each dataset for each permutation (e.g., cases Fig 6. Forest plot of the change in odds of schizophrenia risk for each 1% increase inFrohdue to short (<8 Mb, blue) or long (>8 Mb, red) ROHs for each sample in the replication.Boxes are proportional to the square root of sample sizes, and 95% confidence intervals are indicated by the horizontal lines. Dataset names are on the y-axis, with the estimates from the combined sample at the bottom.
and control statuses in a dataset either remained the same or were flipped to the opposite sta-tus). We then calculated the overallFroh ~schizophrenia relationship with the same logistic regression model and using the same covariates as in the original analysis. Across 1,000 permu-tations, 183 p-values were significant (p<0.05), implying a type-I error rate of 0.18 and dem-onstrating how false conclusions aboutFrohrelationships can be reached even when
ascertainment biases are random across multiple sites.
Conclusion
Given concerns about the false discovery rate in science[22], there has been increasing empha-sis on the need for well-powered, direct replications of novel findings in genetics[23,37,38] and other fields[39–41]. The current study was a well-powered, direct replication attempt that failed to replicate an earlier finding that autozygosity arising from distant common ancestors was significantly associated with schizophrenia. As is typical with null findings, it is difficult to identify the reason for this failure to replicate. However, we have argued that a likely cause is that ROH associations are highly susceptible to confounding, especially in case-control (ascer-tained) samples. Thus, we believe that the conclusions of the original study were premature and the true causal relationship between schizophrenia and autozygosity could be either stron-ger/more positive (if the populations from which controls were ascertained were, on average, slightly less outbred than populations from which cases were ascertained) or weaker/more neg-ative (the reverse) than reported here. Unfortunately, we do not have the ability to test these hypotheses directly in the current datasets, and doing so awaits either new samples in which cases and controls are carefully matched or the collection of information that allows potential confounders to be statistically controlled. This creates a dilemma for ROH analyses using exist-ing case-control genome-wide data: GWAS datasets usually do not match cases and controls to the degree necessary to rule out confounding effects on ROH analyses and typically do not col-lect the relevant socio-demographic information necessary to control for potential confound-ers. The current study therefore serves as a cautionary tale for analyzing ROHs in existing ascertained GWAS datasets. Such datasets may be perfectly adequate for their designed pur-pose–GWAS–but may be problematic and even misleading for ROH analyses.
Methods
Psychiatric Genomics Consortium GWAS Data
Our study used 37 datasets from the Psychiatric Genomics Consortium’s SCZ2 data–these data included 28,985 schizophrenia cases and 35,017 controls, collected from 37 sites in 13 coun-tries. Data collection and ascertainment details are described elsewhere.[25]
Keller et al.[20] used 17 datasets from the PGC SCZ1[26] data. Several of these original 17 studies recruited additional subjects by the time of our study, necessitating two well-defined, independent datasets: one including all of the individuals analyzed in the original 2012 study (“original” dataset), and one containing only subjects not included in Keller et al.’s 2012 report (the “replication” dataset, comprised of 22 studies and a total sample size of 18,562 cases and 21,268 controls after QC; seeTable 1). Three of the original case-control datasets from the PGC’s SCZ1 added more subjects and/or controls in SCZ2, but only two of these datasets had enough subjects to pass QC and merit inclusion in the current study—thus there is a “top8” dataset (N = 180) in this replication study, comprised of the samples that were added to the “top3” dataset (N = 598) from the original 2012 study, and a “boco” dataset (N = 1,870), which includes the new cases and controls that were added to the original “bon” dataset (N = 1,778). For consistency with the original Keller et al. (2012) study[20], we excluded the three family-based datasets of parent-proband trios and three East Asian datasets.
Quality Control (QC) Procedures–Raw SNP Data
We followed the same QC procedures as Keller et al.[20]. We removed a) one individual from any pair of individuals who were related with^p>0.2, b) individuals with non-European ances-try as determined by principal components analysis; c) samples with SNP missingness>0.02; or d) samples with genome-wide heterozygosities>6 standard deviations above the mean. SNPs were excluded if they a) deviated from Hardy-Weinberg equilibrium at p<1×10⁻⁶; b) had missingness>0.02; or c) had a missingness difference between cases and controls>0.02.
QC Procedures–Imputed SNP Data
Early in the analysis process, we found that only including SNPs with imputation dosage r2> .90 across all datasets, as was done in the original study[20], left us with too few SNPs with which to conduct viable ROH analyses in the replication data. Because having ROHs of similar length and SNP density is important for comparing present results to those from the 2012 study, we decided that having a similar number of SNPs to Keller et al.[20] was more important than following the exact same QC procedures. Thus, to arrive at a similar number of genome-wide SNPs in the new and old datasets, some of the QC measures described below were differ-ent than in the 2012 investigation.
SNPs were imputed using the 1000 Genomes reference panel[42]; imputation procedures are described elsewhere[25]. Imputation dosages were converted to best-guess (highest poste-rior probability) SNP calls because ROH detection algorithms require discrete SNP calls, and extremely stringent QC thresholds were employed to achieve accuracy rates similar to those in genotyped SNPs[43]. We excluded any imputed SNPs that were not included in the HapMap3 [44] reference panel, as done in the 2012 study. Unlike the original QC procedures, we did not require that the dosage r2had to be>.90 in each individual datasets. We excluded any imputed SNPs that had a dosage r2<0.98 or>1.02 in the overall sample (calculated using average dos-age r2weighted by sample size) or that had MAF<0.15 within each sample (vs. .05 in original), leaving 340,084 high-quality imputed SNPs (vs. 398,325 in original).
ROH Calling Procedures
Again, we followed the same ROH calling procedures as in Keller et al[20]. As recommended in a separate investigation[45] by three of the authors of the present study, we chose PLINK software[46] for its computational efficiency and superior detection of autozygous stretches. As in the 2012 study, we pruned for LD using PLINK’s—indep flag, which ensures more uni-form SNP coverage across the genome and reduces false autozygosity calls by removing redun-dant markers. We pruned SNPs for LD using a VIF threshold of 10, which is equivalent to multiple R2>0.90 between the focal SNP and the 50 surrounding SNPs.
physical length threshold (2.3 Mb) that corresponded to the average Mb length for 110 SNPs-in-a row in the original report.
ROH Burden Analysis
After calling ROHs, we summed the total length of all autosomal ROHs for each individual and divided that by the total SNP-mappable distance (2.77x10⁹bases) to calculateFroh.Froh, the proportion of the genome contained in long homozygous regions, was used as the predictor of schizophrenia case-control status in analyses described below. As confounding factors such as population stratification, SNP missingness, call quality, and plate effects can influenceFroh, we included the first 20 principle components (based on a genome relationship matrix calcu-lated from ~30K LD-pruned SNPs), percentage of missing SNP calls in the raw data, and excess heterozygosity in all regression models[20]. We then regressed case-control status onFroh
using a mixed linear effects logistic regression model (available in the lme4 package in R ver-sion 3.1.0), treating dataset as a random factor, to assess the overall effect ofFrohon schizo-phrenia across all sites. Some of the models with random effects did not converge; thus, for consistency, we modeled dataset as a fixed factor for all analyses. The results from mixed linear effects models that converged were very similar to fixed effects models, giving us confidence that the fixed effects results of this analysis and the random effect results from the original Kel-ler et al. (2012) study are commensurate. We also ran logistic regressions in each of the 22 data-sets separately.
Ethics Statement
This research was approved by CU Boulder's Institutional Review Board with regard to proto-col number 13–0266 on 3/29/2016 in accordance with Federal Regulations at 45 CFR 46. Writ-ten patient consent was obtained for each individual study by the study PI, with the exception of the "clm3" and "clo3" datasets, which obtained anonymous samples via a drug monitoring service under ethical approval and in accordance with the UK Human Tissue Act.
Supporting Information
S1 Table. Descriptives for the imputed independent PGC replication data, for ROHs defined as 65 SNPs or greater.
(DOCX)
S2 Table. Results from follow-up analyses to ensure that failure to replicate was not due to inclusion of outlier individuals or datasets, or suppressing covariates in the replication data.
(DOCX)
S1 Fig. Estimated changes in odds of schizophrenia for each 1% increase inFroh(odds
ratios; asterisks) and their 95% confidence intervals (bars) across the independent replica-tion data (colored) and for the total sample (black) from the unimputed SNP data, for ROHs defined as2.3 Mb.Boxes are proportional to the square root of sample sizes (also shown at the bottom). Dataset names are on the x-axis. Only one of the individual estimated odds ratios significantly differs from one (“clm2” dataset), and the overall effect (black) is not significant (β= 0.75,Z= 0.31,p= 0.76).
(TIFF)
S2 Fig. Estimated changes in odds of schizophrenia for each 1% increase inFroh(odds
ratios; asterisks) and their 95% confidence intervals (bars) across the original PGC SCZ1
data (colored) and for the total sample (black) from the unimputed SNP data.Boxes are proportional to the square root of sample sizes (also shown at the bottom). Dataset names are on the x-axis. (While the y-axis is cut off at 3 for clarity, it should be noted that the upper limit of the 95% confidence interval is 4.1 for the “muc” dataset and 5.4 for the “top3” dataset.) Only one of the individual estimated odds ratios significantly differ from one (the “muc” dataset), but the overall effect (black) is significant (Beta = 16.83,p= 0.000357.)
(TIFF)
S3 Fig. Slope estimates (the change in log odds for a 1% increase inFroh; points) and their
95% confidence intervals (bars) ofFrohfrom unimputed PGC SCZ1 original SNP data
pre-dicting schizophrenia for different SNP thresholds of calling ROHs.All SNP homozygosity thresholds above 40 SNPs-in-a-row were significant.
(TIFF)
S4 Fig. Slope estimates (the change in log odds for a 1% increase inFroh; points) and their
95% confidence intervals (bars) ofFrohfrom unimputed PGC SCZ1 original SNP data
pre-dicting schizophrenia for different Mb thresholds of calling ROHs.All ROH Mb thresholds equal to and longer than 1 Mb were significant.
(TIFF)
S5 Fig. Estimated changes in odds of schizophrenia for each 1% increase inFroh(odds
ratios; asterisks) and their 95% confidence intervals (bars) across the independent replica-tion datasets (colored) and for the total sample (black) from the imputed SNP data, for ROHs defined as65 homozygous SNPs in a row.Boxes are proportional to the square root of sample sizes (also shown at the bottom). Dataset names are on the x-axis. Only one of the individual estimated odds ratios significantly differs from one (“clm2” dataset), and the overall effect (black) isnotsignificant (β= 0.11,Z= 0.05,p= 0.96).
(TIFF)
S6 Fig. Slope estimates (the change in log odds for a 1% increase inFroh; points) and their
95% confidence intervals (bars) ofFrohfrom imputed PGC SCZ2 replication SNP data
pre-dicting schizophrenia for different SNP thresholds of calling ROHs.No SNP homozygosity thresholds were significant.
(TIFF)
S7 Fig. Slope estimates (the change in log odds for a 1% increase inFroh; points) and their
95% confidence intervals (bars) ofFrohfrom imputed PGC SCZ2 replication SNP data
pre-dicting schizophrenia for different Mb thresholds of calling ROHs.No ROH Mb thresholds were significant.
(TIFF)
S8 Fig. Estimated changes in odds of schizophrenia for each 1% increase inFroh(odds
p= 0.02.) (TIFF)
S9 Fig. Slope estimates (the change in log odds for a 1% increase inFroh; points) and their
95% confidence intervals (bars) ofFrohfrom imputed PGC SCZ1 original SNP data
pre-dicting schizophrenia for different SNP thresholds of calling ROHs.All SNP length thresh-olds were significant.
(TIFF)
S10 Fig. Slope estimates (the change in log odds for a 1% increase inFroh; points) and their
95% confidence intervals (bars) ofFrohfrom imputed PGC SCZ1 original SNP data
pre-dicting schizophrenia for different Mb thresholds of calling ROHs.All ROH Mb thresholds were significant.
(TIFF)
S11 Fig. Slope estimates (the change in log odds for a 1% increase inFroh; points) and their
95% confidence intervals (bars) ofFrohfrom the combined imputed SNP data predicting
schizophrenia for different SNP thresholds of calling ROHs.SNP thresholds of 120 homozy-gous SNPs-in-a-row and above were significant.
(TIFF)
S12 Fig. Slope estimates (the change in log odds for a 1% increase inFroh; points) and their
95% confidence intervals (bars) ofFrohfrom the combined imputed SNP data predicting
schizophrenia for different Mb thresholds of calling ROHs.All Mb thresholds3 Mb were significant
(TIFF)
Acknowledgments
The following collaborators are in the Schizophrenia Working Group of the Psychiatric Genomics Consortium:Stephan Ripke, Benjamin M. Neale, Aiden Corvin, James T. R. Wal-ters, Kai-How Farh, Peter A. Holmans, Phil Lee, Brendan Bulik-Sullivan, David A. Collier, Hai-liang Huang, Tune H. Pers, Ingrid Agartz, Esben Agerbo, Margot Albus, Madeline Alexander, Farooq Amin, Silviu A. Bacanu, Martin Begemann, Richard A. Belliveau Jr, Judit Bene, Sarah E. Bergen, Elizabeth Bevilacqua, Tim B. Bigdeli, Donald W. Black, Richard Bruggeman, Nancy G. Buccola, Randy L. Buckner, William Byerley, Wiepke Cahn, Guiqing Cai, Dominique Cam-pion, Rita M. Cantor, Vaughan J. Carr, Noa Carrera, Stanley V. Catts, Kimberly D. Chambert, Raymond C. K. Chan, Ronald Y. L. Chen, Eric Y. H. Chen, Wei Cheng, Eric F. C. Cheung, Siow Ann Chong, C. Robert Cloninger, David Cohen, Nadine Cohen, Paul Cormican, Nick Crad-dock, James J. Crowley, David Curtis, Michael Davidson, Kenneth L. Davis, Franziska Degen-hardt, Jurgen Del Favero, Ditte Demontis, Dimitris Dikeos, Timothy Dinan, Srdjan Djurovic, Gary Donohoe, Elodie Drapeau, Jubao Duan, Frank Dudbridge, Naser Durmishi, Peter Eich-hammer, Johan Eriksson, Valentina Escott-Price, Laurent Essioux, Ayman H. Fanous, Marti-lias S. Farrell, Josef Frank, Lude Franke, Robert Freedman, Nelson B. Freimer, Marion Friedl, Joseph I. Friedman, Menachem Fromer, Giulio Genovese, Lyudmila Georgieva, Ina Giegling, Paola Giusti-Rodríguez, Stephanie Godard, Jacqueline I. Goldstein, Vera Golimbet, Srihari Gopal, Jacob Gratten, Lieuwe de Haan, Christian Hammer, Marian L. Hamshere, Mark Han-sen, Thomas HanHan-sen, Vahram Haroutunian, Annette M. Hartmann, Frans A. Henskens, Stefan Herms, Joel N. Hirschhorn, Per Hoffmann, Andrea Hofman, Mads V. Hollegaard, David M. Hougaard, Masashi Ikeda, Inge Joa, Antonio Julià, René S. Kahn, Luba Kalaydjieva, Sena Kara-chanak-Yankova, Juha Karjalainen, David Kavanagh, Matthew C. Keller, James L. Kennedy,
Andrey Khrunin, Yunjung Kim, Janis Klovins, James A. Knowles, Bettina Konte, Vaidutis Kucinskas, Zita Ausrele Kucinskiene, Hana Kuzelova-Ptackova, Anna K. Kähler, Claudine Lau-rent, Jimmy Lee Chee Keong, S. Hong Lee, Sophie E. Legge, Bernard Lerer, Miaoxin Li, Tao Li, Kung-Yee Liang, Jeffrey Lieberman, Svetlana Limborska, Carmel M. Loughland, Jan Lubinski, Jouko Lönnqvist, Milan Macek Jr, Patrik K. E. Magnusson, Brion S. Maher, Wolfgang Maier, Jacques Mallet, Sara Marsal, Manuel Mattheisen, Morten Mattingsdal, Robert W. McCarley, Colm McDonald, Andrew M. McIntosh, Sandra Meier, Carin J. Meijer, Bela Melegh, Ingrid Melle, Raquelle I. Mesholam-Gately, Andres Metspalu, Patricia T. Michie, Lili Milani, Vihra Milanova, Younes Mokrab, Derek W. Morris, Ole Mors, Kieran C. Murphy, Robin M. Murray, Inez Myin-Germeys, Bertram Müller-Myhsok, Mari Nelis, Igor Nenadic, Deborah A. Nertney, Gerald Nestadt, Kristin K. Nicodemus, Liene Nikitina-Zake, Laura Nisenbaum, Annelie Nor-din, Eadbhard O’Callaghan, Colm O’Dushlaine, F. Anthony O’Neill, Sang-Yun Oh, Ann Olincy, Line Olsen, Jim Van Os, Psychosis Endophenotypes International Consortium, Chris-tos Pantelis, George N. Papadimitriou, Sergi Papiol, Elena Parkhomenko, Michele T. Pato, Tiina Paunio, Milica Pejovic-Milovancevic, Diana O. Perkins, Olli Pietiläinen, Jonathan Pimm, Andrew J. Pocklington, John Powell, Alkes Price, Ann E. Pulver, Shaun M. Purcell, Digby Quested, Henrik B. Rasmussen, Abraham Reichenberg, Mark A. Reimers, Alexander L. Rich-ards, Joshua L. Roffman, Panos Roussos, Douglas M. Ruderfer, Veikko Salomaa, Alan R. Sand-ers, Ulrich Schall, Christian R. Schubert, Thomas G. Schulze, Sibylle G. Schwab, Edward M. Scolnick, Rodney J. Scott, Larry J. Seidman, Jianxin Shi, Engilbert Sigurdsson, Teimuraz Sila-gadze, Jeremy M. Silverman, Kang Sim, Petr Slominsky, Jordan W. Smoller, Hon-Cheong So, ChrisC. A. Spencer, Eli A. Stahl, Hreinn Stefansson, Stacy Steinberg, Elisabeth Stogmann, Rich-ard E. Straub, Eric Strengman, Jana Strohmaier, T. Scott Stroup, Mythily Subramaniam, Jaana Suvisaari, Dragan M. Svrakic, Jin P. Szatkiewicz, Erik Söderman, Srinivas Thirumalai, Draga Toncheva, Sarah Tosato, Juha Veijola, John Waddington, Dermot Walsh, Dai Wang, Qiang Wang, Bradley T. Webb, Mark Weiser, Dieter B. Wildenauer, Nigel M. Williams, Stephanie Williams, Stephanie H. Witt, Aaron R. Wolen, Emily H. M. Wong, Brandon K. Wormley, Hua-lin Simon Xi, Clement C. Zai, Xuebin Zheng, Fritz Zimprich, Naomi R. Wray, Kari Stefansson, Peter M. Visscher, Wellcome Trust Case-Control Consortium, Rolf Adolfsson, Ole A.
Andreassen, Douglas H. R. Blackwood, Elvira Bramon, Joseph D. Buxbaum, Anders D. Bør-glum, Sven Cichon, Ariel Darvasi, Enrico Domenici, Hannelore Ehrenreich, Tõnu Esko, Pablo V. Gejman, Michael Gill, Hugh Gurling, Christina M. Hultman, Nakao Iwata, Assen V. Jablen-sky, Erik G. Jönsson, Kenneth S. Kendler, George Kirov, Jo Knight, Todd Lencz, Douglas F. Levinson, Qingqin S. Li, Jianjun Liu, Anil K. Malhotra, Steven A. McCarroll, Andrew McQuil-lin, Jennifer L. Moran, Preben B. Mortensen, Bryan J. Mowry, Markus M. Nöthen, Roel A. Ophoff, Michael J. Owen, Aarno Palotie, Carlos N. Pato, Tracey L. Petryshen, Danielle Post-huma, Marcella Rietschel, Brien P. Riley, Dan Rujescu, Pak C. Sham, Pamela Sklar, David St Clair, Daniel R. Weinberger, Jens R. Wendland, Thomas Werge, Mark J. Daly, Patrick F. Sulli-van & Michael C. O’DonoSulli-van
Author Contributions
Conceptualization:MCK.
Data curation:GB AB SC FD AJF JF GG SHH SH PH WM MM DM BM BMM BN IN MMN
CO MR DMR DR TGS ES JS SHW.
Formal analysis:ECJ MCK DWB.
Methodology:MCK ECJ DWB.
Supervision:MCK.
Writing – original draft:ECJ MCK.
Writing – review & editing:ECJ MCK PFS AA DPH MAS.
References
1. Darwin C. The effects of cross and self fertilisation in the vegetable kingdom. J. Murray; 1876.
2. Walsh B. Evolutionary Quantitative Genetics. Handbook of Statistical Genetics: Third Edition. 2008. p. 533–86.
3. Charlesworth B, Charlesworth D. The genetic basis of inbreeding depression. Genet Res. 1999; 74 (3):329–40. PMID:10689809
4. Abaskuliev AA, Skoblo G V. Inbreeding, endogamy and exogamy among relatives of schizophrenia patients. Genetika. 1975; 11(3):145–8.
5. Bulaeva OA, Pavlova TA, Bulaeva KB. The effect of inbreeding on accumulation of complex diseases in genetic isolates. Genetika. 2009; 45(8):1096–104. PMID:19769299
6. Mansour H, Fathi W, Klei L, Wood J, Chowdari K, Watson A, et al. Consanguinity and increased risk for schizophrenia in Egypt. Schizophr Res. 2010; 120(1–3):108–12. doi:10.1016/j.schres.2010.03.026 PMID:20435442
7. Chaleby K, Tuma TA. Cousin marriages and schizophrenia in Saudi Arabia. Br J Psychiatry. 1987; 150 (APR.: ):547–9. PMID:3664138
8. Gindilis VM, Gaĭnullin RG, Shmaonova LM. Genetico-demographic patterns of the prevalence of
vari-ous forms of endogenvari-ous psychoses. Genetika. 1989; 25(4):734–43. PMID:2759447
9. Rudan I, Rudan D, Campbell H, Carothers A, Wright A, Smolej-Narancic N, et al. Inbreeding and risk of late onset complex disease. J Med Genet. 2003 Dec 1; 40 (12): 925–32. doi:10.1136/jmg.40.12.925 PMID:14684692
10. Bittles AH, Neel J V. The costs of human inbreeding and their implications for variations at the DNA level. Nat Genet. 1994; 8(2):117–21. doi:10.1038/ng1094-117PMID:7842008
11. Keller MC, Visscher PM, Goddard ME. Quantification of inbreeding due to distant ancestors and its detection using dense single nucleotide polymorphism data. Genetics. 2011; 189(1):237–49. doi:10. 1534/genetics.111.130922PMID:21705750
12. Vine AE, McQuillin A, Bass NJ, Pereira A, Kandaswamy R, Robinson M, et al. No evidence for excess runs of homozygosity in bipolar disorder. Psychiatr Genet. 2009; 19(4):165–70. doi:10.1097/YPG. 0b013e32832a4faaPMID:19451863
13. Lencz T, Lambert C, DeRosse P, Burdick KE, Morgan TV, Kane JM, et al. Runs of homozygosity reveal highly penetrant recessive loci in schizophrenia. Proc Natl Acad Sci U S A. 2007; 104 (50):19942–7. doi:10.1073/pnas.0710021104PMID:18077426
14. Ku CS, Naidoo N, Teo SM, Pawitan Y. Regions of homozygosity and their impact on complex diseases and traits. Human Genetics. 2011. p. 1–15.
15. McQuillan R, Leutenegger AL, Abdel-Rahman R, Franklin CS, Pericic M, Barac-Lauc L, et al. Runs of Homozygosity in European Populations. Am J Hum Genet. 2008; 83(3):359–72. doi:10.1016/j.ajhg. 2008.08.007PMID:18760389
16. Kirin M, McQuillan R, Franklin CS, Campbell H, Mckeigue PM, Wilson JF. Genomic runs of homozy-gosity record population history and consanguinity. PLoS One. 2010; 5(11).
17. Enciso-Mora V, Hosking FJ, Houlston RS. Risk of breast and prostate cancer is not associated with increased homozygosity in outbred populations. Eur J Hum Genet. 2010; 18(8):909–14. doi:10.1038/ ejhg.2010.53PMID:20407466
18. Spain SL, Cazier J- B, Houlston R, Carvajal-Carmona L, Tomlinson I. Colorectal cancer risk is not associated with increased levels of homozygosity in a population from the United Kingdom. Cancer Res. 2009; 69(18):7422–9. doi:10.1158/0008-5472.CAN-09-0659PMID:19723657
19. Hosking FJ, Papaemmanuil E, Sheridan E, Kinsey SE, Lightfoot T, Roman E, et al. Genome-wide homozygosity signatures and childhood acute lymphoblastic leukemia risk. Blood. 2010; 115 (22):4472–7. doi:10.1182/blood-2009-09-244483PMID:20231427
20. Keller MC, Simonson MA, Ripke S, Neale BM, Gejman P V., Howrigan DP, et al. Runs of homozygosity implicate autozygosity as a schizophrenia risk factor. PLoS Genet. 2012; 8(4).
21. Thornton A, Lee P. Publication bias in meta-analysis: Its causes and consequences. J Clin Epidemiol. 2000; 53(2):207–16. PMID:10729693
22. Ioannidis JPA., Ioannidis JPA. Why most published research findings are false. PLoS Med. 2005; 2(8): e124. doi:10.1371/journal.pmed.0020124PMID:16060722
23. Duncan LE, Keller MC. A critical review of the first 10 years of candidate gene-by-environment interac-tion research in psychiatry. American Journal of Psychiatry. 2011. p. 1041–9. doi:10.1176/appi.ajp. 2011.11020191PMID:21890791
24. Collaboration OS. Estimating the reproducibility of psychological science. Sci. 2015 Aug 28; 349 (6251).
25. Ripke S, Neale BM, Corvin A, Walters JTR, Farh K-H, Holmans P a., et al. Biological insights from 108 schizophrenia-associated genetic loci. Nature. 2014; 511:421–7. doi:10.1038/nature13595PMID: 25056061
26. Ripke S, Sanders AR, Kendler KS, Levinson DF, Sklar P, Holmans PA, et al. Genome-wide associa-tion study identifies five new schizophrenia loci. Nat Genet. 2011; 43(10):969–76. doi:10.1038/ng.940 PMID:21926974
27. Price AL, Patterson NJ, Plenge RM, Weinblatt ME, Shadick NA, Reich D. Principal components analy-sis corrects for stratification in genome-wide association studies. Nat Genet. 2006; 38(8):904–9. doi: 10.1038/ng1847PMID:16862161
28. Abdellaoui A, Hottenga JJ, Xiao X, Scheet P, Ehli EA, Davies GE, et al. Association between autozyg-osity and major depression: Stratification due to religious assortment. Behav Genet. 2013; 43(6):455– 67. doi:10.1007/s10519-013-9610-1PMID:23978897
29. Abdellaoui A, Hottenga JJ, Willemsen G, Bartels M, Van Beijsterveldt T, Ehli EA, et al. Educational attainment influences levels of homozygosity through migration and assortative mating. PLoS One. 2015; 10(3).
30. Nalls MA, Guerreiro RJ, Simon-Sanchez J, Bras JT, Traynor BJ, Gibbs JR, et al. Extended tracts of homozygosity identify novel candidate genes associated with late-onset Alzheimer’s disease. Neuro-genetics. 2009; 10(3):183–90. doi:10.1007/s10048-009-0182-4PMID:19271249
31. Sims R, Dwyer S, Harold D, Gerrish A, Hollingworth P, Chapman J, et al. No evidence that extended tracts of homozygosity are associated with Alzheimer’s disease. Am J Med Genet Part B Neuropsy-chiatr Genet. 2011; 156(7):764–71.
32. Ghani M, Sato C, Lee JH, Reitz C, Moreno D, Mayeux R, et al. Evidence of recessive Alzheimer dis-ease loci in a Caribbean Hispanic data set: genome-wide survey of runs of homozygosity. JAMA Neu-rol. 2013; 70(10):1261–7. doi:10.1001/jamaneurol.2013.3545PMID:23978990
33. Assie´ G, LaFramboise T, Platzer P, Eng C. Frequency of germline genomic homozygosity associated with cancer cases. Jama. 2008; 299(12):1437–45. doi:10.1001/jama.299.12.1437PMID:18364486
34. Ruderfer DM, Lim ET, Genovese G, Moran JL, Hultman CM, Sullivan PF, et al. No evidence for rare recessive and compound heterozygous disruptive variants in schizophrenia. Eur J Hum Genet. 2014; 23(July):1–3.
35. Heron EA, Cormican P, Donohoe G, O’Neill FA, Kendler KS, Riley BP, et al. No evidence that runs of homozygosity are associated with schizophrenia in an Irish genome-wide association dataset. Schi-zophr Res. 2014; 154(1–3):79–82. doi:10.1016/j.schres.2014.01.038PMID:24560374
36. Power RA, Keller MC, Ripke S, Abdellaoui A, Wray NR, Sullivan PF, et al. A recessive genetic model and runs of homozygosity in major depressive disorder. Am J Med Genet Part B Neuropsychiatr Genet. 2014; 165(2):157–66.
37. Sullivan PF. Spurious Genetic Associations. Biol Psychiatry. 2007; 61(10):1121–6. doi:10.1016/j. biopsych.2006.11.010PMID:17346679
38. Collins AL, Kim Y, Sklar P, O’Donovan MC, Sullivan PF. Hypothesis-driven candidate genes for schizophrenia compared to genome-wide association results. Psychol Med. Cambridge Univ Press; 2012; 42(03):607–16.
39. Button KS, Ioannidis JP a, Mokrysz C, Nosek B a, Flint J, Robinson ESJ, et al. Power failure: why small sample size undermines the reliability of neuroscience. Nat Rev Neurosci. 2013; 14(5):365–76. doi:10.1038/nrn3475PMID:23571845
40. Peng RD. Reproducible research and Biostatistics. Biostatistics. Biometrika Trust; 2009; 10(3):405–8. doi:10.1093/biostatistics/kxp014PMID:19535325
41. Makel MC, Plucker JA, Hegarty B. Replications in psychology research how often do they really occur? Perspect Psychol Sci. Sage Publications; 2012; 7(6):537–42. doi:10.1177/1745691612460688PMID: 26168110
43. Hao K, Chudin E, McElwee J, Schadt EE. Accuracy of genome-wide imputation of untyped markers and impacts on statistical power for association studies. BMC Genet. 2009; 10:27. doi: 10.1186/1471-2156-10-27PMID:19531258
44. Consortium IH. A haplotype map of the human genome. Nature. Nature Publishing Group; 2005; 437 (7063):1299–320. doi:10.1038/nature04226PMID:16255080
45. Howrigan DP, Simonson MA, Keller MC. Detecting autozygosity through runs of homozygosity: A com-parison of three autozygosity detection algorithms. BMC Genomics. 2011. p. 460. doi: 10.1186/1471-2164-12-460PMID:21943305
46. Purcell S, Neale B, Todd-Brown K, Thomas L, Ferreira MAR, Bender D, et al. PLINK: a tool set for whole-genome association and population-based linkage analyses. Am J Hum Genet. 2007; 81 (3):559–75. doi:10.1086/519795PMID:17701901