Danilo de Melo Costa * Francisco Vidal Barbosa ** Abstract
The research performs the evaluation of the main public policies for financing of higher education (HE) in Brazil, Canada and China, between the period from 2003 to 2012. The research is justified by a gap to be explored in relation to the proposal of new public policies in order to subsidize other existing national systems in the globalized world, based on practices already carried out in other countries. Therefore, it was conceptualized the Brazilian, Canadian and Chinese HE funding. When it comes to the methodological procedures, the study was designed as an exploratory, quantitative and multi-case research, with bibliographical and documentary data collection. From then on, 15 public policies were analyzed statistically, based on the compound annual growth rate (CAGR), taking into account the investment made and the number of students attended in the period, in order to verify the efficiency of each policy. The results showed a series of possibilities to promote the advancement of HE worldwide, with examples of policies that can be replicated to other nations, and, therefore, assist them in their development.
Keywords: Evaluation. Efficiency. Public policy. Higher education financing. Comparative study.
* Doutor em Administração de Empresas, Universidade Federal de Minas Gerais – UFMG, com doutorado sanduíche
pela York University - YorkU, Canadá. Coordenador e professor do Programa de Mestrado Profissional em Administração do Centro Universitário Una; E-mail: [email protected].
Introduction
Higher education has always played a dominant role for the success of the nations, however, in recent decades, the importance of this level of education was fostered. New forms of work were introduced in organizations and the information has become the most important strategic asset for businesses, because it became available more quickly and in more places around the world, breaking bonds until then unimaginable.
To perform the management of the strategic asset, the higher education turned out to be regarded as one of the main factors, responsible for giving subsidy to the nations to participate in the phenomenon of globalization and seek a solid and lasting growth.
The importance of the variable "education" has been considered by several countries, which hereby this variable seek for the main policies for the country progress. According to the Inter-American Development Bank (IDB) studies, "Entrepreneurship in Emerging Economies: Creation and development of new Companies in Latin America and East Asia, " the formation of potential entrepreneurs is a long process that begins during the initial stages of school education and extends to the university and the first years of work (BID, 2011), demonstrating the need to create public policies that finance higher education so as to meet the country’s aspirations.
From then on, the research herein aimed at performing the analysis of the main public policies for higher education in Brazil, Canada and China, between the period from 2003 to 2012. The research is justified by a gap to be explored in relation to the proposal of new public policies in order to subsidize other existing national systems in the globalized world, based on practices already carried out in other countries. Therefore, this study uses as a reference the structure of higher education and public policies for the financing of the nations Brazil, Canada and China. In order to do so, it is based on the premise of Lang and Zha (2004, p. 341) who argue that "(…) peer comparisons can provide a basis for rational evaluation of differences and similarities, and identification of strengths, weaknesses, and possible opportunities or niches."
In addition to the continental dimension, a characteristic of the three countries, the reason for this choice is associated with several factors:
a) Canada, in addition to being a developed country and having a solid economy, has one of the most advanced educational systems in the world, and was based on good
Europe and North American practices. The educational plans were established in a comprehensive and permanent manner in the early 19th century. It is important to note that Canadian universities have grown in a sustainable way over the past 200 years, following the principles of a universalizing public education (CATTANI, 2006); b) China has invested and improved the indicators of access and permanence in higher education, which can be exemplified by the growth of 337.5% in the rate of gross enrolment in tertiary education between the years of 1999 and 2006 (UNESCO, 2008), in addition to representing one of Brazil’s pairs, by also being a developing country and BRICS participant.
c) Brazil, which through various public policies proposed by its Federal Government, has reached a recent phenomenon of expansion of higher education in the public, private, technologic and at distance learning initiatives in the country.
Finally, the joint evaluations of the quantitative results of all policies can demonstrate a series of possibilities to promote the advancement of higher education worldwide, from the public policies studied.
Public Funding of Higher Education
The quest for progress, democratization, access to the common good and reduction of inequalities is an issue that has been fought for decades in many countries, challenging public policies and theories developed for this purpose.
With the aim of strengthening relations between public administration and higher education, this section presents the public funding of higher education, the heart of this research, detailing the various actions and initiatives of the Brazilian, Canadian and Chinese State.
Higher Education Financing in Brazil
The Public Funding originating from the Federal Government has been considered largely responsible for the recent phenomenon of expansion of higher education in the country in the public, private, at distance learning and technological initiatives. This funding has been applied in various public policies with the objective of promoting the expansion of the methods mentioned above. For the public initiative, investments are made via the restructuring plan and Expansion of Federal Universities - Reuni; for private initiative,
resources are applied in Fies and Prouni programs; regarding the distance modality education, the program Open University of Brasil (Universidade Aberta do Brasil, or UAB has been responsible for the receipt and use of resources. Finally, for the technological education, resources are applied in the new Federal Institutes of Education, Science and Technology (Ifets).
Reuni was launched on April 24 2007, as an integral action of Education Development Plan (Plano de Desenvolvimento da Educação, or PDE), and aimed to demonstrate the strategic role of the federal universities for country’s economic and social development, its main objectives were the increase of jobs and the reduction of the dropout rates, with focus on face-to-face undergraduation courses (BRASIL, 2007a).
With a duration of 5 years (2007-2012) Reuni had in its planning the distribution of more than 2 billion reais among federal universities, but to receive such resources, universities should improve in many aspects, especially in human resources, physical structure and quality of undergraduate courses offered. To this end, the following targets should be met:
a) minimal increase of 20% in enrolment of graduate studies; b) Proportion of 18 students for each teacher in the classroom;
c) Achieve an average completion rate of 90% in face-to-face undergraduation courses (BRASIL, 2013c).
The worst criticism of this public policy is the concern with the expansion only quantitatively, forgetting the qualitative side which guides the federal universities (LIMA AZEVEDO and CATANI, 2008; LÉDA and MANCEBO, 2009; TONEGUTTI and MARTINEZ, 2007; and PAULA, 2009). On the other hand, other authors argue that the Program represents a first step toward a superior and qualified public education in Brazil (ARMIJOS PALÁCIOS, 2007; and UNE, 2008). Finally, some public managers and academic leaders advocate the necessity of broadening the program, suggesting also the creaton of the Reuni 2 (COSTA; COSTA; BARBOSA, 2013).
Fies was created by the Provisional Measure (MP) No. 1,827, dated from May 27 1999, with the objective of financing the economically disadvantaged undergraduation students in private institutions. On July 12th 2001, the respective MP was converted into Law no. 10.260, and on January 14th, 2001, amended by means of a new law (No. 12,202), which proposed changes, such as allowing the Public Teaching professionals and to physicians of family health programs the abatement of the debit balance, as well as the use of debts with the National
Social Security Institute (INSS) as a credit of Fies by educational institutions, among other provisions (BRASIL, 2010).
From 1999 until then, Fies has already granted the aforementioned funding to more than 560 thousand students, and had already applied around R$6 billion in resources (in contracts and funding renewals). With the enactment of the new law, Fies began to be requested by students throughout the year (then it was only in a specific period), had a drop in interest rates from 9% to 3.4% a year and also began to have as its main financing agent the National Fund for the Development of Education (FNDE).
Some authors, such as Carvalho (2006), criticize the respective public policy, saying that even if the interest rate is lowered, the amount charged is still beyond the needy student’s financial possibilities, who, in their great majority, cannot have a satisfactory return after graduating to start the depreciation of the values financed. On the other hand, other authors believe that Fies is another initiative to increase the Brazilian students’ options who possess the interest and the need to attend higher education (DUARTE, 2004; ANDRÉS, 2008; e CAMPISTA et al., 2009). Anyhow, to study in private initiative, it should be noted a students’ preference for Prouni (which arises in 2005), a choice that is considered normal, since the Prouni’s participating student does not need to reimburse any value to the government in the future (Brazil, 2009).
Prouni was created by MP No.213/2004, converted into Law No 11.096 on January 13th, 2005 and regulated by Decree No. 5.493/2005, and has as its ultimate objective the grant of 100% and 50% scholarships to the undergraduate students in higher education institutions, profitable or not. The students are pre-selected by the National Exam of Secondary Education (ENEM) and the socioeconomic profile, calculated by per capita income of the family, which may not exceed a minimum and half salary for full scholarships and up to three minimum wages for partial scholarships (BRASIL, 2013b).
Like other programs, Prouni has also received some criticism, the main one regarding the quality of higher education delivered to students granted the scholarship, since a good part of the higher education institutions is of dubious quality (CORBUCCI, 2004; CARVALHO; LOPREATO, 2005; CARVALHO, 2006; and CATANI; HEY; GILIOLI, 2006). However, Andrés (2008) argues that, even though the program still needs some adaptations, it is undeniable the important step that it represents for the democratization of higher education in the country, especially when considering that only the Prouni created 112,275 seats in the year
of 2005, almost all of which was offered in the entire federal network on the same date (around 133 thousand seats), increasing access in 84.4% on that occasion.
In the scope of the distance education, with a very strong support of Decree no. 5.622, dated from December 19th 2005 (which regulates this level of education), on June 8th 2006, by means of Decree no.5.800, that UAB was instituted, focused on the development of distance mode higher education and with the mission to interiorize the provision of courses and programs of tertiary education in Brazil. The UAB structure is formed by an integrated system consisting of public universities that aims to offer courses at tertiary level for a percentage of the population that has no conditions to course them face-to-face, or because they do not exist in their region, or due to financial difficulties (BRASIL, 2013c).
UAB critics highlight the fact that of the mass undergraduation, which may represent a loss of quality to the freshmen, mainly because the goal is to prepare basic education teachers. The fear is to feedback a basic education already deficient with professionals who have not received the appropriate higher education (ZUIN, 2006; COSTA, 2007; FREITAS, 2007 and SEGENREICH, 2009). In turn, the program’s advocates claim that it represents a form of democratization and to place the higher education in unimaginable levels, and the average of a tutor to each 25 students meets perfectly the quality expected (DOURADO, 2008; LEMGRUBER, 2008; MAIA, DANTAS and SCHNEIDER, 2009).
In the context of the technological education, it was on April 24 2007 that the Decree no. 6.095 was established, in which the goal was to establish guidelines for integrating the federal education institutions in Federal Institutes of Education, Science and Technology, within a scope named Federal Network of Technological Education (BRASIL, 2007b). With the enactment of the first decree, various federal institutes of technological education were reordered in Ifets, which brought about to create on December 29th 2008 the Law no 11.892, which aimed to create a Federal Network of Professional, Science and Technological Education (BRASIL, 2008). From the reordering, an unprecedented expansion in the segment, starting from 140 schools already in existence, for 354 technical schools at the end of 2010, with an investment of R$1.1 billion reais (BRASIL, 2013d).
Finally, some issues are observed regarding the obligation of the federal institutes offering graduate courses (at least 20%), which, for some authors are negative (MOURA, 2005) and for others it is positive (FRANCO and PIRES, 2009). Another point discussed is in
relation to the reorganization speed, which may have been carried out without much planning on the part of the government (XAVIER NETO, 2008). Anyhow, the initiative can be seen as one more step in the expansion and the ability of a democratized higher education in the country (SILVA JUNIOR, 2009).
Higher Education Financing in Canada
In Canada, the public education completely free is available to the entire population (Canadian), until the end of secondary school (subject to a maximum age limit, which is defined by province or territory). Therefore, the funding intended for the government covers the majority of costs related to primary and secondary education, however, families need to assume the costs relating to the children’s activities in schools, as well as the purchase of supplies, among others. As students reach higher education (identified in the country as "post-secondary") costs rise considerably. Even though the higher education institutions receive a satisfactory financing from the government, the students’ enrolment fees, named tuition fees are a major source of the so-called "private funding". In addition to the tuition fees, students still face other additional costs relating to activities and the academic day-to-day in higher education institutions (STATISTICS CANADA, 2011). For Sguissardi (2003), the cost of the Canadian government with education can be divided, generally into: Higher education (20%), Basic education and High school (62%), Technical Education (10%) and Community Colleges (8%).
Although there are some criticisms in relation to the government percentage intended for Higher Education (ROBERTSON, 2003) Canada is among the most developed countries of the world, especially regarding the Human Development Index (HDI), which was in the 1st place in 1998. The educational model of the country is supported by excellent indicators that conquered this position at the time:
a) 62% of people in the adequate age range enrolled in higher education;
b) 53% of its economically active population with a university diploma (SGUISSARDI, 2003).
In the early 1990s, the student’s assistance became effective as a major concern of the university system, because the increase in the rates above inflation caused the increase in students’ indebtedness. Until the end of such decade, the reduction of federal transfers was added by public policies aiming to expand such assistance.
The first major policy dates back to 1984 and is named Income Contingent Repayment (ICR) being presented in a document entitled Bovey Commission, which reported on the Ontario University System. However, it was only in 1993, that the government of Jean Chrétien, belonging to the Liberal Party of Canada (1993 to 2003) implemented the policy. Knowing that rates would be increased due to the moments experienced by the country, the ICR aimed to ensure access and permanence to all candidates to the third degree if they could not pay the respective fees, by offering them loans (CHAPMAN, 2005).
From the year 1997 on, a new scenario began to emerge in the country due to an unexpected surplus then. Fisher et al. (2006) claim that, instead of restoring the financial transfers to their previous levels, the government decided to invest in other support instruments to the IES, taking as reference a document name Canadian Opportunities Strategy (COS), which was released in 1998. This document had policies that addressed all the priority areas identified in the report Renewing Student Assistance in Canada launched by AUCC in 1997:
a) Enhanced financial assistance and student loans;
b) Enrollments taxes compensation credits for the current students; c) Help in savings for the families of prospective students;
d) Strategic funding to support the activities of researchers and research infrastructure.
The results of the actions were satisfactory, to the extent that 54% of the students received some form of scholarship or loan from the government between the years of 1993 and 2003, with an increase of 20% in the number of recipients (ANDRES and ADAMUTI-TRACHE, 2008). Another action was the tax deductibility in the interest paid on student loans, seeking to equalize the payment obligations of the students with their capacities for depreciation.
When it comes to the aid for the prospective students’ savings, the government created the Canada Education Savings Grant (CESG), which provides an incentive for families to save money for the higher education of their children. The Canadian government complements the saving of the recipients in accordance with the family yearly income:
a) Up to 20% of additional complement, if the net family income is C$42.707,00 or less;
b) up to 10% of additional complement, if the net family income is between C$ 42.707,00 and C$85.414,00 (CANLEARN, 2013).
The supplement may reach the maximum of C$7,200.00 per student. Since its launch, more than 3 million students were awarded with this program, and the resources applied were above 4.75 billion dollars (CANLEARN, 2013).
In addition to the actions mentioned above, the Canadian government also created the Canada Millennium Scholarship Foundation (CMSF), with the aim of helping the country overcome their indicators in the new millennium. In its implementation C$2.5 billion were intended, taking as premises:
a) To Improve access to higher education for all Canadians, especially the economically disadvantaged;
b) To encourage a students’ high performance rate;
c) To build a national alliance of organizations and individuals, following an agenda of actions with a focus on higher education.
In 10 years of existence (1998 to 2009), the foundation has provided more than 500 thousand scholarships, applying a value higher than US$ 1.5 billion. The scholarships were intended to two distinct modalities:
a) Millennium Bursary Program, for the students with greater financial need; b) Millennium Excellence Award Program, providing scholarships based on the students’ performance (CFS, 2013).
After the end of Paul Martin’s government (2003-2006), Jean Chrétien’s successor (both from Canada Liberal Party) and the beginning of Stephen Harper’s Government, from the Canada Conservative Party (2006 up to now), CMSF was discontinued. The foundation was then replaced by the new Canada Student Grants Program (CSGP), aiming at distributing 350 million dollars a year for the higher education students. With the change of the program, the Millennium Excellence Award Program was discontinued (HRSDC, 2013).
Higher Education Financing in China
Over the past decades, in which China has decided to open up to the world, the Chinese leaders have been made aware of the higher education importance, with the aim
of ensuring a more qualified work force state-of-the-art research (HAYHOE and ZHA, 2004). This priority for education, especially higher education, has helped in more qualified human resources formation and generated scientific technological and scientific inventions that are absorbed more easily (MIN, 2008).
According to Professor Zhou Zhong, from the department of Education of Tsinghua University, one of the most renowned universities in China, investment in education is the basis of support for the success of the Chinese economy (NAOE, 2012).
In 1993, the document entitled “Outline for Educational Reform and Development in China” highlighted the various strategies in the country aimed at its development, including a belief in education and science as pivot areas to guide the anticipated modernization and bring the nation closer to the most developed countries in the world. Actions such as decentralizing the administrative structure, increasing the university autonomy, rearranging the universities for the efficiency, effectiveness and expansion, in addition to the diversification of funding sources have been reinforced. All these points were subsequently legislated in the so-called Higher Education Law, which was implemented on January 1, 1999, representing a new institutionalization of the governance and management of higher education in China (ZHA, 2009).
Levin (2010) states that, at the commemoration of the 100th anniversary of Peking University, the Chinese President at that time, Jiang Zemin, revealed publicly the intentions of the country to seek a broad expansion of its system of higher education, fact which actually happened. In 1990, only 3.4% of the age range between 18 and 22 years were allocated in higher education, in 1995, this percentage reached 7.2% and in the year 2000, the surprising rate of 12.5%. It was the beginning of an unprecedented expansion in the world scenario (HAYHOE and ZHA, 2004).
However, the actual process of higher education expansion begins in 1999, with a noticeable increase in the number of enrollments, especially in areas involving science and technology. At this time, the engineering institutions increased the variety of their disciplines, with the goal of increasing the number of students and also to make some of their universities world leaders. In an attempt to vitalize the Education for the century that was about to start, the following goal was defined: increase the gross participation in higher education to 11% in the year 2000. Thereafter, the goal becomes even bolder, seeking to achieve the marker of 15% of young people between 18-22 years until 2010,
since this is a limit recognized internationally for a higher mass education (STATE COUNCIL, 1999). The results were a leap of 47.2% in the number of new enrollments, leaving from 1.08 million new students (1998) to 1.59 million (ZHA, 2011a).
In summary, the action of China to create a system of mass higher education resulted in a rapid enrolment expansion and also a large systemic differentiation of types of institutions: traditional universities, vocational colleges, private institutions, among several others. Despite of the tendency of a qualitative drop in universities, the debate on the quality guided the whole expansion process. According to Hayhoe and Zha (2004), still in 1993, the government announced several national initiatives with the goal of providing financial support for the 100 best universities in China, making them achieve a status of "world class" in the century that would start. This project was named "Project 211".
With the celebration of the 100th anniversary of the best Chinese university, the University of Peking, another project was created in May 1998, called "Project 985", with the aim of supporting even better a special group of 9 universities, namely:
a) polytechnical: Tsinghua, Zhejiang, Xangai Jiao Tong, Xi'an Jiao Tong, USTC, e Harbin Institute of Technology;
b) traditional: Peking, Fudan and Nanjing.
These nine universities compose the Liga C9 (C9 League) in 2009, which is a Chinese reference to Ivy League from the United States. Anyhow, a higher concentration of resources is placed at the Universities of Peking and Tsinghua, with the objective to boost them to the best twenty in the world (HAYHOE and ZHA, 2010; LEVIN, 2010).
Regarding the private higher education institutions, in possession of a good part of the seats, the Chinese government also sought alternatives, by means of funding to give support to the economically disadvantaged students. Actions such as scholarships, grants, student loans and programs of study/work were implemented (MIN, 2008).
At the Ministry of Education of China’s website, it is possible to know some programs that aim at this inclusion, as for example, the Green Passage, which aims to ensure that all students, especially those from poor families, have access and permanence to higher education, avoiding that students leave their courses due to financial difficulties. In this program, the Chinese government, universities and banks created a system of financial support especially for students in need. In addition to Green Passage, these students may
request fees tuition waivers, scholarships, grants, among others. The government has the responsibility to create the programs and the universities and banks have the responsibility to provide the benefits (CERNET, 2013).
Finally, to continue thriving in higher education, the Chinese government created in July 2010 the National Panorama for the Education Reform and Development in the medium and long term (2010-2020), also known as Planning 2020. The focus of this plan is on improvement and quality assurance aspects and the intention to stimulate creativity among students, as well as to include a set of Chinese universities among the universally recognized universities (ZHA, 2011a).
Methodology
In this research, due to the objectives, the study was developed as an exploratory research. According to Gil (1995), the exploratory studies are developed with the intention to offer an overview, type approximate. From then on, such study is characterized as exploratory for seeking to deepen the articulation of public policies for the financing of higher education in three countries essentially different (culturally and economically): Brazil, Canada and China.
The exploratory study is guided by the comparative multi-case analysis, which for Schneider and Schimitt (1998, p.1) helps the researcher to:
[...] discover regularities, perceive shifts and changes, build models and types, identify continuities and discontinuities, similarities and differences, and specifying the more general determinations that govern the social phenomena.
The research was elaborated to support the design provided for a quantitative study. The quantitative approach is confirmed as numeric values were used regarding variables that shape the system of higher education in a country, as well as the public policies for the financing of higher education of the countries studied. Both were submitted to statistical analysis, in order to ensure their representativeness.
For the current study, data were collected through documentary research, which is a source of data collection performed from documents (contemporary or retrospective), but classified as scientifically authentic (MARCONI and LAKATOS, 1990). From then on, data collection documents were used from Brazil, Canada and China, such as:
management reports of the governments on public policies for the higher education financing between 2003 and 2012, decrees of the respective countries, management report of the results of policies in higher education institutions, statistical data concerning public policies and data from the respective Ministries of Education of the countries studied. In addition, to ensure the survey representativeness, other documents were analyzed, namely: statistical tables, opinions, minutes, reports, notes, bills, letters, speeches, interviews, informational documents of educational associations, among others.
Thereafter, data were collected regarding the amount of investment and the number of students served (when available), the following policies:
Chart 1 - Data Collection of public policies analyzed
Country Collection Period Name
Canada
2003-2012 Canada Education Savings Grant (CESG) 2009-2012 Canada Student Grants Program (CSGP) 2003-2012 Canada Student Loans Program (CSLP) 2005-2010 Reaching Higher
2003-2012 Ontario Student Assistance Program (OSAP)
China
2003-2012 Government-subsidized Student Loan Program (GSSLP) 2003-2012 Fee-Charging Policy
2003-2010 Decentralization Plan
2005-2010 Open University of China (OUC) – investment
2003-2010 and 2012 Open University of China (OUC) – number of students 2003-2012 Green Passage - only investment
Brazil
2008-2012 Program to Support the Restructuring Plans and Expansion of Federal Universities (REUNI)
2006-2012 Program University for all (PROUNI)
2003-2012 Higher Education Student Financing Fund (FIES) 2007-2012 Open University of Brazil (UAB)
2003-2012 Federal Institute of Education, Science and Technology (IFET)
Source: The authors (2017).
Note: The "Open university of china" policy is doubled since the investment data and the numbers of students served data were not recovered, considering the same exact period, in spite of the other policies.
The analysis and quantitative treatment were performed together with the numeric findings of the respective public policies, originating from documentary and bibliographic data collection, following the assertion of Barbetta (2008, p. 65), who argues that this procedure allows "[...] to introduce techniques which allow to organize, summarize and present such data, so that it is possible to interpret them in the light of the research objectives.”
After collection and filing the results from 15 public policies selected, the data systematization and standardization was performed, in addition to the conversion of the currency USD (US Dollar). The policies that did not exhibit the annual data evolution (by reason of unavailability of data, dissemination of results in a phased manner or because it was released from 2010) could not be analyzed through historical timeline.
The indicators of public policies of each country, feasible of analysis, were presented throughout the period of its existence in tables and charts. To check the growth or decline in each indicator over the period the compound annual growth rate was used (CAGR). The choice of this equation is given as an alternative to verify the efficacy of the public policies studied, taking as a reference the financial contributions invested (initial and final) as well as the number of students served (initial and final) over the years analyzed.
The compound rate of annual growth is given by:
𝐶𝐴𝐺𝑅 = (𝐹𝑖𝑛𝑎𝑙𝑙 𝑉𝑎𝑙𝑢𝑒 𝐼𝑛𝑖𝑡𝑖𝑎𝑙 𝑉𝑎𝑙𝑢𝑒)
1/𝑛 − 1
The results allowed to understand the behavior and performance of public policies in function of the years, both in the amount of investments intended for their respective policies, regarding the number of students served, in order to better understand the relationship between these two variables. At the end of each section, a comparative table was presented with the results of all policies of a country, to facilitate the data interpretation and dissemination.
The software used for all quantitative analysis was R version 3.0.3.
Results
In this section, it is performed an efficiency analysis regarding the public policies from Canada, China and Brazil. In the opportunity, 5 public policies from Canada (two of which are specific to the province of Ontario), 5 public policies from China and 5 public policies from Brazil. Were studied. Finally, it was presented comparatively the performance of all public policies separated by country, making inferences based on the observed results.
Comparative performance of public policies from Canada and Ontario
In order to understand more deeply the public policies directed to higher education in Canada and the province of Ontario, it was evaluated in the period from 2003 to 2012
the investments made and the amount of students who were served by public policies Canada Education Savings Grant (CESG), Canada Student Grants Program (CSGP), Canada Student Loans Program (CSLP), Reaching Higher and Ontario Student Assistance Program (OSAP), being the last two ones associated with the province of Ontario. CESG and CSGP have already been properly presented in the topic “Higher Education Financing in Canada”.
Canada Student Loans Program (CSLP) helps students from higher education pay for their studies through student loans. The federal government finances the CSLP and the provinces can finance their own programs (ESDC, 2014b).
Reaching Higher, is a plan of actions from Ontario government in order to direct a greater amount of public funding for the system of higher education in its jurisdiction (ONTARIO MINISTRY OF FINANCE, 2005).
Ontario Student Assistance Program (OSAP) is a financial assistance that provides to eligible students from Ontario financial assistance to help pay their tuition, books, fees, and day-to-day and transport costs (MTCU, 2014).
From the selection of programs, the total values in the period and the average rates of annual growth were calculated, both for the investment made and for the amount of students served. The average of investment per student and its average annual growth were also calculated, in order to identify the efficiency of the respective policies in the period.
Table 1 presents the assessment of the investment and students met in public policies analyzed in Canada:
Table 1 - Comparative performance of public policies of Canada and Ontario
OSAP(I) R. Higher(I) CESG CSGP CSLP
Period Quantity of years 10 6 10 4 10
Initial year 2003 2005 2003 2009 2003
Investment ($ dollar)
Total in the period
(million) 5,923.4 6,178 5,758 2,565.1 19,471.7 Average annual growth
rate. 13.6% 51.6% 7.6% 5.4% 5.0%
Students served
Total in the period 350,000 517,406 2,420,000 1,548,746 3,684,311 Average annual growth
rate. 9.8% 2.8% 5.1% 3.9% 3.5%
Investment by student
Average in the period 2,583.32 2,110.16 285.41 1,655.22 5,277.95 Average annual growth
rate. 3.5% 47.4% 2.4% 1.5% 1.5%
(I) Note: Information about Ontario province
However, it is worth pointing out that this is all about policies with different foci, both in composition and in goals. In addition, policies of national scope and policies of provincial scope are contemplated, which suggests a certain caution when comparing the results. Anyhow, it is possible to perform inferences based on data presented in Table 1, such as:
a) OSAP was the policy with the highest annual growth rate in terms of students served in the period, which demonstrates the concern of the province of Ontario with the system of higher education in its jurisdiction;
b) The plan Reaching Higher represented, in fact, a differential on public funding for higher education in the Province of Ontario, once that it had an average annual growth (investment) of 51.6%, something extremely significant if compared with the other policies;
c) The CESG policy demonstrates the strengthening of Canadian culture when it comes to saving for the children’s education, since that it provided for 2 billion and 420 thousand students throughout the period, with an average growth rate of 5.1%, which proves the success of the policy;
d) The results of the CSGP policy demonstrated that the Canadian government has been more concerned to distribute scholarships (nonrefundable) than student loans (refundable), because even getting behind the CSLP policy in absolute numbers, the average annual growth investment and students served the policy CSGP was more representative than the CSLP policy;
e) The average of investment per student from CSLP politics was the highest among all the policies analyzed, demonstrating that the students who seek the student loans finance amounts relatively high, if compared cost/student that the government has in other policies.
Comparative performance of public policies from China
In order to understand more deeply the public policies directed to higher education in China, in the period from 2003 to 2012 the investment (or collection) and the amount of students served by policies, Government-subsidized Student Loan Program (GSSLP) Fee-Charging Policy, Decentralization Plan, Open University of China (ORC) and Green Passage (or Green Pass) were evaluated.
The Government-subsidized Student Loan Program (GSSLP) is loan scheme. In this policy, students applying for loans needed guarantors and assumed a commercial interest rate of 50% (interest subsidized by public funding) and with a repayment term of four years after completion of the course (SHEN and LI, 2003).
Fee-Charging Policy starting from 1997, when all higher education institutions across the country began to charge fees and tuition fees regularly. The policy of cost recovery was then implemented in all higher education institutions in China. With this policy, approximately 25% to 30% of the total expenses of higher education started to be covered by the students themselves.
The Decentralization Plan was an initiative of the Chinese Government that aimed to grant autonomy to the provinces to manage part of higher education. The central government would then administer directly only a small number of key institutions that would search for national development, as well as serve as role models for the rest of the institutions, and the other institutions would be managed by the provincial governments (ZHA, 2011b).
Open University of China (OUC) was named China Central Radio & TV University (CCRTVU), until 2009. The objective of its creation was to take higher education to the most remote areas, particularly rural ones (OUC, 2014).
Green Passage is not necessarily a government public policy. This is an institutional action to prevent economically disadvantaged students from being excluded from the system. From the year 2000, higher education institutions in China established a system of Green Passage to guarantee successful ingress to all new students from poor families. In this process, these students should be allowed to proceed in admission procedures and should receive support regarding the different policies for financial assistance available to them, according to their family situation (MENGKUI, 2009).
From the selection of policies, the total values in the period and the average rates of annual growth were calculated, both for the investment made and for the amount of students served. It was also calculated the average investment per student and his or her average annual growth. For the Green Passage policy, only information on the investment made was obtained.
Table 2 presents the assessment of the investment and students met in public policies (if applicable) analyzed in China:
Table 2 - Comparative performance of public policies of China Green.P ass.(V) (OUC) Fee-Charging GSSLP Decen. Plan(III) (Central Inst.) Decen. Plan(III) (Local Inst.)
Period Quantity of years 10 10(II) 10 10 8 8
Initial year 2003 2003 2003 2003 2003 2003
Investment/ collection
($ dollar)
Total in the
period (billion) 58.39 25.09(I) 323.97 1.36 123.47 237.40 Average growth
rate annual 29.9% 15.5%(I) 15.3% 24.1% 12.9% 17.2% Students served Total in the period - 3,590,000 32,585,961 8,371,500 2,660,335 26,556,398 Average growth rate annual - 12.9% 8.9% 18.3% 2.4% 10.3% Investment by student Average in the
period - 1,852(I) 1,233.84 158.54(IV) 6,240.35 1,403.62 Average growth
rate annual - 4.9%(I) 10.9% 9.1% 14.7% 8.8%
Note: To avoid discrepancies due to the dollar's fluctuation depending on the year, it was used as a reference to US trade dollar quotation, 09 October 2014 for all countries analyzed. Price, $ 1.00 = 6.25
yuan.
(I)Note: Considering only the period between 2005 and 2010
(II) Note: No information about the investment of 2003, 2004, 2011 and 2012, and of students in 2011. (III) Note: No information about the investment and the number of students in the years 2011 and 2012. (IV) Note: The value of average in the period for the investment per student is significantly lower than that of the other policies, since the majority of the resources invested occur via bank (in addition to the return of the values for the government later).
(V) Note: There are disclosed specific records for Green Passage policy. This policy is calculated on the "student grants" guide, of the National Bureau of China's education. As this is a specific data of each institution, no information was received about the total student’s number served in the period. Source: GSSLP, Fee-Charging Policy, Decentralization Plan and Green Passage (NATIONAL BUREAU OF STATISTICS OF CHINA, 2012) and OUC (OUC, 2014).
As in Canada, it is worth pointing out that it is about policies with different foci, both in composition and in goals, for this reason, they should be evaluated with some caution. Anyhow, it is possible to perform inferences based on data presented in Table 2, such as: a) The Fee-Charging Policy was responsible for the collection of more than 323 billion dollars in the period, which demonstrates the importance of this collection to keep the system expansion and even the other policies, such as for example the welfare policies. Additionally, this policy represented an annual growth of around 9% in the number of students in the system;
b) Green Passage showed an average annual growth (investment) slightly higher than the GSSLP, which suggests a concern for the Chinese government to expand the assistance policies;
c) On the other hand, GSSLP presented an annual growth of 18.3% in total students served, what still signals a representative offer of student loans;
d) In the decentralization plan, it is clearly possible to observe the role profiled by central institutions and by local institutions. The indicators corroborate with the local institutions intention, which is to undergraduate the great mass aiming at, especially the labor force inside the country, and the central institutions, which is to provide differentiated education worldwide. Highlight for the average investment per student, which is more than 4 times lower in local institutions than in the central institutions, which proves even more the role performed by each of them;
e) OUC showed a significant average annual growth in the number of students served, highlighting the importance that distance education has played in the system of higher education in China.
Comparative performance: public policies from Brazil
In order to understand more deeply the public policies directed to higher education in Brazil, public policies Reuni, Prouni, Fies, UAB and Ifets were evaluated, which have already been properly presented in the seccion “Higher Education Financing in Brazil” of this research.
From the selection of policies, the total values in the period and the average rates of annual growth were calculated, both for the investment made and for the amount of students served. It was also calculated the average investment per student and his or her average annual growth.
Table 3 displays the investment evaluation and the students met by the public policies analyzed in Brazil:
Table 3 - Comparative performance of public policies of Brazil
REUNI PROUNI FIES UAB IFETS Period Quantity of years 5 7 10 6 10
Initial year 2008 2006 2003 2007 2003 Investment
($ dollar)
Total in the period (million) 3,447.12 1,302.49 3,056.65 958.70 12,644.13 Average Growth Rate
annual 33.6% 18.4% 3.8% 22.8% 23.6% Students
served
Total in the period 243,500 1,667,938 1,033,650 734,952 734,653 Average Growth Rate
annual 12.7% 12.7% 27.5% 109.4% 12.0% Investment
by student
Average in the period 3,551.79 803.22 4,929.77 3,205.51 2,507.29 Average Growth Rate
annual 1.9% 5.1% -18.6% -41.4% 10.3% Note: Quote of October 9, 2014, $ 1.00 = 2.38 reais.
Source: REUNI, investment (BRASIL, 2013a) and students served (BRASIL, 2011); PROUNI, investment (RECEITA FEDERAL, 2014) and students served (BRASIL, 2013b); FIES, investments for years 2003-2007
(BRASIL, 2009) and for years 2008 to 2012 (CAIXA ECONÔMICA FEDERAL, 2014), FIES, students served for years 2003-2010 (BRASIL, 2011) and for years 2011 and 2012 (PAIM,2014); UAB, investments for years 2006 and 2007 (BRASIL, 2013c) and for years 2008 to 2012, primary data from Capes, according to the request in the Electronic System of Citizen Information Services under the protocol number: 23480.012047/2014-70, UAB, students served (BRASIL, 2014).
It is important to emphasize that the public policies analyzed have different foci, both in composition and in goals, for this reason, they should be evaluated with carefully. Nevertheless, it is possible to perform inferences based on data presented in Table 3, such as:
a) Disregarding the Ifets, as they also provide services to technical courses students- Reuni - was the policy that received the greatest amount of investments, surpassing the $3 billion. In addition, this policy had the highest average annual growth rate in relation to the investments received, which shows a real attempt by the government to seek expansion and restructuring of federal universities. This performance led to several researchers defend the creation of the Reuni II (COSTA; COSTA; BARBOSA, 2013);
b) Prouni is the policy that presents the lowest cost per student, something around 800 dollars per year. The cost/student tends to decrease as more students enter the program, because the value of the tax exemption does not suffer significant changes each year and the institutions tend to increase the number of scholarships offered from year to year;
c) Fies, on the other hand, stands out as the public policy that has the highest student cost, however, what is spent by the federal government is repaid in the future by the student who obtained the funding. It's worth noting that the average annual growth rate of the student cost, in addition to significant, is negative (-18.6%), which shows a certain optimization of the government to the extent that it increased the number of students included, but had a small rate of growth in investment, only 3.8%; d) UAB has an average annual growth in the number of students served extremely significant, of 109.4%. This indicator suggests that distance education has gained space on the national scenario, however, it is still the one that faces drop-out problems, a challenge to be resolved by the federal government. It is worth noting that, just as Fies, UAB also presents a significant negative average growth rate in relation to the cost/student, which demonstrates that the basic structure for the operation of the policy is already mounted, and as it has increased the number of
students (due to being in the distance modality there are no barriers of physical infrastructure), the lower the student cost will be;
e) Ifets have the greatest investment among all policies, over 12 billion dollars, and they also provide services to technical courses students. However, it is interesting to note that, from the reorganization of federal technical network for establishment of Ifets, in 2007, the average growth rate in relation to the number of students was significant, reinforcing the important role played by this policy for the technical federal network.
Conclusions
The analysis of public policies for higher education in Canada, China and Brazil demonstrated a direct relationship between the results of the countries and the actions taken by them during the period evaluated.
Canada has proven to be a country of solid and well-defined public policies, which had an impact on the good performance of the country. The public policy CESG presented a proactive way to ensure access to and presence of young people in higher education, incentivizing the families to save resources since the children’s birth. This way, instead of drawing initiatives to remedy problems present in the system, as for example, the exclusion of under-represented groups due to financial unavailability, the government foregoes this situation even before they happen, reducing the need to invest in student’s assistance, among other actions.
Anyhow, the welfare policies CSGP and CSLP were statistically significant in relation to the percentage of students served. The most interesting in relation to these policies is the combination of benefits, so that the least favored student receives a greater share of grants (which do not need to be paid back) and a smaller portion of financial loan (which needs to be paid at the end of the course). The evaluation and calculation of benefits granted by socio-economic status of the student is presented as a fair, democratic and inclusive criterion.
The OSAP assistance policy, specific to Ontario, demonstrated the importance of developing actions at provincial level, which become more sensitive in relation to the needs of the context in which it is inserted. Of all the country policies, this was the one that showed the highest average annual growth in the number of students covered by
them, which sparked a debate around a better attention to the third degree when it becomes to manage it in a regional environment. The same was observed by the policy Reaching Higher, which before a significant financial grant, aimed at restructuring the educational system of the Province of Ontario.
The decentralized management has taught then the following lesson: when a province, state or region is responsible for the distribution of financing and investments, there is a tendency of this transfer to be more generous in order to get the best results for that region, since it will bring direct impacts on the local economy. Thus, a healthy competition between the jurisdictions that will work toward improving their indicators is created, which, in the end, will be beneficial for the whole country.
Regarding China, both the public policies and the impact of some structural adjustments in the system were analyzed. The financial support intended for the Chinese policies have proven that higher education, for decades forgotten, began to receive the necessary attention. The numbers are so significant that an assistance policy as GSSLP met more students over the period than the entire system of higher education currently does.
Due to its continental dimension and the difficulty of being present throughout the territory of the country, China has also started to invest increasingly in distance modality education, by means of OUC. In the period analyzed, the investments had an average annual growth of approximately 15.5% and an average increase in the annual number of students of 12.9%. Actions like these demonstrate the need to expand the system of Open University of Brazil (UAB), due to the fact that the country shares the same needs as China.
As a proactive action, it is also possible to highlight the Green Passage policy, which combines a series of welfare benefits and discloses to the students at the institutional level, those benefits to which they are entitled, in order to provide for the economically disadvantaged students. The determination of the government so that the institutions open the process of Green Passage at the moment in which students receive the information they were approved, helps the institutions and the government to anticipate the problem of students enrolling in higher education and subsequently discover that they cannot stay, generating a disadvantageous drop out tax in the system.
In addition to the policies that receive public funding from governments, analyzed issues of structural order were also analyzed, especially those that involve diversification to inflow of resources that are intended for higher education. It is possible to realize that
China has sought efficient options to ensure a larger amount of resources to the system, divided into two major actions: collection of academic fees (tuition fees) and the decentralization of its system.
Even though it is a relatively recent action (1997), collection of tuition fees, was a milestone in Chinese higher education, something noticed by the analysis of the quantitative data. In 10 years of evaluation, China raised a sum exceeding 323 billion dollars, an amount sufficient to promote a complete restructuring in any one of the three systems studied. This injection of additional resources was preponderant so that the Chinese higher education system expanded and served more than 30 million students, becoming the largest system in the world in quantitative terms.
Another structure that brought significant results, especially in the quantitative increase in the number of enrollments, was the decentralization of the management of the system, granting more autonomy to the provincial governments. Unlike the Canadian decentralization, which is complete in the case of China, the Central Government still sets the strategies and rules to be followed, however, each province can choose the best way to comply with them. These governments also receive autonomy to apply the specific resources for higher education, which collect at the local level. The biggest differential of this strategy was that, as in Canada, the provinces began to compete among themselves, improving more each time its educational system to attract more students (which contribute to the tuition fees and foster the system). This "competition" has been responsible for ensuring a continuous improvement of the system, as well as inevitably increase the number of seats and consequently the access.
Finally, the Brazilian analysis was based on the 5 policies that cover the 4 dimensions of higher education in Brazil: face-to-face public education, distance learning public education, technological public education and private education (face-to-face and distance learning modalities).
For distance learning public education, the UAB public policies results were presented. The data quantitative analysis showed that this is an education modality which has broken bonds in the last years, through the surprising average growth rate of the students of 109.4%. However, this value can be confronted with the high rates of drop-outs present in the system, since the culture of distance education modality is not yet
established in Brazil. Mitigating these problems will be the country’s biggest challenge in this kind of education.
For the technological higher education, by means of Ifets, it was evidenced that the government has given considerable attention upon the volume of resources applied during the period analyzed. The average annual growth in investments was 23.6%, something relatively high if compared with other public policies. Aware of the importance of this level of education, since it aims to offer skilled work force with a focus on the needs of the country, it is still noticed some uncertainty in relation to the role played by these institutions in that system, which is sometimes confused with the federal universities, and in other opportunities with the technical schools. A better definition of its identity is the challenge to be overcome by the Brazilian government in the coming years.
For private higher education (face-to-face and distance), the Prouni and Fies policies were analyzed. Both policies proved to be efficient during the period analyzed, with emphasis for Prouni, which demonstrated to have an extra cost per student in the average value of 803.22 dollars per year, significantly low if compared with other policies. Interestingly, Fies was the policy that presented the greatest cost value per student, 4,929.77 dollars, but two points should be considered: (i) This value has presented a decrease in annual average of -18.6%; and (ii) the resources applied by the state are then received back.
Still regarding Fies and Prouni, it is important to highlight that all policies available, are those that promote assistance to a greater number of students. Together they provide service to more than 2 million and 700 thousand students, which equates to almost 40% of the total number of students present in the system. The greatest challenges in this case are associated to the quality of education that is provided, since it does not have such an effective control from the private network.
Regarding the face-to-face public higher education, especially the federal universities, the policy studied was Reuni, which operated between the years of 2008 to 2012. Reuni’s results certified it as an efficient public policy and that brought real results for the federal network. In addition to having promoted a significant increase in access, with an average growth rate of the number of students of 12.7%, Reuni was also responsible for bringing the effectiveness to the system, correcting deviations in the number of students per teacher, extending the offer of evening courses and interiorizing universities and campuses. However, the worst problem observed was the non-continuity
of the policy, something that is essential, particularly in order to achieve the goal of extending the offer of the public sector from 25% to 40%, which suggests a long way to go.
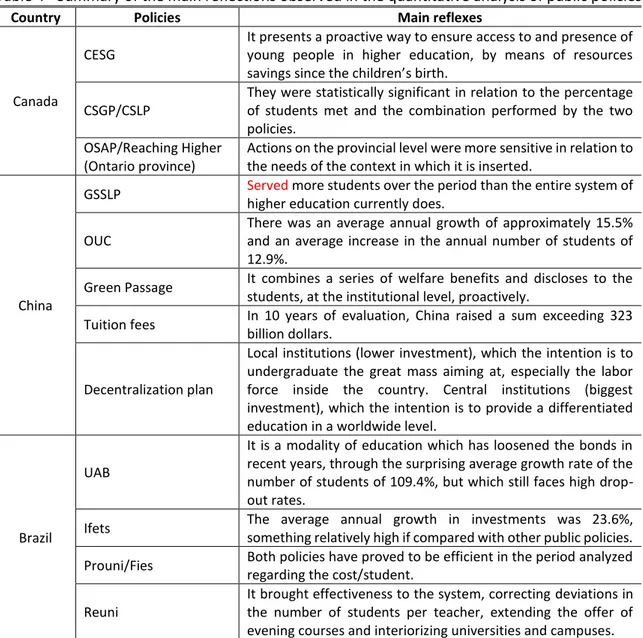
Table 4 - Summary of the main reflections observed in the quantitative analysis of public policies
Country Policies Main reflexes
Canada
CESG
It presents a proactive way to ensure access to and presence of young people in higher education, by means of resources savings since the children’s birth.
CSGP/CSLP
They were statistically significant in relation to the percentage of students met and the combination performed by the two policies.
OSAP/Reaching Higher (Ontario province)
Actions on the provincial level were more sensitive in relation to the needs of the context in which it is inserted.
China
GSSLP Served more students over the period than the entire system of higher education currently does.
OUC
There was an average annual growth of approximately 15.5% and an average increase in the annual number of students of 12.9%.
Green Passage It combines a series of welfare benefits and discloses to the students, at the institutional level, proactively.
Tuition fees In 10 years of evaluation, China raised a sum exceeding 323 billion dollars.
Decentralization plan
Local institutions (lower investment), which the intention is to undergraduate the great mass aiming at, especially the labor force inside the country. Central institutions (biggest investment), which the intention is to provide a differentiated education in a worldwide level.
Brazil
UAB
It is a modality of education which has loosened the bonds in recent years, through the surprising average growth rate of the number of students of 109.4%, but which still faces high drop-out rates.
Ifets The average annual growth in investments was 23.6%, something relatively high if compared with other public policies. Prouni/Fies Both policies have proved to be efficient in the period analyzed
regarding the cost/student. Reuni
It brought effectiveness to the system, correcting deviations in the number of students per teacher, extending the offer of evening courses and interiorizing universities and campuses. Source: The authors (2017).
Note: Some policies were analyzed together, since the results are similar
Finally, the joint evaluations of the results of all policies showed a series of possibilities to promote the advancement of higher education worldwide, with examples of policies that can be replicated to other nations, and, therefore, assist them in their development.
Referências
ANDRÉS, A. O Programa universidade para todos (ProUni). Consultoria Legislativa Câmara dos Deputados. Brasília, DF, jan. 2008.
ANDRES, L.; ADAMUTI-TRACHE, M. University attainment, student loans and adult life course activities. In: FINNIE, R. et al. (Org.). Who goes? who stays? what matters: accessing and persisting in post-secondary education. Queen’s School of Policy Studies. Kingston, 2008. p. 239-277.
ARMIJO, L. E. The BRICs Countries (Brazil, Russia, India, and China) as Analytical Category: Mirage or Insight?. Asian Perspective, Portland, v. 31 n. 4, p. 7-42, 2007.
BARBETTA, P. A. Estatística aplicada às ciências sociais. 7. ed. Rev. Florianópolis, SC: Editora da UFSC, 2008.
BID. Inter-American Development Bank. Empreendedorismo em economias emergentes: criação e desenvolvimento de novas Empresas na América Latina e no Leste Asiático. Nova York, 2011.
BRASIL. Decreto nº 6.095 de 24 de abril de 2007. Estabelece diretrizes para o processo de integração de instituições federais de educação tecnológica, para fins de constituição dos Institutos Federais de Educação, Ciência e Tecnologia - IFET, no âmbito da Rede Federal de Educação Tecnológica. [Diário Oficial da União]. Brasília, DF, 25 abr. 2007a.
BRASIL. Decreto nº 6.096, de 24 de abril de 2007. Institui o Programa de Apoio a Planos de Reestruturação e Expansão das Universidades Federais: REUNI. [Diário Oficial da União]. Brasília, DF, 25 abr. 2007b.
BRASIL. Lei n° 12.202, de 14 de Janeiro de 2010. Altera a Lei nº 10.260, de 12 de Julho de 2001, que dispõe sobre o Fundo de Financiamento ao Estudante do Ensino Superior - FIES e da outras providencias. [Diário Oficial da União]. Brasília, DF, 14 jan. 2010.
BRASIL. Lei nº 11.892, de 29 de dezembro de 2008. Institui a Rede Federal de Educação Profissional, Científica e Tecnológica, cria os Institutos Federais de Educação, Ciência e Tecnologia, e dá outras providências. [Diário Oficial da União]. Brasília, DF, 30 dez. 2008.
BRASIL. Ministerio da Educação. PROUNI: Programa Universidade para Todos. Brasília, DF, 2013a. Disponível em: <http://siteprouni.mec.gov.br>. Acesso em: 20 fev. 2013.
BRASIL. Ministerio da Educação. Rede Federal de Educação Profissional e Tecnológica. Brasília, DF, 2013b. Disponível em: <http://redefederal.mec.gov.br>. Acesso em: 20 fev. 2013.
BRASIL. Ministerio da Educação. REUNI. Reestruturação e expansão das Universidades Federais Brasileiras. Brasília, DF, 2013c. Disponível em: <http://reuni.mec.gov.br>. Acesso em: 20 fev. 2013.
BRASIL. Ministério da Educação. Sinopse das ações do Ministério da Educação. Brasília, DF: MEC, 2011.
BRASIL. Ministerio da Educação. Universidade aberta do Brasil. Brasília, DF, 2013d. Disponível em: <http://uab.capes.gov.br>. Acesso em: 20 fev. 2013.
BRASIL. Relatório educação para todos no Brasil 2000-2015. Brasília, DF: Ministério da Educação, 2014.
BRASIL. Tribunal de Contas da União. Auditoria operacional no Programa Universidade para Todos (ProUni) e no Fundo de Financiamento ao Estudante do Ensino Superior (FIES). Relator Ministro José Jorge. Brasília, DF: Ministério da Educação, 2009.
CAIXA ECONÔMICA FEDERAL. Repasses ao Fundo de Investimento do Estudante Superior – FIES. Brasília, DF, 2014. Disponível em:
<http://www1.caixa.gov.br/loterias/repasses_sociais/valores_repassados.asp>. Acesso em: 28 set. 2014.
CAMPISTA, T. M. N. et al. Panorama do campo da educação superior em enfermagem no estado do Espírito Santo. Revista de Enfermagem, Rio de Janeiro, v. 13, n. 2, p. 256-264. 2009.
CANLEARN. Education savings for your child. Canada: Education Savings Grant, 2013. Disponível em <http://www.canlearn.ca/eng/saving/cesg/index.shtml>. Acesso em: 29 mar. 2013.
CARVALHO, C. H. A. O PROUNI no governo Lula e o jogo político em torno do acesso ao ensino superior. Educ. Soc. Campinas, v. 27, n. 96, out. 2006.
CARVALHO, C. H. A.; LOPREATO, F. L. C. Finanças públicas, renúncia fiscal e o PROUNI no governo Lula. Impulso, Piracicaba, v. 16, n. 40, p. 93-104, maio/ago. 2005.
CATANI, A. M.; HEY, A.P.; GILIOLI, R. PROUNI: democratização do acesso às Instituições de Ensino Superior?. Educar em Revista. Curitiba, n. 28, p. 125 - 140, jul./dez. 2006.
CATTANI, D. A. Desigualdades socioeconômicas Brasil/Canadá: um estudo a partir dos extremos. Revista Interfaces Brasil-Canadá, Porto Alegre, n. 6, 2006.
CFS. Canadian Federation of Students: millennium scholarship foundation background. Canadá, 2013. Disponível em:
<http://www.cfs-fcee.ca/html/english/campaigns/millennium.php>. Acesso em: 29 mar. 2013.
CHAPMAN, B. Income contingent loans for higher education: international reforms. Australian National University Centre for Economic Policy Research, Canberra, 2005. CORBUCCI, P. R. Financiamento e democratização do acesso à educação superior no Brasil: da deserção do Estado ao projeto da reforma. Educação & Sociedade, [S.l.], n. 88. v. 25. Campinas, SP: CEDES, 2004.
COSTA, C. J. Modelos de educação superior a distância e implementação da
Universidade Aberta do Brasil. Revista Brasileira de Informática na Educação, [S.l.], v. 15, p. 9-16, 2007.
COSTA, D. M.; COSTA, A. M.; BARBOSA, F. V. Financiamento público e expansão da Educação Superior Federal no Brasil: o Reuni e as perspectivas para o Reuni 2. Revista Gestão Universitária na América Latina - GUAL, Florianópolis, v. 6, p. 106-127, 2013. DOURADO, L. F. Políticas e gestão da educação superior à distância: novos marcos regulatórios?. Educação e Sociedade, Campinas, v. 29, p. 891-917, 2008.
DUARTE, D. Crédito educativo. Revista do Centro de Estudos Judiciários, Brasília, n. 26, p. 5-9. jul./set. 2004.
ESDC. Employment and social development Canada. Canada education savings program: annual statistical review 2013. Ottawa, Canadá, 2014a.
ESDC. Employment and social development Canada. Canada student loans program: annual report 2012-2013. Ottawa, Canadá, 2014b.
FISHER, D. et al. Federal policy and postsecondary education in Canada. BC: Centre for Policy Studies in Higher Education and Training. Vancouver, 2006.
FRANCO, L. R.; PIRES, L. L. A. A formação de professores em CEFETs: analisando a licenciatura em física. SIMPÓSIO NACIONAL DE ENSINO DE FÍSICA, 18., 2009, Espírito Santo. Anais... Espírito Santo: SBF, 2009.
FREITAS, H. C. L. A (nova) política de formação de professores: a prioridade postergada. Revisa Educação & Sociedade. CEDES, [S.l.], v. 28, n. 100 esp., p. 1203-1230, out. 2007. GIL. A. C. Métodos e técnicas de pesquisa social. São Paulo: Atlas, 1995.
HAYHOE, R.; ZHA, Q. Becoming world class: chinese universities facing globalization and internationalization. Harvard China Review, Cambridge, v. 5, n. 1, p. 87-92. 2004.
HAYHOE, R; ZHA, Q. The polytechnic universities in China’s transformation. International Higher Education, Boston, n. 60, p. 11-13. 2010.
HRSDC. Human Resources and Skills Development Canada - Canada student grants program. Canadá, 2013. Disponível em:
<http://www.hrsdc.gc.ca/eng/learning/canada_student_loan/cgsp.shtml>. Acesso em: 29 mar. 2013.
LANG, D; ZHA, Q. Comparing university: a case study between Canada and China. Higher Education Policy, Paris, v. 17, n. 4, p. 339-381, 2004.
LÉDA, D. B.; MANCEBO, D.: REUNI: heteronomia e precarização da universidade e do trabalho docente. Revista Educação e Realidade, Porto Alegre, n. 34, p. 49-64, jan./abr. 2009.
LEMGRUBER, M. S. Educação à distância: para além dos caixas eletrônicos. Revista Sinpro-Rio, Rio de Janeiro, v. 2, p. 42-49, 2008.