Repositório ISCTE-IUL
Deposited in Repositório ISCTE-IUL:
2018-04-23
Deposited version:
Post-print
Peer-review status of attached file:
Peer-reviewed
Citation for published item:
Moreira, S., Simões, N. & Crespo, N. (2017). A contribution to a multidimensional analysis of trade competition. The World Economy. 40 (10), 2301-2326
Further information on publisher's website:
10.1111/twec.12492
Publisher's copyright statement:
This is the peer reviewed version of the following article: Moreira, S., Simões, N. & Crespo, N. (2017). A contribution to a multidimensional analysis of trade competition. The World Economy. 40 (10), 2301-2326, which has been published in final form at https://dx.doi.org/10.1111/twec.12492. This article may be used for non-commercial purposes in accordance with the Publisher's Terms and Conditions for self-archiving.
Use policy
Creative Commons CC BY 4.0
The full-text may be used and/or reproduced, and given to third parties in any format or medium, without prior permission or charge, for personal research or study, educational, or not-for-profit purposes provided that:
• a full bibliographic reference is made to the original source • a link is made to the metadata record in the Repository • the full-text is not changed in any way
The full-text must not be sold in any format or medium without the formal permission of the copyright holders. Serviços de Informação e Documentação, Instituto Universitário de Lisboa (ISCTE-IUL)
Av. das Forças Armadas, Edifício II, 1649-026 Lisboa Portugal Phone: +(351) 217 903 024 | e-mail: [email protected]
1
A contribution to a multidimensional analysis of trade
competition
Sandrina Moreira(a), Nádia Simões(b),* and Nuno Crespo(b)
(a) Instituto Politécnico de Setúbal (ESCE – IPS), Department of Economics and Management, Setúbal, Portugal and BRU - IUL (Business Research Unit), Lisboa, Portugal
(b) Instituto Universitário de Lisboa (ISCTE - IUL), ISCTE Business School Economics Department and BRU - IUL (Business Research Unit), Lisboa, Portugal
* Author for correspondence. Email: [email protected]
Abstract: International trade grew substantially throughout the last decades and
international relations became more important for the economic performance of the countries. Simultaneously new poles emerged in the international arena leading to growing competition for higher market shares. Therefore, trade competition is a critical dimension of analysis for applied international trade studies. We propose a conceptual framework for measuring this phenomenon by combining some critical previous contributions to build a multidimensional and more comprehensive concept, which defines trade competition as a function of the degree of both structural similarity and total exports overlap. Moreover, structural similarity should take into account three elements: sectoral shares similarity, inter-sectoral similarity (evaluating how different the distinct sectors are), and intra-sectoral similarity (proximity in terms of quality ranges exported). Several measures are proposed to empirically capture the concept suggested. Finally, we present an example including the exports of six European economies (Germany, France, the United Kingdom, Greece, Hungary, and Sweden) to 124 destination markets (in 2007, 2011, 2015) in order to illustrate the application of the concept and measures suggested.
Key words: trade competition, index, structural similarity, total exports overlap.
JEL Codes: F10, F14.
Acknowledgements: This work was supported by the Fundação para a Ciência e a
Tecnologia under Grant UID/GES/00315/2013. We are also grateful to one anonymous referee for his/her very useful comments. The usual disclaimer applies.
2 1. INTRODUCTION
Economic globalization and the emergence of new poles in the world economy are among the most critical trends of (at least) the last three decades (Riad et al., 2012; Head and Mayer, 2013). As described by Kaplinsky and Messner (2008, p. 197), “the global economy is undergoing a profound and momentous shift”. This geographical reconfiguration of international economic relations was driven by technological progress and the reduction of trade costs generated by the evolution in the transport sector and the liberalization trend that characterized the world economy in the second half of the twentieth century (Carter and Li, 2004). As a consequence of these transformations, international trade grew dramatically during the last decades and we are faced with a new scenario characterized by much more open and interdependent economies (Berthelon and Freund, 2008). Given the magnitude of actual trade flows and their importance for the overall economic performance of the countries (and the firms), the phenomenon of trade competition requires special attention and needs to be seen as a priority in the agenda of international trade research.
More specifically, particular emphasis should be directed to the development of new ways to evaluate the phenomenon, providing not only a detailed view of the actual situation but also some insights on critical dynamic elements, capturing the main trends and highlighting the challenges that they raise. Some efforts are already in place aiming the analysis of the threat imposed by the emergence of new important players in the international trade arena. A major example is of course the case of China (Kaplinsky and Messner, 2008), with several studies analyzing the impact of the Chinese trade growth for other countries in several destination markets (e.g., Lall and Albaladejo, 2004; Lall et al., 2005; Blázquez-Lidoy et al., 2006; Greenaway et al., 2008; Jenkins et al., 2008; Schott, 2008; Jenkins, 2012; Giovannetti et al., 2013).
3 The most common approach to this subject evaluates the similarity in sectoral shares (structural similarity) as a proxy of trade competition (Wu and Chen, 2004; Blázquez-Lidoy et al., 2006; Langhammer and Schweickert, 2006; Schott, 2008; Duboz and Le Gallo, 2011; Vandenbussche et al., 2013). The Krugman Specialization Index (Krugman, 1991) and the Finger-Kreinin index (Finger and Kreinin, 1979) are commonly used as baseline indicators (Palan, 2010). Retaining this spirit but using an even simpler approach, other studies calculate correlation coefficients between the sectoral shares, the ranking of these sectoral shares, or the ranking of revealed comparative advantage measures (Lall and Albaladejo, 2004; Shafaeddin, 2004; De Benedictis and Tajoli, 2007).
Another dimension considered in the empirical literature is the level of intra-sectoral similarity, i.e., the proximity in terms of quality ranges exported. In fact, the growing pattern of vertical specialization (Fontagné et al., 2008; Kaitila, 2010; Vandenbussche et al., 2013) leads some researchers to consider measures that capture the similarity in terms of sectoral shares and quality ranges simultaneously (Antimiani and Henke, 2007).
Crespo and Simões (2012) propose an even larger measure of structural similarity, which besides sectoral shares similarity and intra-sectoral similarity also incorporates inter-sectoral similarity (evaluating how different the distinct sectors are). The basic argument is that sectors have distinct levels of dissimilarity among them in what concerns their production requirements. Let us illustrate this idea with a simple example. To that end, we consider three countries – countries 1, 2, and 3 – totally specialized in one sector: country 1 in potatoes, country 2 in tomatoes, and country 3 in computers. It is reasonable to assume that potatoes and tomatoes have more similar production requirements than tomatoes and computers. Therefore, the index of
4 structural similarity should be able to reflect this situation, making clear that the level of structural similarity is higher in the first case. However, the Krugman Specialization Index is not able to capture this aspect as it indicates maximum dissimilarity whenever the countries under comparison export different sectors, as occurs in the example above. To overcome this problem, Crespo and Simões (2012) propose the consideration of an average of the Krugman index calculated at different levels of sectoral disaggregation in order to evaluate not only the level of actual competition (traditionally evaluated through the Krugman index) but also the potential one.
Finally, in another important milestone in this literature, Jenkins (2008) puts the emphasis on the concept of competitive threat and highlights that a measure that attends only to structural similarity and ignores the level of overlap between total exports of the two countries under comparison is strongly affected in its capacity to evaluate the critical aspects that are at the heart of the trade competition reality at the world level. The empirical studies produced in this area do not benefit however from a global conceptual framework. Instead these studies use partial measures that capture some important dimension of trade competition between two countries but lack the consideration of other important elements. They are therefore, at best, partial measures, making clear the need for new contributions in this research area, namely with the objective of providing innovative insights regarding the measurement of trade competition between two countries. The development of such framework is the main goal of this paper.
The approach developed in this study takes the Krugman Specialization Index as starting point and incorporates the two main contributions of the study by Crespo and Simões (2012), thereby leading to a measure of structural similarity that accounts for the three critical dimensions of this phenomenon simultaneously: sectoral shares
5 similarity, inter-sectoral similarity, and intra-sectoral similarity. By doing so, we are able to obtain a richer measure of structural similarity. However, this is not enough to capture the real concept of trade competition. For that we need to add to our measure of structural similarity a way to incorporate the overlap between total exports of the two countries (i.e., the ratio between the value of exports from the smaller country and the value of exports from the larger country). Inspired by Jenkins (2008), we propose an adjustment to our previous indicator, obtaining distinct indexes for each of the two countries under analysis.
In addition, while the common approach evaluates trade competition between two countries in a specific destination market, we complement our methodological proposal by considering not only a set of measures that correspond to this perspective but also indicators that aim to quantify the overall level of competition between two countries, i.e., in a group of countries to which they export.
With the framework developed in the present study, we aim to contribute to applied international trade literature by providing important tools to answer some critical questions such as, for example: (i) what are the main competitors of each country in the different destination markets?; (ii) what are the sources of the competition dynamics identified?; (iii) what has been the evolution of trade competition between two specific countries along the last years? A correct and rigorous answer to these questions could provide useful guidance for economic policy actions that may impact the specialization patterns of the exports, both in sectoral and geographical terms.
The remainder of the paper is structured as follows. Section 2 presents our measure of structural similarity and introduces the overlap between total exports in the analysis of trade competition. Section 3 extends the previous approach by considering the level of trade competition between two countries in a group of destination markets. Section 4
6 illustrates our methodological proposal through an empirical example considering export data for Germany, France, the United Kingdom, Greece, Hungary, and Sweden, along the period 2007-2015. Section 5 presents some final remarks.
2. METHODOLOGY
In this section we present the critical aspects of the methodology that we propose to capture a broad concept of trade competition. In subsection 2a, we discuss the baseline index which only considers sectoral shares. Next, we extend the analysis through the inclusion of inter-sectoral (subsection 2b) and intra-sectoral similarity (subsection 2c). In subsection 2d we take the contributions from the previous subsections as support in order to present an overall index of structural similarity. Finally, in subsection 2e we discuss a measure of trade competition that includes not only the three dimensions of structural similarity but also the level of trade overlap.
a. Sectoral Shares Similarity
The Krugman Specialization Index (KSI) is one of the most widely used indexes of structural similarity (Palan, 2010) and is therefore taken as the starting point for this study. The KSI compares the share of each sector in two export structures. i and h are the exporting countries and m (m = 1, 2, . . . , 𝑀) represents the destination market. Finally, j is a sectoral index (𝑗 = 1, 2, . . . , 𝐽). The index is expressed as follows:
𝐾𝑖ℎ𝑚 = ∑𝐽𝑗=1|𝑣𝑗𝑖𝑚 − 𝑣𝑗ℎ𝑚|. (1)
The weights of sector j in the export structure of i and h to m are expressed, respectively, as 𝑣𝑗𝑖𝑚 and 𝑣𝑗ℎ𝑚. Additionally, 𝑣𝑗𝑖𝑚 = 𝑥𝑗𝑖𝑚⁄𝑥𝑖𝑚, where 𝑥𝑗𝑖𝑚 are the
7 exports of sector j from i to m and 𝑥𝑖𝑚 are the total exports from 𝑖 to 𝑚. The same definitions apply to 𝑣𝑗ℎ𝑚. 𝐾𝑖ℎ𝑚 ranges between 0 (perfect similarity between the two export structures) and 2 (maximum dissimilarity).
This index has two counter-intuitive characteristics. First, the admissible range does not provide an immediate quantitative message regarding the level of structural similarity. Second, despite being a measure of structural similarity, it increases with structural dissimilarity. In order to overcome these two problems, we consider as our baseline index a modified version of the KSI, expressed as:
𝐸𝑖ℎ𝑚 = 1 − 𝛽 ∑𝐽𝑗=1|𝑣𝑗𝑖𝑚− 𝑣𝑗ℎ𝑚|. (2)
The most common value for is 0.5. We assume this value for throughout. Therefore, 𝐸𝑖ℎ𝑚 ranges between 0 and 1. In this perspective, the level of structural similarity is maximum (i.e., 𝐸𝑖ℎ𝑚 = 1) when the weights of each sector are equal in the exports of countries i and h to market m.
b. Inter-sectoral Similarity
The traditional approach to measure structural similarity (i.e., KSI or its adaptations) does not consider the degree of dissimilarity between sectors. With the aim of adjusting 𝐸𝑖ℎ𝑚 in order to capture this dimension, we propose a generalized version of the procedure suggested by Crespo and Simões (2012). To that end, making use of the different levels of sectoral disaggregation that comprise a specific statistical nomenclature, we calculate the weighted average of the structural similarity indexes
8 obtained at different levels of sectoral disaggregation (𝑔 = 1, 2, … , 𝐺; in which 𝐺 is the most disaggregated level)1, with the weight of each level given by g:
𝑆𝑖ℎ𝑚 = ∑𝐺𝑔=1𝛼𝑔𝐸𝑖ℎ𝑚𝑔 , (3)
with ∑𝐺𝑔=1𝛼𝑔 = 1. 𝐸𝑖ℎ𝑚𝑔 is calculated as in equation (2) for each level g. The main difference between the index proposed in Crespo and Simões (2012) and the measure that we suggest in this paper is the fact that Crespo and Simões (2012) assume equal weights for all levels of sectoral disaggregation (i.e., a simple average) while we generalize that measure by allowing the weights to be defined according to the objectives of each study.
This procedure allows us to take into account that some sectors are more similar in terms of their characteristics and production requirements. In comparison to 𝐸𝑖ℎ𝑚, 𝑆𝑖ℎ𝑚 allows that distinct sectors at a higher level of sectoral disaggregation are classified as more similar if, when lower levels of disaggregation are considered, they belong to the same sector than when that does not occur.
The weights assigned to each level of disaggregation depend, as stated above, on the importance that the researcher wants to give to this dimension of structural similarity. Greater importance to this dimension implies more weight to less disaggregated levels of sectoral analysis. Of course, we should bear in mind that this option corresponds to assume a concept of trade competition based, in a higher proportion, on the level of potential competition instead of present competition, as explained in the Introduction.2
1 For example, when three levels of sectoral disaggregation are considered we could designate them as sectors, subsectors, and products.
2 It is important to note that the standard measure of structural similarity only considers one level of sectoral disaggregation. On the other hand, the index proposed by Crespo and Simões (2012) to capture the inter-sectoral dimension assumes equal weights and therefore, the maximum value that the weight given to the most disaggregated level can assume is 0.5, which occurs when only two levels of sectoral disaggregation are taken into account.
9
c. Intra-sectoral Similarity
Several studies have reported an increasing specialization by quality ranges at the international level, suggesting that besides inter-sectoral differences between the specialization patterns of the countries, there are important intra-sectoral differences (Fontagné et al., 2008; Kaitila, 2010; Vandenbussche et al., 2013). In order to incorporate this aspect in the evaluation of the degree of structural similarity, it is necessary to measure the quality of the goods, which, by definition is a complex task. When we consider trade data, the use of unit export values as a quality proxy is the usual procedure to overcome this problem (Stiglitz, 1987).
To incorporate intra-sectoral similarity in the structural similarity index we evaluate the difference, for each sector, between the quality level of the exports from the two countries under consideration. To that end we calculate the index 𝑂𝑖ℎ𝑚 as follows:
𝑂𝑖ℎ𝑚 = ∑𝐽𝑗=1𝜀𝑗𝑖ℎ𝑚𝑍𝑗𝑖ℎ𝑚, (4) with 𝜀𝑗𝑖ℎ𝑚 = 𝑣𝑗𝑖𝑚+𝑣𝑗ℎ𝑚 2 , (5) and 𝑍𝑗𝑖ℎ𝑚 = 𝑀𝑎𝑥 [𝑈𝑉(𝑥𝑀𝑖𝑛 [𝑈𝑉(𝑥𝑗𝑖𝑚),𝑈𝑉(𝑥𝑗ℎ𝑚)] 𝑗𝑖𝑚),𝑈𝑉(𝑥𝑗ℎ𝑚)]. (6)
For sector 𝑗, 𝑈𝑉(𝑥𝑗𝑖𝑚) and 𝑈𝑉(𝑥𝑗ℎ𝑚) are the unit values of the exports from i and h to
10 𝑂𝑖ℎ𝑚 works as an adjustment factor that reduces the level of structural similarity between 𝑖 and ℎ according to the average degree of intra-sectoral dissimilarity. In its turn, the degree of intra-sectoral similarity is calculated considering a weighted average of the differences, in each sector, in terms of quality ranges. The weights – expressed by
𝑗𝑖ℎ𝑚 – are the average share of 𝑗 in the exports from 𝑖 and ℎ to 𝑚.
Therefore, the indicator capturing sectoral shares similarity and intra-sectoral similarity is obtained as:
𝐴𝑖ℎ𝑚 = 𝑂𝑖ℎ𝑚𝐸𝑖ℎ𝑚. (7) When the unit export values of 𝑖 and ℎ to 𝑚 are exactly the same, 𝑍𝑗𝑖ℎ𝑚 = 1. If this is
the case for all products, 𝑂𝑖ℎ𝑚 = 1 and, therefore, 𝐴𝑖ℎ𝑚 = 𝐸𝑖ℎ𝑚. A greater difference in the unit export values implies a greater penalization on 𝐸𝑖ℎ𝑚, indicating a lower degree of structural similarity between 𝑖 and ℎ.
d. Structural Similarity – An Overall Index
In the above subsections we discussed indexes of structural similarity that include three dimensions – sectoral shares, inter-sectoral, and intra-sectoral similarity. Now, in order to obtain an overall measure of structural similarity we construct an index that simultaneously includes all these dimensions:
𝐶𝑖ℎ𝑚 = ∑ 𝛼𝑔𝐸
𝑖ℎ𝑚𝑔 + 𝛼𝐺 𝐺−1
𝑔=1 𝐸𝑖ℎ𝑚𝐺 𝑂𝑖ℎ𝑚𝐺 . (8)
𝐶𝑖ℎ𝑚 is calculated in same way as 𝑆𝑖ℎ𝑚 (equation 3) but now incorporating the
adjustment suggested in the previous subsection in order to consider the intra-sectoral similarity. This adjustment is introduced only at the most disaggregated level of sectoral analysis because we need such level of detail to allow the assumption of prices as
11 quality proxy. An important consequence of this aspect is however the fact that the importance given to intra-sectoral similarity depends on the weight given to the most disaggregated level of sectoral analysis (𝛼𝐺). Therefore, the value of 𝛼𝐺 should be high
enough to account for intra-sectoral similarity and low enough to capture inter-sectoral similarity. The concrete values are of course a subjective decision of the researcher but, in our opinion, 𝛼𝐺 should range between 0.5 and 0.9.3
The index 𝐶𝑖ℎ𝑚 takes its maximum value (i.e., 𝐶𝑖ℎ𝑚 = 1) when the exports of 𝑖 and ℎ to
market 𝑚 are equal in terms of the three dimensions of structural similarity considered.
e. Total Exports Overlap
All the indexes discussed until now are (partial or overall) measures of structural similarity. In this subsection, we argue that the competition between two countries in a given market depends not only on the level of structural similarity but also on the value of total exports and, more specifically, on the degree of overlap between these two flows. A simple example illustrates the point. Let us consider three countries – 𝐴, 𝐵, and 𝐶 – and assume that the weights of all sectors are equal in the three countries, the only difference being the overall value of their exports, which is similar between 𝐴 and 𝐵 but very different between these countries and 𝐶. Although 𝐸𝑖ℎ𝑚 indicates a similar level of structural similarity between all pairs of countries (in this case, maximum similarity), these situations are distinct and express different levels of trade competition. This question was introduced by Jenkins (2008) by referring that structural similarity indexes capture only the composition of the exports of the two countries under comparison and that this procedure implies obtaining a single value for a pair of countries. According to Jenkins (2008, p. 1355), “no index which implies that Honduras
12 is as much a competitive threat to China’s export markets as China is for Honduran exports is credible”. To overcome this limitation, Jenkins (2008) introduces two new indicators: the static and the dynamic index of competitive threat. These indexes reflect the proportion of total exports of a country concentrated in products in which the other country is globally competitive.
Following a different perspective, we incorporate the overlap between total exports by adjusting the structural similarity indicator. Obviously, accounting for this dimension implies obtaining not a single value per pair of countries but instead a value for each of the two countries under comparison. We start by proposing an adjustment to 𝐸𝑖ℎ𝑚 in order to take into account the level of total exports overlap between the two countries under analysis, which, in its simplest form, is expressed as:
𝐵𝑖ℎ𝑚′ = 𝜇
𝑖ℎ𝑚𝐸𝑖ℎ𝑚 (9)
where
𝜇𝑖ℎ𝑚 = Min [𝑥𝑖𝑚, 𝑥ℎ𝑚]
Max [𝑥𝑖𝑚, 𝑥ℎ𝑚]. (10)
In this version, the impact of the degree of trade overlap is fully captured in our index. We may however consider a generalized version of 𝐵𝑖ℎ𝑚′ in which the adjustment of the
structural similarity index depends on the importance given to this dimension. In this case, we have4:
𝐵𝑖ℎ𝑚 = (1 −1−𝜇𝑖ℎ𝑚
𝜆 ) 𝐸𝑖ℎ𝑚. (11)
4
We could of course consider 𝑖ℎ𝑚. However, it seems reasonable to assume a constant value for . This parameter allows us to take full or only partial consideration of the differential between the volumes of trade of the two countries. For example, when 𝜆 = 2, only 50% of that differential is considered.
13 The influence of the total exports overlap decreases as the parameter increases (≥ 1), with 𝐵𝑖ℎ𝑚 converging to 𝐸𝑖ℎ𝑚.
In this case, trade competition is maximum when both the weights of each sector and total exports are equal in the two countries. In all the cases in which 𝑥𝑖𝑚 ≠ 𝑥ℎ𝑚 we will
have a trade competition index assuming different values for the countries under analysis (𝐵𝑖ℎ𝑚 for country 𝑖 and 𝐵𝑖ℎ𝑚 for country ℎ; hereinafter we will designate these
indexes as country specific indexes and 𝐵𝑖ℎ𝑚 as country-pair specific index). This is an important characteristic of this dimension. In the following steps of our methodological approach, when we combine this dimension with other dimensions we will also obtain different values for countries 𝑖 and ℎ. In order to obtain 𝐵𝑖ℎ𝑚 and 𝐵𝑖ℎ𝑚 we start from 𝐸𝑖ℎ𝑚 and assume the following reasoning: (i) for the larger exporter, we calculate 𝐸𝑖ℎ𝑚 − (𝐸𝑖ℎ𝑚 − 𝐵𝑖ℎ𝑚), being therefore the trade competition index equal to 𝐵𝑖ℎ𝑚; (ii) for the smaller exporter, the index corresponds to 𝐸𝑖ℎ𝑚 + (𝐸𝑖ℎ𝑚− 𝐵𝑖ℎ𝑚), introducing this way a penalization factor that adds to the measure of structural similarity in order to obtain an index of trade competition. In formal terms, we have:
𝐵𝑖ℎ𝑚 = {𝐵2𝐸𝑖ℎ𝑚 𝑖𝑓 𝑥𝑖𝑚 > 𝑥ℎ𝑚
𝑖ℎ𝑚− 𝐵𝑖ℎ𝑚 𝑖𝑓 𝑥𝑖𝑚 ≤ 𝑥ℎ𝑚 (12)
and
𝐵𝑖ℎ𝑚 = {𝐵2𝐸𝑖ℎ𝑚 𝑖𝑓 𝑥ℎ𝑚 > 𝑥𝑖𝑚
𝑖ℎ𝑚 − 𝐵𝑖ℎ𝑚 𝑖𝑓 𝑥ℎ𝑚 ≤ 𝑥𝑖𝑚 . (13)
𝐵𝑖ℎ𝑚 and 𝐵𝑖ℎ𝑚 range between 0 and 2.
If we wish to take into account all the dimensions of structural similarity – sectoral shares similarity, inter-sectoral similarity, and intra-sectoral similarity – and the degree of total exports overlap, we can obtain a new index of trade competition:
14 𝑈𝑖ℎ𝑚 = ∑ 𝛼𝑔𝐵 𝑖ℎ𝑚𝑔 + 𝛼𝐺 𝐺−1 𝑔=1 𝐵𝑖ℎ𝑚𝐺 𝑂𝑖ℎ𝑚𝐺 , (14) where: 𝐵𝑖ℎ𝑚𝑔 = (1 −1−𝜇𝑖ℎ𝑚 𝜆 ) 𝐸𝑖ℎ𝑚 𝑔 . (15)
Since 𝐵𝑖ℎ𝑚𝑔 varies by country, we can also obtain indicators 𝑈𝑖ℎ𝑚 for each country. 𝑈𝑖ℎ𝑚
and 𝑈𝑖ℎ𝑚 are calculated using the same logic of 𝑈𝑖ℎ𝑚:
𝑈𝑖ℎ𝑚 = ∑𝐺−1𝑔=1𝛼𝑔𝐵𝑖ℎ𝑚𝑔 + 𝛼𝐺𝐵𝑖ℎ𝑚𝐺 𝑂𝑖ℎ𝑚𝐺 (16)
and
𝑈𝑖ℎ𝑚 = ∑𝐺−1𝑔=1𝛼𝑔𝐵𝑖ℎ𝑚𝑔 + 𝛼𝐺𝐵𝑖ℎ𝑚𝐺 𝑂𝑖ℎ𝑚𝐺 . (17)
3. TRADE COMPETITION IN A GROUP OF COUNTRIES
In the previous section, we discussed our proposal for the measurement of trade competition between two countries in a given market. Table 1 summarizes the indicators presented until this moment, highlighting the dimensions captured by each of them (Table 1). Each of these indicators is a trade competition index between 𝑖 and ℎ in market 𝑚 and hereinafter will be designated in generic terms as 𝑇𝐶𝐼𝑖ℎ𝑚.
[Insert Table 1 here]
In this section, we take a step forward by evaluating the overall level of trade competition between two countries in a group of markets (instead of only one).5 By
5 According to the purpose of the analysis, this group of markets can include all destination markets or only a subgroup.
15 broadening the spectrum of analysis, we gain an overall picture about the competitive threat that one country represents to another in all markets in which they compete. Going from 𝑇𝐶𝐼𝑖ℎ𝑚 to 𝑇𝐶𝐼𝑖ℎ indicators introduces a new methodological challenge.
Each country (potentially) exports to (𝑀 − 1) countries. However, this group of destination countries is not equal, there is one element that is different. In fact, while country 𝑖 can export to country ℎ, country ℎ can export to country 𝑖. Our suggestion to overcome this problem involves the direct comparison of the bilateral flows between countries i and ℎ.
To analyze the level of trade competition between countries i and h in their exports to a group of destination markets, we calculate an overall index based on a weighted average of trade competition in each individual market. This index is expressed as follows:
𝐿𝑇𝐶𝐼𝑖ℎ = ∑𝑀𝑚=1 𝑇𝐶𝐼𝑖ℎ𝑚𝛿𝑖ℎ𝑚
𝑚≠𝑖,ℎ + 𝑇𝐶𝐼𝑖−ℎ(1 − ∑ 𝛿𝑖ℎ𝑚
𝑀 𝑚=1
𝑚≠𝑖,ℎ ) (18)
with 𝑇𝐶𝐼𝑖−ℎ being the index of trade competition, calculated in the same way as 𝑇𝐶𝐼𝑖ℎ𝑚, which compares the exports from 𝑖 to ℎ with the exports from ℎ to 𝑖. In turn, 𝑖ℎ𝑚 is
given by: 𝑖ℎ𝑚 = (𝑖𝑚+2ℎ𝑚), (19) where 𝛿𝑖𝑚 = ∑ 𝑥𝑖𝑚𝑥 𝑖𝑚 𝑀 𝑚=1 and 𝛿ℎ𝑚= 𝑥ℎ𝑚 ∑𝑀𝑚=1𝑥ℎ𝑚.
In this case, maximum overall competition requires the existence of maximum similarity in the trade flows for each destination market.
𝐿𝑖ℎ can be based on any of the 𝑇𝐶𝐼𝑖ℎ𝑚 discussed in the previous sections. We will designate the 𝐿𝑖ℎ obtained from 𝐸𝑖ℎ𝑚 as 𝐿𝐸𝑖ℎ, from 𝐴
16 4. AN EXAMPLE
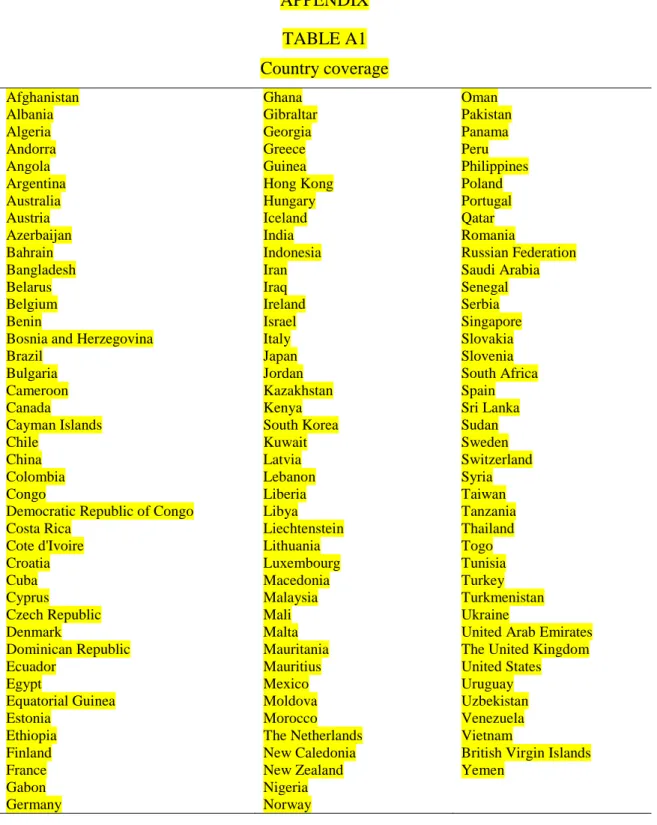
Throughout the previous sections we proposed a conceptual framework to measure the degree of trade competition between two countries. In order to illustrate the methodology, we now present an empirical example. We analyze the trade competition among six European economies – Germany (𝐷𝐸), France (𝐹𝑅), the United Kingdom (𝐺𝐵), Greece (𝐺𝑅), Hungary (𝐻𝑈), and Sweden (𝑆𝐸) – in 2007, 2011, and 2015. As destination markets we include, in addition to these six countries, a total of 118 markets (i.e., 𝑀 = 124), corresponding to the near totality of the trade flows from these countries (Germany: 99.28%; France: 98.22%; the United Kingdom: 98.46%; Greece: 98.15%; Hungary: 99.67%; Sweden: 99.15%).An overview of the countries included in our sample is given in Table A1 in the Appendix.
Trade data (in value and volume) is drawn from Eurostat using the Harmonized Commodity Description and Coding System (HS nomenclature). The largest level of sectoral disaggregation is HS6. Additionally, for incorporating inter-sectoral similarity, exports data (in value) classified in terms of HS2 and HS4 are also considered.
Applying the methodological proposal presented in Sections 2 and 3 to these data produces a large amount of very rich evidence. We will focus the analysis on the index described in Section 3 (𝐿𝑖ℎ) because this is built from the previous ones, and it is therefore possible to see how the different dimensions add to the understanding of the level of competition between each of the 15 pairs of countries.
a. Sectoral Shares Similarity
We will start with the 𝐿𝑖ℎ based on 𝐸𝑖ℎ𝑚 which is the index most frequently used in the literature to analyze structural similarity and which, for this reason, will provide a
17 benchmark to measure the impact of the remaining dimensions of trade competition. To compute this index we consider data at the most disaggregated level (HS6).
The results in Table 2 allow us to retain some important conclusions. First, a significant degree of heterogeneity is detected. In fact, considering the evidence for 2015, the values for the 15 country pairs range between 0.09 (GR-HU) and 0.426 (DE-FR).
[Insert Table 2 here]
Second, DE-FR and DE-GB are the pairs that show the highest overall level of structural similarity, with values for 𝐿𝐸𝑖ℎ of 0.426 and 0.388, respectively. Other pairs that also reveal high levels of structural similarity are FR-GB (0.335) and DE-SE (0.321). Adding to this last result, we can verify that all the values of 𝐿𝐸𝑖ℎ above 0.2 concern country pairs including at least one of the three largest European economies (Germany, France, the United Kingdom). Fourth, the pair that presents the lowest level of structural similarity (GR-HU) reveals an interesting characteristic: there are 8 destination markets for which 𝐸𝐺𝑅,𝐻𝑈,𝑚 = 0. This contrasts with the average number of 𝐸𝑖ℎ𝑚 = 0 for all pairs which is 0.67. In our sample, Greece is the country that exports
the smallest number of products to the 123 destination markets considered. Using the HS6 digit level, Greece exports on average 455 products (out of the 6280 possible). This number compares with an average of: 2575 for Germany; 2034 for France; 1835 for the United Kingdom; 1067 for Sweden; and 677 for Hungary. This evidence means therefore that Greece and Hungary are exporting a small number of different products. Fifth, it is possible to say that the central message emerging from the data for 2015 is also valid for the two other years under analysis.
18 The incorporation of inter-sectoral similarity requires assigning weights to the different levels of sectoral disaggregation (HS2, HS4, and HS6). To minimize the subjectivity in this process, we test three alternative sets of values for these weights (𝛼1, 𝛼2, and 𝛼3)
gradually increasing the importance attributed to less disaggregated levels (HS2 and HS4).6 Each of these alternatives leads to a different 𝑆𝑖ℎ𝑚 indicator (𝑆𝑖ℎ𝑚(1),𝑆𝑖ℎ𝑚(2), and 𝑆𝑖ℎ𝑚(3)) and consequently to a different 𝐿𝑖ℎ.
The results shown in Table 2 support two main conclusions. First, in comparison to the evidence drawn from 𝐿𝐸𝑖ℎ, there is an increase in the level of trade competition for all pairs of countries. This is of course an implication of the adjustment introduced by the consideration of the inter-sectoral dimension. In the extreme case, when 𝛼3 = 1 we obtain 𝐿𝐸𝑖ℎ = 𝐿𝑆𝑖ℎ. The consideration of other levels of sectoral disaggregation obviously leads to an increase in the level of structural similarity. When lower values are assigned to 𝛼3, the impact of the inter-sectoral similarity is more pronounced and therefore the differential of 𝐿𝑖ℎ𝑆 vis-à-vis 𝐿𝐸𝑖ℎ increases. Second, this increase is more pronounced for the pairs with the lowest values of 𝐿𝐸𝑖ℎ, namely GR-HU, GR-SE, and HU-SE. Taken 𝐿𝑖ℎ𝑆(1) as example, the highest increase occurs in the case GR-HU in which 𝐿𝑖ℎ𝑆(1) is 10.6% higher than 𝐿𝐸𝑖ℎ. This result can be compared with increases of 3.2% for the pair DE-FR
and 3.5% for DE-GB.
In the Appendix (Table A2), we present some complementary evidence. For each pair, the destination markets were ranked according to their average weight in total exports from the smallest to the largest value and then divided into ten groups (the number of destination markets for each pair is 123 and, except for the first three groups – less
6 The three alternative set of values assumed here take into consideration the discussion produced in the methodological section. See, for example, footnote 2.
19 relevant markets – which include 13 countries each, the other seven groups have 12 countries each).
For all the 15 pairs considered, the 24 most important markets (Groups 9 and 10) absorb more than 75% of total exports. For each group we selected a set of indicators (𝐸𝑖ℎ𝑚, 𝑆𝑖ℎ𝑚(2), 𝐴𝑖ℎ𝑚, 𝐵𝑖ℎ𝑚(2), 𝑈𝑖ℎ𝑚(5)) and present their average values
(𝐸̅𝑖ℎ𝑚, 𝑆̅𝑖ℎ𝑚(2), 𝐴̅𝑖ℎ𝑚, 𝐵̅𝑖ℎ𝑚(2), 𝑈̅𝑖ℎ𝑚(5), respectively).
In Table A2 we present, for each group of destination markets, the ratios between the average values of 𝑇𝐶𝐼𝑖ℎ𝑚 indexes and the average values of 𝐸𝑖ℎ𝑚. From this evidence
we obtain a deeper understanding about the causes of the increase of the 𝐿𝑆𝑖ℎ indicators
(in comparison to 𝐿𝐸𝑖ℎ). It is possible to conclude that, for the majority of the country pairs, the impact of introducing the inter-sectoral dimension is stronger in the first groups of countries, i.e., in the case of the less important destination markets. For example, in the case of the pair GR-HU (which registers the highest increase of 𝐿𝑆𝑖ℎ indicators vis-à-vis 𝐿𝐸𝑖ℎ), the evidence shows that the impact is more pronounced in Groups 1 to 4. This occurs because: (i) since 𝐸̅𝑖ℎ𝑚 is a very small number, small increases in absolute terms give rise to considerable changes in relative terms; (ii) using the HS6 nomenclature, these countries are exporting different (although relatively similar) products. This means that there is a high likelihood that these products belong to the same category when we use the HS4 or HS2 nomenclatures. As an example, let us consider the case of group 2. The ratio between 𝑆̅𝑖ℎ𝑚(2) and 𝐸̅𝑖ℎ𝑚 is 4.856. The destination markets that are most responsible for this increase are Costa Rica, Cote d’Ivoire, Venezuela, Tanzania, and Ecuador. The case of this last country is illustrative of what occurs with the less important markets. Using the HS6 nomenclature, Greece and Hungary export 39 and 88 products, respectively, for this market but only 3 products are the same (𝐸𝐺𝑅,𝐻𝑈,𝑚= 0.00001). However, using HS2, exports become
20 concentrated in some categories such as sector 39 “Plastics and Articles Thereof”, sector 84 “Nuclear Reactors, Boilers, Machinery and Mechanical Appliances, Parts Thereof”, and sector 90 “Optical, Photographic, Cinematographic, Measuring, Checking, Medical or Surgical Instruments and Apparatus; Parts and Accessories”. As a consequence, 𝑆𝐺𝑅,𝐻𝑈,𝑚(2)= 0.017 which means that 𝑆𝐺𝑅,𝐻𝑈,𝑚(2)/𝐸𝐺𝑅,𝐻𝑈,𝑚= 1700.
c. Intra-sectoral Similarity
Table 3 contains the results for 𝐿𝑖ℎ based on 𝐴𝑖ℎ𝑚 – accounting for sectoral shares similarity and intra-sectoral similarity – and 𝐶𝑖ℎ𝑚 – also including inter-sectoral similarity.
[Insert Table 3 here]
Let us consider, once again, 2015 as reference year. A first important finding is that there is a strong similarity in the quality ranges of the products exported by the following country pairs: DE-FR (𝐿𝐷𝐸,𝐹𝑅
𝐴 𝐿𝐷𝐸,𝐹𝑅𝐸 = 0.615), DE-SE ( 𝐿𝐴𝐷𝐸,𝑆𝐸 𝐿𝐸𝐷𝐸,𝑆𝐸 = 0.556), DE-GB (𝐿𝐷𝐸,𝐺𝐵 𝐴 𝐿𝐸𝐷𝐸,𝐺𝐵 = 0.545), and DE-HU ( 𝐿𝐷𝐸,𝐻𝑈𝐴
𝐿𝐸𝐷𝐸,𝐻𝑈 = 0.532). While the results for the first three pairs
are expected, the fourth is less obvious. However, this evidence should be understood in a historical context where Hungary has been showing a strong improvement in terms of quality of exports. This evolution is not new. Crespo and Fontoura (2007) conclude that, in 2003, Hungary is one of the Central and Eastern European Countries (CEEC) where the weight of the higher categories in terms of quality ranges is the highest. Moreover, this study concludes that, in the case of Estonia, Slovakia, and Hungary, “exports of a higher quality correspond to sectors with a higher weight on trade” (p. 625-626). This idea also helps to explain the evidence obtained in our analysis. In fact, in the present
21 case, we can say that Germany and Hungary, despite some differences in terms of sectoral shares, have some important sectors in which the unit values of exports are similar, conducing to high values for 𝑍𝑗𝑖ℎ𝑚. This occurs, for example, in the following sectors: sector 84 “Nuclear Reactors, Boilers, Machinery and Mechanical Appliances; Parts Thereof”, sector 85 “Electrical Machinery and Equipment and Parts Thereof; Sound Recorders and Reproducers; Television Image and Sound Recorders and Reproducers, Parts and Accessories of such Articles”, and sector 87 “Vehicles; Other than Railway or Tramway Rolling Stock, and Parts and Accessories Thereof”. On the other extreme, showing higher levels of dissimilarity in terms of quality ranges exported (with ratios between 𝐿𝐴𝑖ℎ and 𝐿𝐸𝑖ℎ below 0.4), we can identify the pairs GR-SE, GB-GR, HU-SE, and GR-HU. Despite some obvious differences in quantitative terms, the key ideas emerging from 𝐿𝐴𝑖ℎ remain valid for all the years considered.
Complementing this result with the evidence from Table A2, we see that the difference (in relative terms) between 𝐴̅𝑖ℎ𝑚 and 𝐸̅𝑖ℎ𝑚 is smaller for the pair DE-FR than for the
other pairs and that this higher similarity is found for all ten groups of countries with the exception of Groups 3 and 4.
Turning now to 𝐿𝑖ℎ based on 𝐶𝑖ℎ𝑚, what occurs in this case is a consequence of what we concluded from the pieces we have gathered until this moment. When we consider 𝐿𝐶𝑖ℎ(1),
the conclusions are very similar to those derived from 𝐿𝐴𝑖ℎ, which is not surprising because in this specific case 𝛼3 is 0.9 and therefore the inter-sectoral dimension has a small impact on the overall measure of structural similarity. When lower values for 𝛼3 are considered, which occurs with 𝐿𝐶𝑖ℎ(2) and even more with 𝐿𝐶𝑖ℎ(3), the impact of the several dimensions changes. For example, in this last case, the conclusions obtained from 𝐿𝑖ℎ𝐶(3) reveal the high influence of the inter-sectoral dimension. In all the cases, however, the ranking of the country pairs does not change significantly in terms of their
22 degree of structural similarity, allowing to retain some of the key ideas presented above, namely the high level of structural similarity registered among the largest European economies.
d. Total Exports Overlap
The 𝐿𝐵𝑖ℎ indexes attend simultaneously to sectoral shares similarity and total exports overlap (Table 4). We use three alternative values for the parameter 𝜆 involved in these indexes. With 𝜆 = 1 (full incorporation of the total exports overlap dimension), from 𝐿𝐵𝑖ℎ(1) it is possible to conclude that, in all years under analysis, there is a less
pronounced decrease in the index for the pair FR-GB (𝐿𝐸𝐹𝑅,𝐺𝐵 = 0.335 drops to 𝐿 𝐹𝑅,𝐺𝐵 𝐵(1) =
0.190, in 2015)7 due to the fact that these countries have the most similar global dimension (in terms of total exports).
[Insert Table 4 here]
In the case of 𝐿𝐵𝑖ℎ(2) and 𝐿 𝑖ℎ
𝐵(3) the indicators suffer a lower decrease when compared with
the impact on 𝐿𝐵𝑖ℎ(1)
. Nevertheless, the qualitative impact is similar in what concerns the ranking of the most penalized country pairs. Considering once again the evidence presented in Table A2, we can see that, with the exception of Groups 4 and 5, it is for the pair FR-GB that we find a narrower gap between 𝐸̅𝑖ℎ𝑚 and 𝐵̅𝑖ℎ𝑚(2).
Regarding 𝐿𝑈𝑖ℎ , the overall trade competition indexes capturing simultaneously the three
dimensions of structural similarity and total exports overlap, we calculate nine alternatives resulting from varying the values given to 𝛼1, 𝛼2, 𝛼3, and 𝜆. In Table 4 we
present 3 of these alternatives which are developed assuming 𝜆 = 2 and three
7 This corresponds to (𝐿𝐹𝑅,𝐺𝐵
𝐵(1)
23 alternative sets of parameters for 𝛼1, 𝛼2 , and 𝛼3: 𝑈𝑖ℎ𝑚(2) is based on (𝛼1, 𝛼2, 𝛼3) = (0.025, 0.075, 0.9); 𝑈𝑖ℎ𝑚(5) - (𝛼
1, 𝛼2, 𝛼3) = (0.1, 0.15, 0.75); and 𝑈𝑖ℎ𝑚(8) - (𝛼1, 𝛼2,
𝛼3) = (0.2, 0.3, 0.5). The remaining alternatives are presented in the Appendix (Table A3).
From the results presented in Table 4 we conclude that, with the exception of 𝐿𝑈𝑖ℎ(3) in 2007, the three country pairs comparing the largest European economies reveal the highest values in all the measures considered, i.e., for all years and combination of parameters, despite some obvious quantitative differences. This evidence arises from a combination of effects: (i) less accentuated difference in terms of total exports; (ii) the highest similarity in terms of sectoral shares; (iii) similarity in the quality ranges exported.
e. An Analysis by Exporting Country
Finally, Table 5 contains evidence concerning the idea introduced in subsection 2e that to measure competition for one pair of countries, instead of only one index we should have a different value for each of the countries under consideration. For this analysis, we have selected some 𝐿𝐵𝑖ℎ and 𝐿
𝑖ℎ
𝑈 indicators with different values for the parameters.
[Insert Table 5 here]
There are interesting results to highlight from Table 5. First, the evidence obtained with 𝐿𝐵𝑖,ℎ (2)emphasizes the fact that the smaller country may suffer an important increase in its
country specific index. This makes clear that the larger countries are stronger competitors than we can infer from the analysis of the baseline index (𝐿𝐸𝑖,ℎ ). The results
provided in the first column of Table 5 allow us to conclude that Greece is the country that suffer the strongest competition from the three larger European economies. In fact,
24 when we compare the 𝐿𝐵𝑖,ℎ (2) with 𝐿
𝑖,𝐺𝑅
𝐵(2)(𝑖 = 𝐷𝐸, 𝐺𝐵, 𝐹𝑅), it is possible to see very high
increases in the country specific index for Greece. The ratios between the country specific index and the baseline index are: 2.48 for the pair DE-GR, 2.35 for the pair FR-GR, and 2.26 for the pair GB-GR. Second, other pairs with a very significant impact for the smaller country include DE-SE (with a ratio of 2.23) and DE-HU (with a ratio of 2.15). Third, the gap between 𝐿𝐵𝐷𝐸,ℎ (2) and the correspondent 𝐿𝐵𝐷𝐸,ℎ (2) is small for all the countries h considered (France, the United Kingdom, Greece, Hungary, and Sweden). For example, with data for 2015, the gap between 𝐿𝐵𝐷𝐸,𝐹𝑅 (2) and 𝐿𝐵𝐷𝐸,𝐹𝑅 (2) is very small (𝐿𝐵𝐷𝐸,𝐹𝑅 (2) = 0.307; 𝐿
𝐷𝐸,𝐹𝑅
𝐵(2) = 0.314). The same occurs, in qualitative terms, for the
remaining countries. In fact, the increases registered by the indexes for Germany are always inferior to 10%. This result arises because German exports are higher than the values presented by: France in 95 markets; the United Kingdom in 106 markets; Greece in 120 markets; Hungary in 122 markets; and Sweden in 121 markets. Fourth, the other pair presenting a gap of similar magnitude between 𝐿𝐵𝑖ℎ (2) and the indicator for the larger
exporter is FR-HU (𝐿𝐵𝐹𝑅,𝐻𝑈 (2) = 0.161; 𝐿 𝐹𝑅,𝐻𝑈
𝐵(2) = 0.175, with an increase of 8.7%). Fifth,
FR-GB and HU-SE reveal the smallest gap between 𝐿𝐵𝑖ℎ𝑚(2) and 𝐿𝐵𝑖ℎ𝑚(2) (𝐿𝐹𝑅,𝐺𝐵 𝐵(2)
𝐿𝐵(2)𝐹𝑅,𝐺𝐵= 1.09 and 𝐿𝐻𝑈,𝑆𝐸𝐵(2)
𝐿𝐻𝑈,𝑆𝐸𝐵(2) = 1.08). These are the two pairs with closest values of total exports ( 𝑥𝐹𝑅
𝑥𝐺𝐵 = 1.11
and 𝑥𝑆𝐸
𝑥𝐻𝑈 = 1.41). However France exports more than the United Kingdom to 81
markets while Sweden exports more than Hungary for 95 markets. Finally, the findings for the indicators 𝐿𝑈𝑖ℎ are, in general terms, similar to those using the 𝐿𝐵𝑖ℎ indicators.
25 The main goal of the present study was the methodological discussion of a set of measures that allow a broader understanding of the concept of trade competition. We defined this concept as being a function of both structural similarity and total exports overlap while, in turn, the first concept encapsulates three dimensions: (i) sectoral shares similarity, as in the standard Krugman Specialization Index or similar measures; (ii) intra-sectoral similarity; and (iii) inter-sectoral similarity. Building on this multidimensional concept, we propose indexes that allow the quantification of the trade competition phenomenon both in a specific destination market and in a group of markets. Of course, as we propose several measures, each one including different dimensions of similarity, the evidence obtained concerning the ranking of country pairs in terms of trade competition depends on the specific measure considered in the analysis. Therefore, a correct interpretation of the evidence produced requires a clear identification of the index used in each empirical exercise.
In order to provide an empirical example of the methodology proposed, we considered evidence from six European economies – Germany, France, the United Kingdom, Greece, Hungary, and Sweden – in 2007, 2011, and 2015. The results obtained in the empirical example emphasize the high level of trade competition among the largest European economies, namely Germany, France, and the United Kingdom. The evidence obtained with the multidimensional measures suggested in this study also leads to the conclusion that trade competition may arise from different sources, making clear that partial evidence resulting from a unidimensional analysis may provide an incomplete picture of the complex reality of trade competition.
As our main contribution is a methodological one, the challenge now concerns the application of the measures suggested in this paper to a broad range of different countries and time periods. This is a critical step toward a better understanding of a
26 complex and dynamic phenomenon with evident implications for the countries in terms of competitiveness and growth. In the methodological sphere, further research must be devoted to a detailed identification of the contribution of the different dimensions considered to the final level of trade competition between the countries. However, perhaps the main ideas to retain from this study is that the study of trade competition is a fundamental issue in the context of the empirical analysis of international trade and that the development of better measures for this concept is a critical task for international trade researchers.
REFERENCES
Antimiani, A. and R. Henke (2007), ‘Old and New Partners: Similarity and Competition in the EU Foreign Agri-food Trade’, Acta Agriculturae Scandinavica, Section C – Food
Economics, 4, 3, 129-38.
Berthelon, M. and C. Freund (2008), ‘On the Conservation of Distance in International Trade’, Journal of International Economics, 75, 2, 310-20.
Blázquez-Lidoy, J., J. Rodríguez and J. Santiso (2006), ‘Angel or Demon? China’s Trade Impact’, CEPAL Review, 90, 15-41.
Carter, C. and X. Li (2004), ‘Changing Trade Patterns in Major OECD Countries’,
Applied Economics, 36, 14, 1501-11.
Crespo, N. and M. Fontoura (2007), ‘Integration of CEECs into EU Market: Structural Change and Convergence’, Journal of Common Market Studies, 45, 3, 611-32.
Crespo, N. and N. Simões (2012), ‘On the Measurement of a Multidimensional Concept of Structural Similarity’, Economics Letters, 116, 1, 115-17.
De Benedictis, L. and L. Tajoli (2007), ‘Economic Integration and Similarity in Trade Structures’, Empirica, 34, 2, 117-37.
Duboz, M. and J. Le Gallo (2011), ‘Are EU-15 and CEEC Agricultural Exports in Competition? Evidence for 1995-2005’, Economics Bulletin, 31, 1, 134-46.
27 Finger, J. and M. Kreinin (1979), ‘A Measure of ‘Export Similarity’ and its Possible Uses’, Economic Journal, 89, 356, 905-12.
Fontagné, L., G. Gaulier and S. Zignago (2008), ‘Specialization Across Varieties and North–South Competition’, Economic Policy, 23, 53, 51-91.
Giovannetti, G., M. Sanfilippo and M. Velucchi (2013), ‘The “China Effect” on EU Exports to OECD Markets: A Focus on Italy’, in G. Gomel, D. Marconi, I. Musu, and B. Quintieri (eds.), The Chinese Economy (Berlin Heidelberg: Springer), 163-180. Greenaway, D., A. Mahabir and C. Milner (2008), ‘Has China Displaced other Asian Countries' Exports?’, China Economic Review, 19, 2, 152-69.
Head, K. and T. Mayer (2013), ‘What Separates Us? Sources of Resistance to Globalization’, Canadian Journal of Economics, 46, 4, 1196-231.
Jenkins, R. (2008), ‘Measuring the Competitive Threat from China for Other Southern Exporters’, The World Economy, 31, 10, 1351-66.
Jenkins, R. (2012), ‘China and Brazil: Economic Impacts of a Growing Relationship’,
Journal of Current Chinese Affairs, 41, 1, 21-47.
Jenkins, R., E. Peters and M. Moreira (2008), ‘The Impact of China on Latin America and the Caribbean’, World Development, 36, 2, 235-53.
Kaitila, V. (2010), ‘Quality-adjusted Similarity of EU Countries’ Export Structures’, Discussion Papers 1227 (Helsinki: ETLA).
Kaplinsky, R. and D. Messner (2008), ‘Introduction: The impact of Asian Drivers on the Developing World’, World Development, 36, 2, 197-209.
Krugman, P. (1991), Geography and Trade (London: MIT Press).
Lall, S. and M. Albaladejo (2004), ‘China’s Competitive Performance: A Threat to East Asian Manufactured Exports?’, World Development, 32, 9, 1441-66.
Lall, S., J. Weiss and H. Oikawa (2005), ‘China’s Competitive Threat to Latin America: An Analysis for 1990–2002’, Oxford Development Studies, 33, 2, 163-94.
Langhammer, R. and R. Schweickert (2006), ‘EU Integration and its Implications for Asian Economies: What We Do and Do Not Know’, Journal of Asian Economics, 17, 3, 395-416.
28 Palan, N. (2010), ‘Measurement of Specialization – The Choice of Indexes’, Working Papers 62 (Vienna: FIW).
Riad, N., M. Errico, C. Henn, C. Saborowski, M. Saito and M. Turunen (2012),
Changing Patterns of Global Trade (Washington: International Monetary Fund).
Schott, P. (2008), ‘The Relative Sophistication of Chinese Exports’, Economic Policy,
23, 53, 5-49.
Shafaeddin, S. (2004), ‘Is China’s Accession to WTO Threatening Exports of Developing Countries?’, China Economic Review, 15, 2, 109-44.
Stiglitz, J. (1987), ‘The Causes and Consequences of the Dependence of Quality of Price’, Journal of Economic Literature, 25, 1, 1-48.
Vandenbussche, H., F. Comite, L. Rovegno and C. Viegelahn (2013), ‘Moving Up the Quality Ladder? EU-China Dynamics in Clothing’, Journal of Economic Integration,
28, 2, 303-26.
Wu, H. and C. Chen (2004), ‘Changes in the Foreign Market Competitiveness of East Asian Exports’, Journal of Contemporary Asia, 34, 4, 503-22.
29 TABLE 1
Trade Competition Indexes
𝑇𝐶𝐼𝑖ℎ𝑚 Structural similarity Total exports overlap Parameters Sectoral shares similarity Inter-sectoral similarity Intra-sectoral similarity 𝐸𝑖ℎ𝑚 x 𝛽 𝑆𝑖ℎ𝑚 x x 𝛽, 𝛼𝐺(𝑔 = 1, … , 𝐺) 𝐴𝑖ℎ𝑚 x x 𝛽 𝐶𝑖ℎ𝑚 x x x 𝛽, 𝛼𝐺(𝑔 = 1, … , 𝐺) 𝐵𝑖ℎ𝑚 x x 𝛽, 𝜆 𝑈𝑖ℎ𝑚 x x x x 𝛽, 𝛼𝐺(𝑔 = 1, … , 𝐺), 𝜆
30 TABLE 2
Trade Competition Indexes (Sectoral Shares Similarity and Inter-sectoral Similarity)
𝑇𝐶𝐼𝑖ℎ𝑚 𝐸𝑖ℎ𝑚 𝑆𝑖ℎ𝑚 (1) 𝑆 𝑖ℎ𝑚(2) 𝑆𝑖ℎ𝑚(3) 2007 2011 2015 2007 2011 2015 2007 2011 2015 2007 2011 2015 𝐿𝑇𝐶𝐼𝐷𝐸,𝐹𝑅 0.444 0.435 0.426 (1.035) 0.460 (1.032) 0.448 (1.032) 0.439 (1.100) 0.488 (1.093) 0.475 (1.094) 0.466 (1.199) 0.533 (1.186) 0.515 (1.189) 0.506 𝐿𝑇𝐶𝐼𝐷𝐸,𝐺𝐵 0.387 0.356 0.388 (1.039) 0.401 (1.039) 0.370 (1.035) 0.402 (1.114) 0.431 (1.115) 0.397 (1.102) 0.428 (1.228) 0.475 (1.231) 0.438 (1.205) 0.468 𝐿𝑇𝐶𝐼𝐷𝐸,𝐺𝑅 0.129 0.118 0.127 (1.079) 0.139 (1.081) 0.128 (1.074) 0.136 (1.241) 0.160 (1.247) 0.148 (1.230) 0.156 (1.481) 0.191 (1.495) 0.177 (1.459) 0.185 𝐿𝑇𝐶𝐼𝐷𝐸,𝐻𝑈 0.248 0.264 0.309 (1.069) 0.266 (1.061) 0.280 (1.054) 0.326 (1.213) 0.301 (1.186) 0.314 (1.165) 0.360 (1.426) 0.354 (1.372) 0.363 (1.329) 0.410 𝐿𝑇𝐶𝐼𝐷𝐸,𝑆𝐸 0.344 0.312 0.321 (1.046) 0.360 (1.047) 0.326 (1.047) 0.336 (1.139) 0.392 (1.143) 0.356 (1.140) 0.366 (1.277) 0.440 (1.286) 0.401 (1.280) 0.411 𝐿𝑇𝐶𝐼𝐹𝑅,𝐺𝐵 0.360 0.331 0.335 0.376 (1.044) 0.345 (1.045) 0.350 (1.044) 0.407 (1.130) 0.374 (1.131) 0.379 (1.129) 0.454 (1.260) 0.417 (1.261) 0.422 (1.258) 𝐿𝑇𝐶𝐼𝐹𝑅,𝐺𝑅 0.154 0.146 0.141 0.165 (1.070) 0.157 (1.072) 0.151 (1.070) 0.188 (1.216) 0.178 (1.220) 0.172 (1.217) 0.221 (1.432) 0.211 (1.441) 0.202 (1.434) 𝐿𝑇𝐶𝐼𝐹𝑅,𝐻𝑈 0.226 0.223 0.241 (1.063) 0.240 (1.066) 0.237 (1.062) 0.256 (1.192) 0.269 (1.195) 0.266 (1.185) 0.285 (1.383) 0.312 (1.346) 0.300 (1.369) 0.330 𝐿𝑇𝐶𝐼𝐹𝑅,𝑆𝐸 0.282 0.264 0.248 0.299 (1.060) 0.278 (1.056) 0.264 (1.064) 0.332 (1.177) 0.307 (1.165) 0.296 (1.191) 0.382 (1.353) 0.351 (1.331) 0.343 (1.381) 𝐿𝑇𝐶𝐼𝐺𝐵,𝐺𝑅 0.128 0.127 0.124 0.139 (1.086) 0.137 (1.075) 0.133 (1.073) 0.161 (1.265) 0.156 (1.228) 0.152 (1.226) 0.195 (1.530) 0.185 (1.456) 0.180 (1.451) 𝐿𝑇𝐶𝐼𝐺𝐵,𝐻𝑈 0.188 0.183 0.207 (1.078) 0.203 (1.077) 0.197) (1.069) 0.222 (1.241) 0.234 (1.233) 0.225 (1.208) 0.251 (1.483) 0.279 (1.467) 0.268 (1.416) 0.294 𝐿𝑇𝐶𝐼𝐺𝐵,𝑆𝐸 0.277 0.221 0.256 0.295 (1.062) 0.234 (1.058) 0.273 (1.066) 0.329 (1.186) 0.260 (1.176) 0.306 (1.196) 0.380 (1.371) 0.299 (1.353) 0.356 (1.392) 𝐿𝑇𝐶𝐼𝐺𝑅,𝐻𝑈 0.095 0.088 0.090 0.104 (1.095) 0.097 (1.101) 0.099 (1.106) 0.123 (1.294) 0.115 (1.309) 0.118 (1.320) 0.151 (1.588) 0.143 (1.619) 0.147 (1.640) 𝐿𝑇𝐶𝐼𝐺𝑅,𝑆𝐸 0.113 0.117 0.105 0.123 (1.086) 0.127 (1.084) 0.115 (1.096) 0.143 (1.266) 0.147 (1.254) 0.135 (1.290) 0.173 (1.532) 0.177 (1.508) 0.166 (1.581) 𝐿𝑇𝐶𝐼𝐻𝑈,𝑆𝐸 0.153 0.161 0.176 0.171 (1.116) 0.177 (1.103) 0.192 (1.089) 0.207 (1.350) 0.211 (1.313) 0.224 (1.272) 0.260 (1.699) 0.261 (1.626) 0.272 (1.545)
Notes: (i) 𝐸𝑖ℎ𝑚 is the strutural similarity index between exporting countries i and h for market m (accounting for
similarity in sectoral weights); (ii) 𝑆𝑖ℎ𝑚 is a trade competition index between exporting countries i and h for market m
that accounts for sectoral weights similarity and inter-sectoral similarity; (iii) The methodological options for 𝑆𝑖ℎ𝑚
indicators are: for 𝑆𝑖ℎ𝑚(1) we have (𝛼1, 𝛼2, 𝛼3) = (0.025; 0.075; 0.9); 𝑆𝑖ℎ𝑚(2) - (𝛼1, 𝛼2, 𝛼3) = (0.1; 0.15; 0.75);
𝑆𝑖ℎ𝑚(3) - (𝛼1, 𝛼2, 𝛼3) = (0.2; 0.3; 0.5); (iv) 𝐿𝑇𝐶𝐼𝑖ℎ is an overall trade competition index for the country pair i and h. In
this table, we have four different 𝐿𝑇𝐶𝐼𝑖ℎ for each country pair (i.e., 𝐿𝑖ℎ𝐸, 𝐿𝑆𝑖ℎ
(1)
, 𝐿𝑆𝑖ℎ
(2)
, 𝐿𝑆𝑖ℎ
(3)
); (v) Numbers between brackets are the ratios 𝐿𝑖ℎ𝑚
𝑇𝐶𝐼
𝐿𝐸𝑖ℎ𝑚. Bold is used for the country pair having the highest value of the ratio
𝐿𝑖ℎ𝑚𝑇𝐶𝐼
𝐿𝑖ℎ𝑚𝐸 and italics for the pair
31 TABLE 3
Trade Competition Indexes (Sectoral Shares Similarity, Inter-sectoral Similarity, and Intra-sectoral Similarity) 𝑇𝐶𝐼𝑖ℎ𝑚 𝐴𝑖ℎ𝑚 𝐶𝑖ℎ𝑚(1) 𝐶𝑖ℎ𝑚(2) 𝐶𝑖ℎ𝑚(3) 2007 2011 2015 2007 2011 2015 2007 2011 2015 2007 2011 2015 𝐿𝐷𝐸,𝐹𝑅𝑇𝐶𝐼 0.203 (0.457) 0.272 (0.626) 0.262 (0.615) 0.242 (0.546) 0.302 (0.695) 0.292 (0.685) 0.307 (0.692) 0.353 (0.813) 0.343 (0.805) 0.412 (0.928) 0.434 (0.999) 0.424 (0.996) 𝐿𝐷𝐸,𝐺𝐵𝑇𝐶𝐼 0.215 (0.557) 0.201 (0.564) 0.212 (0.545) 0.247 (0.640) 0.230 (0.647) 0.243 (0.625) 0.302 (0.782) 0.281 (0.788) 0.296 (0.762) 0.389 (1.007) 0.361 (1.012) 0.380 (0.978) 𝐿𝐷𝐸,𝐺𝑅𝑇𝐶𝐼 0.055 (0.424) 0.050 (0.419) 0.051 (0.404) 0.072 (0.561) 0.066 (0.558) 0.068 (0.538) 0.104 (0.809) 0.096 (0.812) 0.099 (0.783) 0.154 (1.193) 0.142 (1.204) 0.147 (1.161) 𝐿𝐷𝐸,𝐻𝑈𝑇𝐶𝐼 (0.513) 0.128 (0.534) 0.141 (0.532) 0.164 (0.631) 0.157 (0.641) 0.169 (0.633) 0.196 (0.848) 0.211 (0.836) 0.221 (0.814) 0.251 (1.182) 0.294 (1.139) 0.301 (1.0950.338 ) 𝐿𝐷𝐸,𝑆𝐸𝑇𝐶𝐼 (0.557) 0.192 (0.555) 0.173 (0.556) 0.178 (0.647) 0.223 (0.647) 0.202 (0.647) 0.208 (0.806) 0.277 (0.809) 0.252 (0.807) 0.259 (1.056) 0.363 (1.063) 0.331 (1.0580.339 ) 𝐿𝐹𝑅,𝐺𝐵𝑇𝐶𝐼 (0.397) 0.143 (0.515) 0.170 (0.498) 0.167 (0.502) 0.181 (0.609) 0.201 (0.592) 0.199 (0.678) 0.244 (0.767) 0.254 (0.752) 0.252 (0.959) 0.345 (1.019) 0.337 (1.0070.338 ) 𝐿𝐹𝑅,𝐺𝑅𝑇𝐶𝐼 0.054 (0.349) 0.068 (0.466) 0.060 (0.428) 0.075 (0.484) 0.086 (0.591) 0.078 (0.556) 0.112 (0.727) 0.120 (0.820) 0.111 (0.788) 0.171 (1.106) 0.172 (1.174) 0.162 (1.148) 𝐿𝐹𝑅,𝐻𝑈𝑇𝐶𝐼 0.071 (0.314) 0.112 (0.502) 0.116 (0.483) 0.101 (0.446) 0.138 (0.619) 0.144 (0.597) 0.153 (0.677) 0.184 (0.825) 0.192 (0.797) 0.235 (1.040) 0.248 (1.115) 0.268 (1.111) 𝐿𝐹𝑅,𝑆𝐸𝑇𝐶𝐼 0.108 (0.383) 0.130 (0.491) 0.118 (0.475) 0.142 (0.505) 0.158 (0.598) 0.147 (0.592) 0.201 (0.714) 0.207 (0.784) 0.198 (0.797) 0.295 (1.045) 0.284 (1.076) 0.278 (1.118) 𝐿𝐺𝐵,𝐺𝑅𝑇𝐶𝐼 (0.358) 0.046 (0.404) 0.051 (0.365) 0.045 (0.508) 0.065 (0.538) 0.069 (0.501) 0.062 (0.783) 0.100 (0.781) 0.099 (0.749) 0.093 (1.208) 0.154 (1.158) 0.147 (1.1340.140 ) 𝐿𝐺𝐵,𝐻𝑈𝑇𝐶𝐼 (0.412) 0.078 (0.426) 0.078 (0.414) 0.086 (0.548) 0.103 (0.560) 0.102 (0.542) 0.112 (0.800) 0.151 (0.803) 0.147 (0.769) 0.159 (1.188) 0.224 (1.180) 0.216 (1.1230.233 ) 𝐿𝐺𝐵,𝑆𝐸𝑇𝐶𝐼 (0.456) 0.126 (0.456) 0.101 (0.438) 0.112 (0.572) 0.159 (0.569) 0.126 (0.561) 0.143 (0.778) 0.216 (0.769) 0.170 (0.775) 0.198 (1.099) 0.305 (1.081) 0.239 (1.1110.284 ) 𝐿𝐺𝑅,𝐻𝑈𝑇𝐶𝐼 0.033 (0.343) 0.035 (0.400) 0.035 (0.395) 0.048 (0.503) 0.049 (0.561) 0.050 (0.561) 0.076 (0.801) 0.076 (0.859) 0.078 (0.867) 0.120 (1.259) 0.116 (1.319) 0.120 (1.338) 𝐿𝐺𝑅,𝑆𝐸𝑇𝐶𝐼 0.036 (0.318) 0.047 (0.401) 0.037 (0.352) 0.053 (0.472) 0.064 (0.545) 0.054 (0.512) 0.085 (0.755) 0.094 (0.804) 0.084 (0.804) 0.134 (1.191) 0.142 (1.208) 0.132 (1.256) 𝐿𝑇𝐶𝐼𝐻𝑈,𝑆𝐸 (0.378) 0.058 (0.403) 0.065 (0.389) 0.068 (0.556) 0.085 (0.566) 0.091 (0.539) 0.095 (0.883) 0.135 (0.865) 0.139 (0.814) 0.143 (1.388) 0.213 (1.327) 0.213 (1.239) 0.218
Notes: (i) 𝐴𝑖ℎ𝑚 is a trade competition index between exporting countries i and h for market m that accounts for
sectoral weights similarity and intra-sectoral similarity; (ii) 𝐶𝑖ℎ𝑚 is a trade competition index between exporting
countries i and h for market m that accounts for sectoral weights similarity, inter-sectoral similarity, and intra-sectoral similarity; (iii) The methodological options for the 𝐶𝑖ℎ𝑚 indicators are: for 𝐶𝑖ℎ𝑚(1) we have (𝛼1, 𝛼2, 𝛼3) =
(0.025; 0.075; 0.9); 𝐶𝑖ℎ𝑚(2) – (𝛼1, 𝛼2, 𝛼3) = (0.1; 0.15; 0.75); 𝐶𝑖ℎ𝑚(3) – (𝛼1, 𝛼2, 𝛼3) = (0.2; 0.3; 0.5); (iv) 𝐿𝑇𝐶𝐼𝑖ℎ is an
overall trade competition index for the country pair i and h. In this table, we have four different 𝐿𝑖ℎ𝑇𝐶𝐼 for each country
pair (i.e., 𝐿𝐴𝑖ℎ, 𝐿𝐶𝑖ℎ (1) , 𝐿𝑖ℎ𝐶 (2) , 𝐿𝐶𝑖ℎ (3)
); (v) Numbers between brackets are the ratios 𝐿𝑖ℎ𝑚
𝑇𝐶𝐼
𝐿𝑖ℎ𝑚𝐸 . Bold is used for the country pair
having the highest value of the ratio 𝐿𝑖ℎ𝑚
𝑇𝐶𝐼