Revista Brasileira de
Engenharia Agrícola e Ambiental
Campina Grande, PB, UAEA/UFCG – http://www.agriambi.com.br
v.22, n.1, p.32-37, 2018
Morphophysiology of guava under saline water irrigation
and nitrogen fertilization
DOI: http://dx.doi.org/10.1590/1807-1929/agriambi.v22n1p32-37
Idelfonso L. Bezerra
1, 4, Reginaldo G. Nobre
2, Hans R. Gheyi
3,
Leandro de P. Souza
4, Francisco W. A. Pinheiro
4& Geovani S. de Lima
4A B S T R A C T
The aim of this study was to evaluate the growth of grafted guava cv. ‘Paluma’ subjected to different concentrations of salts in irrigation water and nitrogen (N) fertilization. The plants were transplanted to 150 L lysimeters and under field conditions at the Science and Agri-food Technology Center of the Federal University of Campina Grande, in the municipality of Pombal - PB. The experiment was conducted in randomized block design in a 5 x 4 factorial scheme, with three replicates, and the treatments corresponded to five levels of electrical conductivity of irrigation water - ECw (0.3; 1.1; 1.9; 2.7 and 3.5 dS m-1) and four N doses (70, 100, 130 and 160% of the N dose recommended for the crop). The doses equivalent to 100% corresponded to 541.1 mg of N dm-3 of soil. Irrigation water salinity above 0.3 dS m-1 negatively affects the number of leaves, leaf area, stem diameter, dry phytomass of leaves, branches and shoots . A significant interaction between irrigation water salinity and N fertilization was observed only for the number of leaves and leaf area at 120 days after transplanting. N dose above 70% of the recommendation (378.7 mg N dm-3 soil) did not mitigate the deleterious effects caused by salt stress on plant growth.
Morfofisiologia da goiabeira sob irrigação
com águas salinas e adubação nitrogenada
R E S U M O
Objetivou-se, com esta pesquisa, avaliar o crescimento de plantas enxertadas de goiabeira cv. Paluma, submetidas a diferentes concentrações de sais na água de irrigação e doses de adubação nitrogenada, cujas plantas foram transplantadas em lisímetros de 150 L de capacidade e sob condições de campo do Centro de Ciências e Tecnologia Agroalimentar da Universidade Federal de Campina Grande, no município de Pombal - PB. Utilizou-se o delineamento experimental de blocos casualizados, em esquema fatorial 5 x 4, com três repetições, e duas plantas por lisímetro, sendo os tratamentos correspondentes a cinco níveis de condutividade elétrica da água de irrigação - CEa (0,3; 1,1; 1,9; 2,7 e 3,5 dS m-1) e quatro doses de nitrogênio (70, 100, 130 e 160% de N, da dose recomendada para a cultura). A dose referente a 100% de N correspondeu a 541,1 mg de N dm-3 do solo. A salinidade da água de irrigação acima de 0,3 dS m-1 afeta negativamente o número de folhas, a área foliar, o diâmetro de caule e a fitomassa seca da parte aérea de plantas de goiabeira cv. Paluma. Houve interação significativa entre a salinidade da água de irrigação e adubação nitrogenada apenas para o número de folhas e área foliar aos 120 dias após o transplantio. A dose de N acima de 70% da recomendação (378,7 mg N dm-3 do solo) não mitigou os efeitos deletérios ocasionados pelo estresse salino sobre o crescimento das plantas.
Key words:
Psidium guajava L.
electrical conductivity nitrogen
Palavras-chave:
Psidium guajava L.
condutividade elétrica nitrogênio
1 Fundação Universidade Federal de Rondônia/Departamento de Agronomia. Rolim de Moura, RO. E-mail: idelfonsobezerra@gmail.com
2 Universidade Federal de Campina Grande/Centro de Ciências e Tecnologia Agroalimentar/Unidade Acadêmica de Ciências Agrárias. Pombal, PB.
E-mail: rgomesnobre@yahoo.com.br
3 Universidade Federal do Recôncavo da Bahia/Centro de Ciências Agrárias, Ambientais e Biológicas/Núcleo de Engenharia de Água e Solo. Cruz das
Almas, BA. E-mail: hans@pq.cnpq.br
4 Universidade Federal de Campina Grande/Centro de Tecnologia e Recursos Naturais/Unidade Acadêmica de Engenharia Agrícola. Campina Grande,
PB. E-mail: engenheiropadua@hotmail.com, wesley.ce@hotmail.com, geovanisoareslima@gmail.com (Corresponding author)
Introduction
The Southeast and Northeast regions of Brazil stand out as the largest guava producers in the country, being respectively responsible for 47.4 and 39.9% of the national production, which was approximately 359.3 thousand tons of the fruit in a harvested area of 15.8 thousand hectares (IBGE, 2014).
Among the alternatives to reduce the harmful effects of salts from irrigation water and soil on plants, the application of mineral nitrogen (N) to the soil can mitigate salt stress (Lima et al., 2014), because it is one of the nutrients responsible for plant growth, especially because it directly participates in their metabolism, being a constituent of chlorophyll molecule, nucleic acids, amino acids and proteins. In addition, these organic compounds increase the osmotic adjustment capacity and tolerance of plants to salinity (Barhoumi et al., 2010; Chaves et al., 2011), and its efficient use has economic importance for the agricultural production systems (Fageria & Baligar, 2006).
In Brazil, studies evaluating the response of guava plants conducted at the field under saline water irrigation and N fertilization are scarce. According to Souza et al. (2016), in the formation of rootstock, guava under salt stress responds up to 773 mg of N dm-3 of soil. Hence, adequate management
of N fertilization can be an alternative to attenuate the effects of irrigation water salinity on this fruit crop.
Therefore, this study aimed to evaluate the growth of guava plants, cv. ‘Paluma’, subjected to different levels of irrigation water salinity and doses of N fertilization, to attenuate the deleterious effects caused by salt stress.
Material and Methods
The research was conducted under field conditions using drainage lysimeters from September 2015 to April 2016, at the Sciences and Agri-food Technology Center - CCTA of the Federal University of Campina Grande – UFCG, Pombal-PB, Brazil (6º 48’ 16’’ S; 37º 49’ 15’’ W; 144 m).
The experimental design was randomized blocks, in a 5 x 4 factorial scheme, corresponding to five levels of irrigation water salinity - ECw (0.3; 1.1; 1.9;2.7 and 3.5 dS m-1) and four
N doses (70, 100, 130 and 160% of N), with three replicates and two plants per plot. The dose relative to 100% corresponded to 541.1 mg of N dm-3, recommended for greenhouse experiments
(Souza et al., 2016).
The ECw levels were obtained by the dissolution of NaCl in water from the local supply system (ECw = 0.3 dS m-1) and the
quantity (C) was determined based on the empirical equation proposed by Rhoades et al. (2000): C (mg L-1) = 640 x ECw
(dS m-1), in which ECw represents the desired value of water
electrical conductivity, subtracting the EC value of the water. Prior to seedling transplantation, soil samples were collected in the layer of 0-20 cm and characterized according to the methodology described in Donagema et al. (2011): pH (water 1:2.5) = 7.41; ECse (dS m-1) = 1.21; P (mg dm-3) = 17;
Ca, Mg, Na, K (cmolc dm-3) = 5.4; 4.1; 2.21; 0.28, respectively;
organic matter (g kg-1) = 32; bulk density (kg dm-3) = 1.3; total
porosity (%) = 47. Cultivation practices consisted of hilling, scarification, pruning, staking and phytosanitary treatment.
Grafted guava seedlings, cv. ‘Paluma’, when they showed four pairs of true leaves, were transplanted to lysimeters with capacity for 150 L, with a hole at the bottom to allow free drainage. Lysimeters were filled using substrate composed of Fluvic Neosol + sand, at the proportion of 85 and 15%, respectively. The material, after placed in the lysimeters, was brought to field capacity using water with ECw of 0.3 dS m-1.
Treatments began to be applied 15 days after transplanting (DAT) and irrigations with salinized waters were performed, according to the treatment, based on plant water requirement, determined by the difference between the applied volume and the volume drained in the previous irrigation, estimated by the process of drainage lysimetry and maintaining soil moisture close to field capacity. Irrigations were applied twice a day, early morning and late afternoon. The water volume applied in the irrigation 40 DAT, was adjusted to promote a leaching fraction of 0.15 in the soil, as management to avoid excessive accumulation of salts.
Nitrogen fertilization started at 25 DAT, divided into 28 weekly applications: 1/5 of the dose was applied in the first eight weeks, because plants showed a root system that occupied small space in the lysimeter, using urea (45% N) as N source. Nitrogen was applied along with water of 0.3 dS m-1 for all
treatments.
At 60 DAT, branches were selected according to the size, vigor and health, and a pruning was performed to standardize the plants, leaving only three main branches per plant, which were responsible for forming the base of the crown.
The growth of grafted guava plants, cv. ‘Paluma’, was evaluated at 90, 120 and 150 DAT, based on number of leaves (NL), stem diameter (SD), leaf area (LA) and absolute (AGRSD)
and relative growth rates of stem diameter (RGRSD). Thus,
at 150 DAT, one plant was eliminated in each lysimeter, by cutting at the stem base and separating the different plant parts (leaves and branches), which were separately stored in properly identified paper bags and dried in a forced-air oven at 65 ºC until constant weight. After that, leaf dry phytomass (LDP), branch dry phytomass (BDP) and shoot dry phytomass (SDP) were determined.
Number of leaves was determined by counting the leaves, considering those with fully expanded leaf blade. Stem diameter (mm) was measured at height of 5 cm from the base of the plant. Leaf area was determined according to methodology proposed by Lima et al. (2012), using the equation LA(cm2) =
0.3205 x L2.0412, in which L is the midrib length, and the final
sum of the areas per leaf provides the total leaf area of the plant. The primary values of the variable stem diameter were used to calculate the absolute (AGRSD) and relative (RGRSD) growth rates (Benincasa, 2003). The equations used to calculate the different rates were: AGRSD = (SD2-SD1)/(t2 - t1) and RGRSD = (LnSD2 - LnSD1)/(t2 - t1), in which AGRSD - absolute growth rate of the stem (mm d-1), RGR
SD - relative growth rate of the
stem (mm mm-1 d-1), SD
1 - stem diameter (mm) at time t1, SD2
polynomial regression analysis was applied using the software SISVAR (Ferreira, 2011). For some parameters (NL, AGRSD and RGRSD), the original data needed to be transformed to √x, to
standardize the distribution.
Results and Discussion
There was significant effect of the levels of irrigation water salinity on the number of leaves (NL), stem diameter (SD) and leaf area (LA) at 90, 120 and 150 days after transplanting (DAT) (Table 1). For the factor N fertilization (ND), significant effect occurred on NL at 150 DAT, SD at 120 and 150 DAT and LA at 90 and 120 DAT. There was significant interaction between irrigation water salinity and N doses (S*ND) at 150 DAT for NL and LA. Still according to Table 1, the levels of irrigation water salinity and N doses had significant effect dry phytomass of branches (BDP), leaf (LDP) and shoot (SDP) at 150 DAT, at 0.01 and 0.05 probability levels, respectively.
The NL was linearly and negatively affected by ECw (Figure 1A), with relative reductions of 9.46 and 6.39% per unit increase of ECw, respectively, at 90 and 120 DAT, i.e., plants irrigated using water with ECw of 3.5 dS m-1 suffered
reductions in NL respectively of 31.18 and 20.85%, in relation to those subjected to 0.3 dS m-1. The highest percent losses of
leaves occurred in the youngest phase (90 DAT), which can be explained by the greater sensitivity of guava plants to salinity in the initial development stage. When plants are subjected to salt stress conditions, the occurrence of morphological and anatomical alterations is common, which reflect in reduction of transpiration due to the low water absorption caused by salinity; one of these adaptations is the reduction in the number of leaves (Oliveira et al., 2013).
There was effect of the interaction between factors (S*ND) at 150 DAT on NL (Figure 1B), a decreasing linear effect on plants fertilized with 70, 100, 130 and 160% of N, respectively equal to 7.31, 17.38, 10.46 and 6.53%, per unit increase in ECw. Maximum NL of 262.0 was obtained at the salinity level of 0.3 dS m-1 and lowest N dose. The lowest NL was 107.46,
obtained in the combination between the highest salinity level (3.5 dS m-1) and N dose of 100%. However, it can be inferred
that the increase in N doses may have incremented the saline effect.
For SD, irrigation water salinity had decreasing linear effect (Figure 1C) and its relative reductions, per unit increase in ECw,
were 6.80, 7.34 and 7.44%, at 90, 120 and 150 DAT, respectively. Irrigation water salinity negatively affects plant growth, due to the osmotic and specific effects of the ions, retarding cell expansion and division, promoting negative consequences on photosynthetic rate and damaging physiological and biochemical processes of the plants (Gomes et al., 2011; Nunes et al., 2012). As a result, it leads to a reduction in SD, which may have occurred in the present study because of these factors.
N fertilization doses caused decrease in SD as the applied N percentage increased (Figure 1D), leading to relative reductions of 4.51 and 3.11% at 120 and 150 DAT, for every 30% increment in the N dose. Plants subjected to the 160% dose suffered reductions of 15.15 and 10.06% in relation to those under the 70% dose, respectively at 120 and 150 DAT. These results are similar to those reported by Silva et al. (2017), who observed SD reductions in guava seedlings, cv. ‘Paluma’, at 130 and 190 days after emergence, with linear losses of 12.24 and 17.9%, respectively, in plants that received the dose of 1236.8 mg dm-3
of N (160%), in relation to those fertilized with 541.1 mg dm-3
(70%).
The increase in irrigation water salinity linearly and negatively (Figure 1E) affected LA, at 90 and 120 DAT, with relative reductions of 15.18 and 15.09%, respectively, per unit increase in ECw. According to Travassos et al. (2012), such decrement is related to the accumulation of salts in the soil at high levels (NaCl concentration), which negatively affects water absorption by plants, a determinant factor for photosynthetic and metabolic processes, causing reduction in LA.
LA was also reduced by the increment in N doses (Figure 1F), with relative reductions of 3.03 and 7.63% at 90 and 120 DAT, respectively, for every 30% increment in N dose. In the evaluation at 120 DAT, based on the regression equation (Figure 1F), there was a decreasing linear effect on LA, with reduction on the order of 0.126 m2 in plants cultivated at
160% N dose, compared with those at 70% N. The expressive reduction in LA at 120 DAT, under saline conditions, may have been due to the decrease of N absorption by plants, partially caused by the antagonistic effect between nitrate and chloride ions (Abd El-Samad & Shaddad, 2000).
Figure 1G shows the effect of salinity on LA at 150 DAT, for each N dose, and it is possible to note that the data fitted best to decreasing linear equations. However, despite showing the same trend, the reduction in LA due to the increase in irrigation water salinity beyond 1.9 dS m-1 was higher in plants
nsNot significant; *Significant at 0.05; **Significant at 0.10; 1Statistical analysis made after data transformation to √x
Source of variation DF
F Test
NL – DAT SD – DAT LA – DAT BDP LDP SDP
90 1201 150 90 120 150 90 120 150 150 DAT
Salinity (S) 4 ** * ** ** ** ** ** ** ** ** ** **
Linear Reg. 1 ** * ** ** ** ** ** ** ** ** ** **
Quadratic Reg. 1 ns ns ns ** ns * ns * ns ns ns ns
N dose (ND) 3 ns ns ** ns ** * * * ns * * *
Linear Reg. 1 ns ns ** ** ** * ** ** ns * * **
Quadratic Reg. 1 ns ns ns ** ** ns ns ns ns ns ns ns
Interaction (S*ND) 12 ns ns * ns ns ns ns ns ** ns ns ns
Block 2 ** ns * ns ns ns ** ns ** * ns ns
CV (%) - 18.0 16.5 15.1 7.2 9.0 9.7 8.8 21.0 11.6 12.8 18.8 12.4
Figure 1. Number of leaves (NL), stem diameter (SD) and leaf area (LA) of grafted guava plants, cv. ‘Paluma’, as a function of irrigation water salinity - ECw (A, C, E) at 90, 120 and 150 (DAT) and nitrogen doses (D, F) at 90, 120 and 150 DAT, and of the interaction between irrigation water salinity and nitrogen doses (B, G), at 150 DAT
y(90 DAT)= 79.563-7.5333**x; R² = 0.96
y(120 DAT)= 142.87-9.1333*x; R² = 0.98
0 50 100 150
0.3 1.1 1.9 2.7 3.5
Number of leaves
ECw (dS m-1)
90 DAT 120 DAT
A.
yN1(70%)= 267.88-19.584*x ; R² = 0.78
yN2(100%)= 274.59- 47.75**x ; R² = 0.95
yN3(130%)= 220.52-23.083**x ; R² = 0.88
yN4(160%)= 168.23-11**x ; R² = 0.88
0 100 200 300
0.3 1.1 1.9 2.7 3.5
Number of leaves
ECw (dS m-1)
N1 N2 N3 N4
B. 150 DAT
y(90 DAT)= 8.5547-0.5825**x; R² = 0.84 y(120 DAT)= 10.91-0.8012**x; R² = 0.96 y(150 DAT)= 15.437-1.15**x; R² = 0.91
0 3 6 9 12 15 18
0.3 1.1 1.9 2.7 3.5
Stem diameter (mm)
ECw (dS m-1)
90 DAT 120 DAT 150 DAT
C.
y(120 DAT)= 11.354-0.0171**x; R² = 0.96 y(150 DAT)= 15.044-0.0156*x; R² = 0.86
0 3 6 9 12 15 18
70 100 130 160
Stem diameter (mm)
% recommended N dose
120 DAT 150 DAT
D.
y(90 DAT)= 0.2516-0.0382**x; R² = 0.99
y(120 DAT)= 0.5519-0.0833**x; R² = 0.90
0.00 0.20 0.40 0.60
0.3 1.1 1.9 2.7 3.5
Leaf area (m
2)
ECw (dS m-1)
90 DAT 120 DAT
E.
y(90 DAT)= 0.198-0.0002**x; R² = 0.84 y(120 DAT)= 0.5499-0.0014**x; R² = 0.94
0.00 0.20 0.40 0.60
70 100 130 160
Leaf area (m
2)
% recommended N dose
90 DAT 120 DAT
F.
yN1(70%)= 1.4321-0.2227**x; R² = 0.97
yN2(100%)= 1.2375-0.1424**x; R² = 0.84
yN3(130%)= 1.369-0.2126**x; R² = 0.93
yN4(160%)= 1.5066-0.2886**x; R² = 0.94
0.00 0.60 1.20 1.80
0.3 1.1 1.9 2.7 3.5
Leaf area (m
2)
ECw (dS m-1)
N1 N2 N3 N4
G. 150
DAT
that received the 160% N dose. The reductions per unit increase in ECw in plants subjected to N fertilization of 70, 100, 130 and 160% were 15.55, 11.50, 15.53 and 19.15%, respectively.
y(BDP)= 276.41-41.111**x; R² = 0.98
y(LDP)= 364.88-46.011**x; R² = 0.93
y(SDP)= 641.18-87.095**x; R² = 0.98
0 100 200 300 400 500 600
0.3 1.1 1.9 2.7 3.5
Phytomass (g)
ECw (dS m-1)
BDP LDP SDP
A.
y(BDP)= 233.93-0.3099*x; R² = 0.97
y(LDP)= 345.63-0.5928*x; R² = 0.89
y(SDP)= 576.13-0.8733**x; R² = 0.95
0 100 200 300 400 500 600
70 100 130 160
Phytomass (g)
% recommended N dose
SDP LDP BDP
B.
Figure 2. Dry phytomass of branches (BDP), leaves (LDP) and shoots (SDP) of grafted guava plants, cv. ‘Paluma’, as a function of irrigation water salinity - ECw (A) and nitrogen doses (B) at 150 days after transplanting
y(90-120 DAT)= 0.1079-0.0004*x
R² = 0.68
0.00 0.03 0.06 0.09
AGR
SD
(mm d
-1) A.
y(90-120 DAT)= 0.0129-5E-05*x
R² = 0.89
0.000 0.005 0.010 0.015
70 100 130 160
RGR
SD
(mm mm
-1
d
-1)
% recommended N dose B.
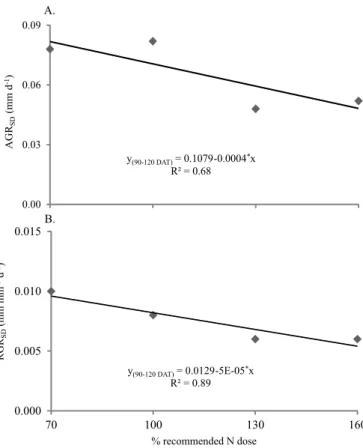
Figure 3. Absolute (AGRSD) and relative (RGRSD) growth rates in stem diameter of grafted guava plants, cv. ‘Paluma’, as a function of nitrogen doses in the period of 90-120 days after transplanting (DAT)
in the substrate, or even rapidly increase the concentration of the ammonium ion in the soil, causing a toxic effect on the plant and thus leading to physiological disorders, which compromise cell division and reduces leaf area growth (Caproni et al., 2013).
According to Figure 2A, the decreasing linear response of BDP, estimated by the regression model, was 14.87% per unit increase in ECw, i.e., reduction of 49.81% (131.55 g plant-1)
when plants were under ECw of 3.5 dS m-1, compared with
those subjected to 0.3 dS m-1. For LDP (Figure 2A), there was a
negative linear effect of ECw, with relative reduction of 12.61% per unit increase in ECw. SDP was significantly and linearly reduced by the increment in salinity (Figure 2A), with relative reduction per unit increase in ECw of 13.58%. The reduction in SDP was due to the lower number of leaves, leaf area and stem diameter of the plants, as previously explained. Similar effects of salinity were also reported in guava rootstocks, cv. ‘Paluma’, by Souza et al. (2016).
Regarding N fertilization, it is noted that the increase in N dose tends to reduce BDP (Figure 2B), with relative reduction of 3.97% for every 30% increment in N dose. This occurred in plants subjected to 160% N dose, leading to decrease of 13.14% (27.89 g plant-1), in comparison to those under fertilization
with 70% N. In addition, there was linear and negative effect on LDP (Figure 2B) caused by N fertilization, with relative reduction of 5.14% for every 30% increment in N dose. The reduction in LDP at N dose of 160% in relation to the dose of 70% was equal to 17.54% (53.35 g plant-1). For SDP (Figure
2B), there was also a decreasing linear effect of N fertilization, showing relative reduction of 4.54% for every 30% increment
in N dose, i.e., reduction of 15.26% in SDP at the N dose of 160%, in comparison to the dose of 70%. The increase of salinity in the soil saturation extract caused by this fertilizer, which has saline index of 75% (Alcarde et al., 2007), may have contributed to the reduction of the osmotic potential close to the rhizosphere, which tended to compromise the absorption of water and nutrients by guava plants.
According to Table 2, the absolute (AGRSD) and relative
(RGRSD) growth rates in stem diameter were significantly affected only by the N dose in the period of 90-120 DAT.
According to the regression equations (Figure 3A, B), AGRSD and RGRSD decreased with the increment in N dose only in the period of 90-120 DAT, regardless of the electrical
nsNot significant; *Significant at 0.05; 1Statistical analysis conducted after data transformation to √x
Source
of variation DF
F test
AGRSD(DAT) RGRSD(DAT)
(60-90)1 (90-120)1 (60-90)1 (90-120)1
Salinity (S) 4 ns ns ns ns
Linear Reg. 1 ns ns ns ns
Quadratic Reg. 1 ns ns ns ns
N dose (ND) 3 ns * ns *
Linear Reg. 1 ns * ns *
Quadratic Reg. 1 ns ns ns ns
Interaction (S*ND) 12 ns ns ns ns
Block 2 ns ns ns ns
CV (%) - 26.94 22.26 26.44 21.10
conductivity of the irrigation water, and showed linear reductions of 11.12 and 11.62%, respectively, for every 30% increment in N dose. The natural dynamics of N and its loss in the soil-plant system create a unique challenge for its correct management, because high N contents may cause nutritional imbalance in the soil and, consequently, affect crop growth and production (Oliveira et al., 2009).
Conclusions
1. The increase in water salinity from 0.3 dS m-1 significantly
reduces the number of leaves, leaf area, stem diameter, dry phytomass of leaves, branches and shoots at 90, 120 and 150 days after transplanting.
2. The use of N dose above 378.7 mg of N dm-3 of soil does
not mitigate the effects of salinity on the guava cv. ‘Paluma’. 3. Absolute and relative growth rates in stem diameter were negatively affected by the increase in N doses.
4. The cultivar ‘Paluma’ responds to the interaction of irrigation water salinity x N fertilization doses for the number of leaves and leaf area at 150 days after transplanting.
Literature Cited
Abd El-Samad, H. M.; Shaddad, M. A. K. Comparative effect of sodium carbonate, sodium sulphate, and sodium chloride on the growth and related metabolic activities of plants. Journal of Plant Nutrition, v.19, p.717-728, 2000. https://doi. org/10.1080/01904169609365155
Alcarde, J. C. Fertilizantes. In: Novais, R. F.; Alvarez V., V. H.; Barros, N. F. de; Fontes, R. L. F.; Cantarutti, R. B.; Lima, J. C. Fertilidade do solo. 1.ed. Viçosa: SBCS, 2007. Cap.12, p.737-768.
Barhoumi, Z.; Atia, A.; Rabhi, M.; Djebali, W.; Abdelly, C.; Smaoui, A. Nitrogen and NaCl salinity effects on the growth and nutrient acquisition of the grasses Aeluropus littoralis, Catapodium rigidum, and Brachypodium distachyum. Journal of Plant Nutrition and Soil
Science, v.173, p.149-157, 2010. https://doi.org/10.1002/jpln.200800113 Benincasa, M. M. P. Análise de crescimento de plantas. Jaboticabal:
FUNEP, 2003. 42p.
Caproni, C. M.; Ramos, D. J.; Vieira Neto, J.; Silva, L. F. de O. da; Simões, J. C.; Pereira, W. R. Substratos e adubação nitrogenada na produção de mudas de maracujazeiro amarelo. Scientia Agraria, v.14, p.69-75, 2013. https://doi.org/10.5380/rsa.v14i2.40932 Chaves, L. H. G.; Gheyi, H. R.; Ribeiro, S. Consumo de água e eficiência
do uso para cultivar de mamona Paraguaçu submetida à fertilização nitrogenada. Engenharia Ambiental, v.8, p.126-133, 2011. Donagema, G. K.; Campos, D. V. B. de; Calderano, S. B.; Teixeira,
W. G.; Viana, J. H. M. (org.). Manual de métodos de análise de solos. 2.ed. rev. Rio de Janeiro: Embrapa Solos, 2011. 230p. Documento, 132
Fageria, N. K.; Baligar, V. C. Enchancing nitrogen use efficiency in crop plants. Advances in Agronomy, v.88, p.97-185, 2006. https:// doi.org/10.1016/S0065-2113(05)88004-6
Ferreira, D. F. Sisvar: Um sistema computacional de análise estatística. Ciência e Agrotecnologia, v.35, p.1039-1042, 2011. https://doi. org/10.1590/S1413-70542011000600001
Gomes, K. R.; Amorim, A. V.; Ferreira, F. J.; Andrade Filho, F. L.; Lacerda, C. F. de; Gomes Filho, E. Respostas de crescimento e fisiologia do milho submetido a estresse salino com diferentes espaçamentos de cultivo. Revista Brasileira de Engenharia Agrícola e Ambiental, v.15, p.365-370, 2011. https://doi. org/10.1590/S1415-43662011000400006
IBGE - Instituto Brasileiro de Geografia e Estatística. Produção agrícola municipal. Rio de Janeiro: IBGE, 2014.101p.
Lima, G. S. de; Nobre, R. G.; Gheyi, H. R.; Soares, L. A. dos A.; Silva, A. O. da. Crescimento e componentes de produção da mamoneira sob estresse salino e adubação nitrogenada. Engenharia Agrícola, v.34, p.854-866, 2014. https://doi.org/10.1590/S0100-69162014000500005
Lima, L. G. S.; Andrade, A. C. de; Silva, R. T. L. da; Fronza, D.; Nishijima, T. Modelos matemáticos para estimativa de área foliar de goiabeira (Psidium guajava L.). In: Reunião Anual da SBPC, 64, 2012, São Luiz. Anais... São Luiz: UFMA, 2012. CD-Rom. Nunes, J. C.; Cavalcante, L. F.; Lima Neto, A. J. de; Rebequi, A. M.;
Diniz, B. L. M. T.; Gheyi, H. R. Comportamento de mudas de nim à salinidade da água em solo não salino com biofertilizante. Revista Brasileira de Engenharia Agrícola e Ambiental, v.16, p.1152-1158, 2012. https://doi.org/10.1590/S1415-43662012001100002 Oliveira, F. de A. de; Medeiros, J. F. de; Oliveira, M. K. T. de; Souza,
A. A. T.; Ferreira, J. A.; Souza, M. S. Interação entre salinidade e bioestimulante na cultura do feijão caupi. Revista Brasileira de Engenharia Agrícola e Ambiental, v.17, p.465-471, 2013. https:// doi.org/10.1590/S1415-43662013000500001
Oliveira, F. de A. de; Oliveira Filho, A. F. de; Medeiros, J. F. de; Almeida Junior, A. B. de; Linhares, P. C. F. Desenvolvimento inicial da mamoneira sob diferentes fontes e doses de matéria orgânica. Revista Caatinga,v.22, p.206-211, 2009.
Rhoades, J. D.; Kandiah, A.; Mashali, A. M. Uso de águas salinas para produção agrícola. Campina Grande: UFPB, 2000. 117p. Estudos FAO - Irrigação e Drenagem, 48
Silva, E. M. da; Nobre, R. G.; Souza, L. de P.; Araújo, R. H. C. R.; Pinheiro, F. W. A.; Almeida, L. L de S. Morfisiologia de porta-enxerto de goiabeira irrigado com águas salinizadas sob doses de nitrogênio. Comunicata Scientiae, v.8, p.32-42, 2017. https:// doi.org/10.14295/cs.v8i1.1547
Souza, L. de P.; Nobre, R. G.; Silva, E. M. da; Lima, G. S. de; Pinheiro, F. W. A.; Almeida, L. L. de S. Formation of ‘Crioula’ guava rootstock under saline water irrigation and nitrogen doses. Revista Brasileira de Engenharia Agrícola e Ambiental, v.20, p.739-745, 2016. https://doi.org/10.1590/1807-1929/agriambi.v20n8p739-745 Travassos, K. D.; Gheyi, H. R.; Soares, F. A. L.; Barros, H. M. M;