Revista Brasileira de
Engenharia Agrícola e Ambiental
Campina Grande, PB, UAEA/UFCG – http://www.agriambi.com.br
v.22, n.3, p.170-175, 2018
Growth and yield of sugarcane irrigated
with brackish water and leaching fractions
DOI: http://dx.doi.org/10.1590/1807-1929/agriambi.v22n3p170-175
Raquele M. de Lira
1, Ênio F. de F. e Silva
1, Djalma E. Simões Neto
2,
José A. Santos Júnior
1, Breno L. de C. Lima
1& Jucicléia S. da Silva
3A B S T R A C T
The objective was to evaluate the growth and yield of sugarcane irrigated with brackish water and leaching fractions. A completely randomized experimental design was used, in a 5 x 2 factorial scheme, with four replicates. The treatments consisted of five irrigation water salinity levels (0.5, 2.0, 3.5, 5.0 and 6.5 dS m-1) and two leaching fractions (0 and 0.17), corresponding to 100 and 120% of the crop evapotranspiration. The irrigation management was performed daily. Irrigation water salinity levels were obtained by adding NaCl and CaCl2 to the public-supply water, in order to obtain a molar ratio between Na:Ca of 1:1. The following measurements were taken: height and stem diameter; number of tillers; number of leaves and leaf area with monthly frequency between 60 and 300 days after planting (DAP). It was concluded that irrigation water salinity negatively influenced the variables of growth and yield in the sugarcane, and the leaching fraction of 0.17 was capable of reducing the deleterious effects of the salts on the plants.
Crescimento e rendimento da cana-de-açúcar irrigada
com águas salobras e frações de lixiviação
R E S U M O
Objetivou-se avaliar o crescimento e o rendimento da cana-de-açúcar irrigada com águas salobras e frações de lixiviação. Adotou-se delineamento experimental inteiramente casualizado, em esquema fatorial 5 x 2, com quatro repetições. Os tratamentos consistiram de cinco níveis de salinidade da água de irrigação (0,5; 2,0; 3,5; 5,0 e 6,5 dS m-1) e duas frações de lixiviação (0 e 0,17), correspondendo a 100 e 120% da evapotranspiração da cultura. O manejo da irrigação foi realizado diariamente. Os níveis de salinidade da água de irrigação
foram obtidos pela adição de NaCl e CaCl2 à água de abastecimento, de modo a se obter
proporção molar entre Na:Ca de 1:1. Realizou-se medidas de altura e diâmetro de colmo, do número de perfilhos, do número de folhas e da área foliar com periodicidade mensal entre os 60 e 300 dias após o plantio (DAP). A produtividade e a massa seca de colmo foram determinadas aos 300 DAP. Concluiu-se que a salinidade da água de irrigação influenciou de maneira negativa as variáveis de crescimento e rendimento na cana-de-açúcar, sendo a fração de lixiviação de 0,17 capaz de reduzir os efeitos deletérios dos sais sobre as plantas.
Key words:
Saccharum spp.
salt management irrigation lysimeters
Palavras-chave:
Saccharum spp.
manejo de sais irrigação lisímetros
1 Universidade Federal Rural de Pernambuco/Departamento de Engenharia Agrícola/Programa de Pós-Graduação em Engenharia Agrícola. Recife,
PE. E-mail: raquelelira@gmail.com (Corresponding author) - ORCID: 0000-0002-9035-7788; enio.fsilva@ufrpe.br - ORCID: 0000-0002-8652-503X; eng.amiltonjr@hotmail.com - ORCID: 0000-0002-1656-7103; breno.lclima@gmail.com - ORCID: 0000-0001-7630-0542
2 Universidade Federal Rural de Pernambuco/Estação Experimental de Cana-de-Açúcar do Carpina. Carpina, PE. E-mail: desn@oi.com.br - ORCID:
0000-0002-2071-5674
3 Universidade Federal do Recôncavo da Bahia/Núcleo de Engenharia de Água e Solo. Cruz das Almas, BA. E-mail: jucicleiass@gmail.com - ORCID:
0000-0003-3409-0326
Introduction
The practice of irrigation in agriculture increases food production, but the quality of the waters used, especially those of lower quality, such as saline waters, compromises crop growth and development (Silva et al., 2011).
Salt accumulation in soils occurs when the quantity of salts accumulated due to irrigation water is higher than the quantity removed by the drainage water (Armas et al., 2010). Crop tolerance to salinity is not only related to the quantity and type of salts, but also to plant genetics, as well as to external factors such as climate, nutritional availability in the soil, irrigation management and others.
Sugarcane is a crop moderately sensitive to salts and, according to Maas & Hoffmam (1977), has a salinity threshold of 1.7 dS m-1. In Pernambuco, its production occurs usually in coastal areas where soil salinization problems are commonly observed, due to the intrusion of seawater, which mixes with fresh waters, making them brackish or saline. Based on this context, it is necessary to study techniques aiming at the inclusion of this type of water in the production chain, to reduce the effects caused by salts on this crop. These techniques include the use of leaching fractions, which promote the displacement of salts to soil depths below the root zone, allowing good yield of the crops.
Knowing the importance of sugarcane for Brazil (largest global producer) and for Pernambuco, which occupies the 7th place in the country (CONAB, 2016), and considering that the literature is scarce in studies on sugarcane and salinity, which are usually conducted outside Brazil and with cultivars not used in the country (García & Medina, 2010; Nadian et al., 2012), the objective was to evaluate growth and yield of sugarcane irrigated with brackish water under leaching fractions.
Material and Methods
The experiment was carried out at the Lysimetric Station of Irrigated Agriculture Prof. Ronaldo Freire de Moura, located in the Agricultural Engineering Department (DEAGRI), of the Federal Rural University of Pernambuco (UFRPE), Campus Recife (8° 01’ 05” S; 34° 56’ 48” W; 6.5 m).
Climatic data to estimate daily reference evapotranspiration (ETo) were obtained using an automatic weather station (Campbell Scientific, CR1000/CFM100/OS100), situated in the area.
The soil material used in the lysimeters came from the 0-0.4 m layer of an Spodosol, whose physical-chemical characteristics determined according to the methodology of EMBRAPA (2009, 2011) are: coarse sand = 640 g kg-1, fine sand = 250 g kg-1, silt = 30 g kg-1,clay = 80 g kg-1, textural class = sand, soil density = 1.80 g cm-3, particle density = 2.63 kg dm-3, clay dispersed in water = 0%, flocculation degree = 100%, mopisture0.33atm = 3.02%, moisture15atm = 1.34%, available water = 1.68%, organic matter = 20.39 g kg-1,pH
(H2O) = 5, P = 5 mg dm
-3, K+ = 0.02 cmol c dm
-3, Ca2+ = 0.30 cmol
c dm
-3, Mg2+ = 0.40 cmol c dm
-3, Na+ = 0.11 cmol c dm
-3, Al3+ = 0.75 cmol
c dm
-3, cation exchange capacity
effective = 1.58 cmolc dm-3, sum of bases = 0.83 cmol
c dm -3.
Soil pH was corrected using dolomitic limestone, and basal mineral fertilization with N, P and K was performed by applying 20, 200 and 50 kg ha-1 of N, P
2O5 and KCl, respectively, in the forms of urea, single superphosphate and potassium chloride. At 45 DAP, top-dressing fertilization was performed using 50 and 50 kg ha-1 of N and KCl, respectively, and, at 104 DAP, a second top-dressing with 50 and 80 kg ha-1 of N and KCl, manually.
Planting was performed on August 2, 2014, using six setts with two buds per lysimeter (linear meter) and in the interrows (borders) with the variety RB 867515.
Treatments consisted in the combination of five levels of water electrical conductivity (ECw): T1 = 0.5; T2 = 2.0; T3 = 3.5; T4 = 5.0 and T5 = 6.5 dS m-1 and two leaching fractions (0 and 0.17) corresponding to 100 and 120% of crop evapotranspiration (ETc), respectively. The experimental design was completely randomized, in 5 x 2 factorial scheme, with four replicates, totaling 40 experimental plots, and each one was composed of one 1-m3 drainage lysimeter, equidistant of 1.2 m. The drainage system of each lysimeter remained open all the time, so that the free water percolated or evaporated from the system.
Salinity levels were established by adding NaCl and CaCl2 at molar proportion of 1:1 (Ca:Na), respectively, to the UFRPE’s supply water (EC = 0.5 dS m-1). For the control (T
1), only water from the local supply was used, without the addition of salts. A drip irrigation system was used, with four pressure-compensating drippers per lysimeter, spaced by 0.30 m, with mean flow rate assessed in the field of 4.2 L h-1 per emitter.
At 60 DAP, treatments started to be applied and irrigation was daily performed based on ETc, calculated by multiplying reference evapotranspiration (ETo) by the crop coefficient (kc). ETo was obtained according to the climatic data of the weather station, which provided the result using the Penman-Monteith equation. The kc used was a dimensionless value corresponding to the phenological stage at which the plant was, according to the United Nations Food and Agriculture Organization – FAO. On days in which rainfall was equal to or higher than ETc, there was no irrigation. At 285 DAP, the last irrigation was applied in the experiment, and harvest was performed on July 28, 2015 (360 DAP).
Number of tillers (NT), stem diameter (SD), stem height (SH), number of leaves (NL) and leaf area (LA) were monthly evaluated from 60 to 300 DAP.
NT determination corresponded to the total number of plants in each lysimeter (linear meter). The other evaluations were performed in three previously marked plants, obtaining a mean value. For SD determination, three measurements were taken at 1/3 of stem height, from the base, using a caliper. SH was determined using a metal tape measure, considering the distance from soil surface to the +1 leaf. For NL, only green leaves were considered (fully expanded with minimum green area of 20%, counted from the +1 leaf). LA was determined by measuring the length and width in the middle portion of the +3 leaf and counting the number of leaves, applying the equation proposed by Hermann & Câmara (1999).
was ground to forage and dried in forced-air oven at 65 °C until constant weight, to determine the stem dry weight (SDW).
Growth data were subjected to multivariate analysis of variance with measurements repeated over time (Mauchly’s criterion significant at 0.01 probability level) and treatment means fitted to multiple regression model (response surface), considering time (DAP) and salinity (S) as independent variables. For yield means, univariate statistics was used (p < 0.05).
Results and Discussion
The multivariate analysis applied to all growth variables evidenced significant difference (p < 0.01) for the vectors of treatment means, according to the tests of Hotelling-Lawley, Pillai, Wilks and Roy, for the effect of time, interaction of time x salinity and interaction of time x irrigation depth, the latter of which was not significant for SH. On the other hand, for the interactions of time x salinity x irrigation depth, significant difference was observed for all growth variables only in the
Roy test, except for SH, which did not show difference in any of the tests.
Response surfaces for sugarcane leaf area (LA) and number of leaves (NL) as a function of irrigation water salinity levels and days after planting are respectively presented in Figure 1A and C for the leaching fraction of 0 and in Figures 1B and D for the leaching fraction of 0.17.
According to the partial derivative applied to the LA equation with respect to time, the optimum DAP occurred at 268 days for the leaching fraction of 0 (Figure 1A) and at 267 days for the leaching fraction of 0.17 (Figure 1B). Subsequently, there was a trend of reduction in LA regardless of the leaching fraction used until 300 DAP.
Maximum LA was 6529.8 and 7466.05 cm² using the leaching fractions of 0 and 0.17, respectively, for the lowest salinity level (T1 = 0.5 dS m-1) because, as irrigation water salinity increased, LA decreased at both leaching fractions. Reductions of 32.33 and 29.6% were found using leaching fractions of 0 and 0.17, respectively, in the comparison between the control T1 and the highest salinity level (T5 = 6.5 dS m-1).
Figure 1. Response surface of leaf area (LA) and number of leaves (NL) as a function of irrigation water salinity levels and days after planting for leaching fractions of 0 (A and C) and 0.17 (B and D)
pl - plant Number of leaves pl
-1
Number of leaves pl
In this experiment, saline stress caused a rapid and severe reduction in leaf growth. Willadino & Camara (2010) explain that decrease in leaf elongation speed due to salts results in a reduction in the number of cells undergoing elongation, in the elongation rate of these cells, or in both. In a study with irrigation water salinity of 1, 2, 4 and 8 dS m-1 and different N doses applied from 90 to 180 DAP, Nadian et al. (2012) estimated reduction in the leaf area of sugarcane, cultivar CP69-1062, as irrigation water salinity increased and N dose decreased. When the leaching fraction of 0.17 was used in the present experiment, the effects of salinity were attenuated in comparison to the leaching fraction of 0, due to a higher dissolution of salts and, consequently, lower investment of energy for absorption of water and nutrients, which led to greater leaf growth.
For NL, the partial derivative calculated with respect to time led to minimum DAP at 150 days for the leaching fraction of 0 (Figure 1C) and at 121 days for the leaching fraction of 0.17 (Figure 1D). From these points on, the NL increased until the last day of analysis (300 DAP). Minimum NL was 4.6 and 5.5
for the leaching fractions of 0 and 0.17, respectively, in T5 (6.5 dS m-1) because, as irrigation water salinity increased, NL decreased at both leaching fractions.
In a study with two sugarcane genotypes (PR692176 and V78-1), García & Medina (2010) evaluated the use of NaCl in the irrigation water from 60 to 120 DAP and observed significant decrease in the number of leaves for both cultivars, with more expressive result in the most sensitive cultivar (V78-1).
The leaching fraction of 0.17 may have promoted higher NL because plants under saline stress tend to exhibit difficult water absorption and, due to the lack of water, emerging leaves tend to accumulate in the center of the plant; hence, with greater amount of water in the soil, this effect was minimized.
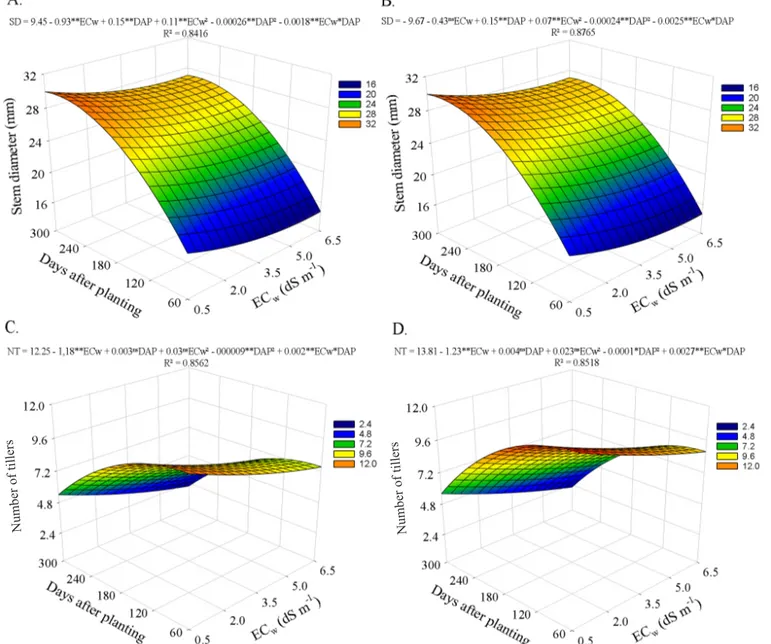
Response surfaces for stem diameter (SD) and number of tillers (NT) as a function of irrigation water salinity levels and days after planting are respectively presented in Figures 2A and C for the leaching fraction of 0 and in Figures 2B and D for the leaching fraction of 0.17.
Stem diameter increased along the days and decreased in response to the increment in water salinity. When leaching
Figure 2. Response surface of stem diameter (SD) and number of tillers (NT) as a function of irrigation water salinity levels and days after planting for the leaching fractions of 0 (A and C) and 0.17 (B and D)
fraction of 0 was used, lower values of SD were found (Figure 2A), compared with the leaching fraction of 0.17 (Figure 2B). The combination of the studied saline levels and the days after planting showed that the highest SD value was found at 288 and 300 days for the leaching fractions of 0 and 0.17, respectively, with 0.5 dS m-1, estimated at almost 33 mm for both fractions. At T5 = 6.5 dS m-1, the values were 25.8 and 29 mm with the leaching fractions of 0 and 0.17, respectively. Studying the effect of salinity on the initial growth of ten sugarcane varieties, with leaching fraction of 0.15, Simões et al. (2016) observed significant reduction in stem diameter regardless of the studied variety. Souto Filho (2013), evaluating two types of sugarcane, SP813250 and RB 92579, irrigated with brackish water and without leaching fraction, observed that stem diameter was not affected by water salinity until 230 DAP. After this period, difference was observed, and RB 92579 showed the highest mean. Oliveira et al. (2011) claimed that stem diameter is a parameter that depends not only on genetic characteristics of the variety, but also on the number of tillers, spacing used and environmental conditions.
In the present study, maximum tillering was achieved in the control treatment, 10.85 and 12.4 tillers, with reductions of 40.37 and 36.05% at the leaching fractions of 0 and 0.17, respectively (Figures 2C and D), in the comparison between T1 and T5 at 120 DAP. After this date, NT decreased in all treatments, but always with a greater reduction as water salinity increased, and this effect was attenuated with the leaching fraction of 0.17. Manhães et al. (2015) claimed that, after plants reach maximum tillering, they start competing for growth factors such as light, water and space, which reduces their quantity.
Leaching fraction of 0.17 led to higher number of tillers because, with leaching fraction of 0, water absorption is more difficult, due to the salts present in the soil solution, which reduce the osmotic potential. In this tillering stage, sugarcane requires a large water volume for its development, because the lack of water paralyses cell division and elongation. Zhao et al. (2010) reported reduction in the formation of tillers on the order of 33 and 37% in two consecutive years, resulting from the imposition of water scarcity.
Stem height (SH) increased linearly along the days, but with negative effect for salinity (Figure 3). There was no
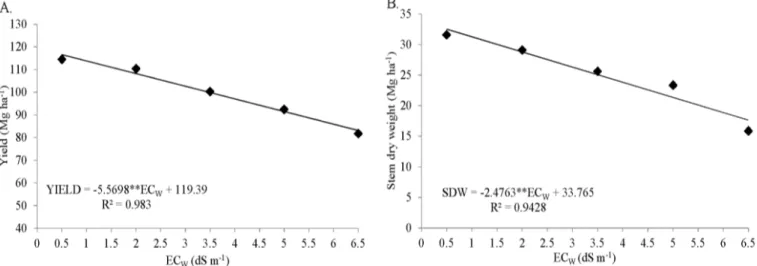
Figure 4. Yield (A) and stem dry weight - SDW (B) of sugarcane irrigated with brackish water
(**), (*) and (ns) significant at 0.01 and 0.05 probability level and not significant, respectively
Figure 3. Response surface of sugarcane stem height (SH) as a function of irrigation water salinity levels and days after planting
SH = -96.504 – 9.415nsECw + 1.928**DAP + 1.517*ECw² + 0.0006nsDAP² - 0.028nsECw*DAP
R² = 0.9624
interaction effect for the factor DAP and leaching fraction. According to Folegatti & Blanco (2000), the excess of salts in the soil solution modifies cell metabolic activities, limiting cell wall elasticity, reducing cell elongation and, consequently, plant growth. García & Medina (2010) observed lower growth in sugarcane plants irrigated with NaCl.
For sugarcane yield (YIELD) and stem dry weight (SDW), salinity had isolated significant effect, as well as the factor leaching fraction. There were reductions on the order of 4.67 and 7.33% in YIELD and SDW, respectively, per unit increase in water salinity, in dS m-1 (Figures 4A and B). Plant response to saline stress vary widely depending on species and genotype. While some plants exhibit high tolerance to salinity, others are highly susceptible. Therefore, in the present study, according to the equation proposed by Fageria et al. (2010), there were reductions on the order of 28.64 and 49.76% in YIELD and SDW, respectively, for the treatment T5 = 6.5 dS m-1 compared with T1 = 0.5 dS m-1.
salts, according to the classification of Fageria (1985). This result corroborates with the classification proposed by Maas & Hoffmam (1977), since these authors had already classified sugarcane as moderately sensitive to salinity.
The obtained mean yield was above the means of Brazil and the Pernambuco state, which are 76.232 and 53.257 Mg ha-1, respectively, according to CONAB (2016). Mean yield was estimated to be 114.55 Mg ha-1 at ECw = 0.5 dS m-1 and 81.73 Mg ha-1 at the highest salinity level (T5), for the environmental conditions of the present study.
Highest means were found using the leaching fraction of 0.17. For YIELD, values of 95.05 and 104.76 Mg ha-1 were found for the leaching fractions of 0 and 0.17, respectively, with least significant difference (LSD) of 6.438. For SDW, the values were 23.36 and 26.83 Mg ha-1 for the leaching fractions of 0 and 0.17, respectively, with LSD of 2.78.
Since brackish water was used in the irrigation as already mentioned, depending on the saline level and plant species and genotype, salinity may cause symptoms similar to those of water stress on the crops. Machado et al. (2009) claim that morphophysiological alterations are performed by the plant to avoid the effects of low water availability and, even considering these alterations, sugarcane exhibits a significant reduction in phytomass production. Nadian et al. (2012) also found reduction in stem weight as irrigation water salinity increased.
Conclusions
1. Using the leaching fraction of 0.17 led to greater growth and yield in sugarcane.
2. Salinity negatively influenced all sugarcane growth variables: stem height, number of tillers, leaf area, stem diameter and number of leaves, more significantly leaf area and stem diameter.
3. Irrigation water salinity linearly reduced sugarcane agricultural yield and stem dry weight.
Acknowledgments
To the Science and Technology Support Foundation of Pernambuco (FACEPE), to the Coordination for the Improvement of Higher Education Personnel (CAPES) for granting the Postgraduate scholarship and to the National Council for Scientific and Technological Development (CNPq/INCTsal) for the financial support.
Literature Cited
Armas, C.; Padilla, F. M.; Pugnaire, F. I.; Jackson, R. B. Hydraulic lift and tolerance to salinity of semiarid species: Consequences for species interactions. Oecologia, v.162, p.11-21, 2010. https://doi. org/10.1007/s00442-009-1447-1
CONAB - Companhia Nacional de Abastecimento. Acompanhamento da safra brasileira de cana-de-açúcar. Brasília: CONAB, 2016. 78p. EMBRAPA. Manual de análises químicas de solos, plantas e
fertilizantes. 2.ed. Brasília: EMBRAPA, 2009. 627p.
EMBRAPA. Manual de métodos de análise de solo. Centro Nacional de Pesquisa de Solos. 2.ed. Rio de Janeiro: EMBRAPA, 2011. 212p.
Fageria, N. K. Salt tolerance of rice cultivars. Plant and Soil, v.88, p.237-243, 1985. https://doi.org/10.1007/BF02182450
Fageria, N. K.; Soares Filho, W.; Gheyi, H. R. Melhoramento genético vegetal e seleção de cultivares tolerantes à salinidade. In: Gheyi, H. R.; Dias, N. S.; Lacerda, C. F. Manejo da salinidade na agricultura: Estudos básicos e aplicados. Fortaleza: INCT Sal, 2010. Cap.13, p.205-218.
Folegatti, M. V.; Blanco, F. F. Desenvolvimento vegetativo do pepino enxertado irrigado com água salina. Scientia Agricola, v.57, p.451-457, 2000. https://doi.org/10.1590/S0103-90162000000300013 García, M.; Medina, E. Crecimiento y morfología radical en dos
genotipos de caña de azúcar (Saccharum spp.) sometidos a
salinización con sales simples o suplementadas con cálcio. Revista de la Faculdad de Agronomía, v.27, p.17-38, 2010.
Hermann, E. R.; Câmara, G. M. S. Um método simples para estimar a área foliar de cana-de-açúcar. Revista STAB - Açúcar, Álcool e Subprodutos, v.17, p.32-34, 1999.
Maas, E. V.; Hoffman, G. J. Crop salt tolerance: Current assessment. Journal of Irrigation and Drainage Division, v.103, p.115-134, 1977.
Machado, R. S.; Ribeiro, R. V.; Marchiori, P. E. R.; Machado, D. F. S. P.; Machado, E. C.; Landell, M. G. de A. Respostas biométricas e fisiológicas ao déficit hídrico em cana-de-açúcar em diferentes fases fenológicas. Pesquisa Agropecuária Brasileira, v.44, p.1575-1582, 2009. https://doi.org/10.1590/S0100-204X2009001200003 Manhães, C. M. C.; Garcia, R. F.; Francelino, F. M. A.; Francelino, H. de
O.; Coelho, F. C. Fatores que afetam a brotação e o perfilhamento da cana-de-açúcar. Vértices, v.17, p.163-181, 2015. https://doi. org/10.5935/1809-2667.20150011
Nadian, H.; Nateghzadeh, B.; Jafari, S. Effects of salinity and nitrogen fertilizer on some quantity and quality parameters of sugar cane (Saccharum sp.). Journal of Food, Agriculture & Environment, v.10, p.470-474, 2012.
Oliveira, F. M.; Aspiazú, I.; Kondo, M. K.; Borges, I. D.; Pegoraro, R. F.; Vianna, E. J. Crescimento e produção de variedades de cana-de-açúcar influenciadas por diferentes adubações e estresse hídrico. Revista Trópica – Ciências Agrárias e Biológicas, v.5, p.56, 2011. Silva, I. N.; Fontes, L. de O.; Tavella, L. B.; Oliveira, J. B. de; Oliveira,
A. C. de. Qualidade de água na irrigação. ACSA-Agropecuária Científica no Semiárido, v.7, p.1-15, 2011.
Simões, W. L.; Calgaro, M.; Coelho, D. S.; Santos, D. B. dos; Souza, M. A. de. Growth of sugar cane varieties under salinity. Revista Ceres, v.63, p.265-271, 2016. https://doi.org/10.1590/0034-737X201663020019
Souto Filho, L. T. Crescimento e produção de dois genótipos de cana-de-açúcar com suplementação de regas com águas salinizadas. Campina Grande: UFCG, 2013. 70p. Dissertação Mestrado Willadino, L.; Camara, T. R. Tolerância das plantas à salinidade:
Aspectos fisiológicos e bioquímicos. Enciclopédia Biosfera, v.6, p.1-23, 2010.