Rev. Caatinga
PHOSPHORUS FORMS AND ADSORPTION IN A TYPIC QUARTZIPSAMMENT
CULTIVATED WITH SUGARCANE HARVESTED WITHOUT BURNING
1JOSÉ DE SOUZA OLIVEIRA FILHO2, MARCOS GERVASIO PEREIRA3*, BOANERGES FREIRE DE AQUINO2,
THALES VINÍCIUS DE ARAÚJO VIANA4
ABSTRACT- The objective of this study was to evaluate the adsorption of phosphorus (P) and changes in the
concentrations of organic and inorganic forms of P in a Neossolo Quartzarênico (Typic Quartzipsamment) after 9 years of successive cultivation with sugar cane without burning to harvest. Therefore, two areas, one in which
cane sugar was planted and a native forest reference area, located in the municipality of Paraipaba-CE, were
selected. In each area, samples were collected at depths of 0−0.025, 0.025−0.05, 0.05−0.10, 0.10−0.20, and 0.20−0.30 m, and the levels of organic (Po) and inorganic (Pi) phosphorus obtained by sequential extraction, the remaining phosphorus, and the maximum adsorption capacity of phosphorus by the soil were determined. In general, the permanence of straw on the soil surface under sugarcane cultivation promoted the maintenance of Po levels in the surface layers of the profile. The Po accumulated predominantly in the Po fraction extracted with sodium bicarbonate in both areas. Regarding the Pi content, changes were more evident during cultivation
due to the effect of successive phosphate fertilizer applications. The fraction extracted with 0.1 mol L-1 sodium
hydroxide was the most representative, with the highest levels of P uptake. P adsorption was influenced by the initial content of the nutrient in the soil and no relationship between P adsorption and organic matter content
was observed. The highest level of adsorption was observed in the bottom layer of the forest area (133.3 mg kg
-1) and the lowest level of adsorption was observed on the surface layer of the area under sugarcane cultivation
(59.5 kg mg-1).
Keywords: Sequential extraction. Sorption. Sandy soil.
FORMAS DE FÓSFORO E ADSORÇÃO EM NEOSSOLO CULTIVADO COM CANA-DE-AÇUCAR COLHIDA SEM QUEIMA
RESUMO – O presente trabalho teve como objetivo avaliar a adsorção de fósforo (P) e as mudanças ocorridas nas concentrações das formas orgânicas e inorgânicas de P em um Neossolo Quartzarênico após nove anos de cultivo sucessivos com cana-de-açúcar sem queima prévia do canavial para colheita. Para tanto, duas áreas,
plantio de cana-de-açúcar e mata nativa de referência, situadas no município de Paraipaba-CE, foram
selecionadas. Em cada uma das áreas foram coletadas amostras nas profundidades de 0 – 0,025; 0,025 – 0,05;
0,05 – 0,10; 0,10 – 0,20 e 0,20 – 0,30 m; determinando-se os teores de fósforo orgânico (Po) e inorgânico (Pi)
obtidos através de extração sequencial, o fósforo remanescente (Prem) e a capacidade máxima de adsorção de fósforo (CMAP) do solo. De maneira geral, a permanência da palhada na superfície do solo sob cultivo de cana
-de-açúcar promoveu a manutenção dos níveis de Po nas camadas superficiais do perfil. O Po acumulou-se
predominantemente na fração biodisponível extraído com bicarbonato de sódio nas duas áreas. Com relação ao conteúdo de Pi, as mudanças foram mais evidentes devido ao efeito das sucessivas aplicações de fertilizantes fosfatados ao longo do cultivo, sendo a fração extraída com hidróxido de sódio 0,1 mol L-1, a mais
representativa com maiores níveis de P acumulados. A adsorção de P foi influenciada pelo conteúdo inicial do nutriente no solo e nenhuma relação entre adsorção de P e o conteúdo de matéria orgânica foi observada. O maior valor de adsorção de P foi observado na camada inferior da área de mata (133,3 mg kg-1) e a menor
adsorção na camada superficial da área sob cultivo de cana (59,5 mg kg-1).
Palavras-chave: Extração sequencial. Sorção. Solo arenoso.
_____________________ *Corresponding author
1Received for publication in 03/29/2015; accepted in 09/28/2016.
Paper extracted from the master thesis of the first author.
2Departament of Soil Science, Universidade Federal do Ceará, Fortaleza, CE, Brazil; [email protected], [email protected]. 3Department of Soil, Universidade Federal Rural do Rio de Janeiro, Seropédica, Rio de Janeiro, RJ, Brazil; [email protected].
INTRODUCTION
Brazil is the largest producer of sugarcane (Sacharum officinarum), followed by India and China. In the 2014/2015 season, Brazil produced 634 million tons of sugarcane in 9 million hectares. In the northeastern region, 55 million tons were produced in 1 million cultivated hectares (BRASIL, 2016).
The system of sugarcane harvest without burning the cane field offers several benefits to the environment. Among them, the retention of crop residues on the soil surface, contributes to the protection, conservation, and addition of organic material, permitting an increase in the bioavailability of soil nutrients (RESENDE et al., 2006).
Phosphorus (P) is a scarce nutrient in most farming systems and its bioavailability is strongly influenced by the soil management adopted
(RHEINHEIMER; ANGHINONI, 2001).
Consequently, when sugarcane management occurs without the cane field being burned for the harvest, successive applications of phosphate fertilizer occur over several years and favor the input of organic matter on the surface, showing that it is possible to increase the P organic fraction of the total phosphorus content (Total P). In addition, possible modifications might occur during the reaction of phosphate ion adsorption with the soil mineral matrix.
According to Rheinheimer et al. (2008), in young soils such as Typic Quartzipsamments, P may occur in primary minerals, representing the greatest part of this element found in the organic form. Additionally, Gatiboni et al. (2007) concluded that in soils with low P availability, the organic forms of this nutrient are the main supply of P to cultures.
To study different forms of P in soil, several authors have used the fractioning technique proposed by Hedley, Stewart, and Chauhan (1982). Fractioning involves sequentially extracting organic and inorganic forms of P and using extractors with different extraction forces to allow them to be classified according to their lability for plants (NEGASSA; LEINWEBER, 2009).
Knowledge on the bioavailability of P for crops should involve, besides measuring soil nutrient content, the estimated sorption of this nutrient by colloids. The P retention, whether added in available forms or not, can occur by adsorption of iron and aluminum oxyhydroxides, aluminosilicates, and the organic matter (OM) present in the soil (URRUTIA et al., 2013).
One feature used to assess the degree of interaction between P and the soil mineral matrix is the maximum P adsorption capacity (MPAC), which can be calculated by Langmuir’s adsorption isotherm. According to Alvarez and Fonseca (1990), another attribute that can measure the sorptive activity of the soils is the remaining P (Prem), which can also be used to estimate MPAC.
The objectives of this study were to assess changes in the content of organic and inorganic forms of P, Prem, and in MPAC, as well as to understand how these variables interact in a Typic Quartzipsamment after 9 years of cultivation with sugarcane without burning for harvest, using an adjacent area of native forest as a control.
MATERIAL AND METHODS
The study was conducted in a commercial area in the municipality of Paraipaba-CE, located
between the geographic coordinates 3°30′08″S and 39°12′68″W at an altitude of 76 m above sea level.
The climate is tropical semi-arid, with uneven
rainfall in the first semester of the year and high concentration from January to May. The average annual temperature is 27.0°C and mean relative humidity is around 80% (IPECE, 2013).
To classify the soil of the experimental area, we opened two trenches of 1-m depth in an area
under sugarcane cultivation and in the adjacent native forest. The soils of both areas were classified as Orthic Typic Quartzipsamment (SANTOS et al., 2013). The chemical and physical soil properties obtained in each area are shown in Table 1.
The pH values in water, content of Ca, Mg, Na, K, H + Al, P avail (available P), total carbon (C), and the particle size (sand, silt and clay content) were determined according to SILVA (2009).
Table 1. Chemical and physical attributes of Orthic Typic Quartzipsamment in the 0−1.0-m layer cultivated with sugarcane
and in the adjacent native forest.
Depth (m) pH Ca Mg Na K H + Al Available P C Sand Silt Clay --- cmolc dm-3--- mg dm
-3
--- g kg-1 ---
Sugarcane area
Rev. Caatinga
Sugarcane cultivation began in 2001. The cultivated area was a “Caatinga” forest with no human activity prior to the beginning of the cultivation. The area was deforested and the remaining plant material was burned in piles on the same site.
After burning the remaining vegetation material, soil tillage was conducted by plowing and disking. The acidity was corrected with the application of 2 mg dolomitic lime per hectare. The variety planted on the site was SP 716949, using
1.5-m spacing between grooves. During 2001 to
2008, 500 kg ha-1 year-1 of mineral fertilizer in the
formulation 20-10-20 was applied, whereas during
2009 to 2010, 500 kg ha-1 year-1 of mineral fertilizer
in the formulation 20-05-20 was applied. The
sugarcane harvest had always been performed mechanically with residual straw remaining on the soil surface.
Soil samples were collected for laboratory analyses between the plants lines in a 500-m² area
cultivated with sugarcane for 9 years and an area of native forest. In each area, six mini-trenches of
0.3-m depth were open at random. Samples were
collected in the trenches of both areas at depths of 0.0–0.025, 0.025–0.05, 0.05−0.10, 0.10−0.20, and 0.20−0.30 m. The samples were dried, crushed, and
passed through a 2-mm mesh sieve to obtain a fine
air-dried soil (TFSA).
Po and Pi fractions were obtained by sequential extraction, as proposed by Hedley, Stewart, and Chauhan (1982), with modifications as proposed by Condron, Goh, and Newman (1985),
using the following extractors: 0.5 mol L-1 NaHCO
3
pH 8.5 (Po bic and Pi bic), 0.1 mol L-1 NaOH (Po hid
0.1 and Pi hid 0.1), 1 mol L-1 HCl (Pi HCl), and 0.5
mol L-1 NaOH (Po hid 0.5 and Pi hid 0.5). The Po of
each fraction was obtained by subtracting the Pi content from the total P content at each stage of
extraction. The total organic P (Total Po) was obtained by adding the organic fractions of each extractor (Total Po = Po bic + Po hid 0.1 + Po hid 0.5).
After the sequential extraction, we quantified the P content in residual soil (Residual P) by digestion, using perchloric acid and magnesium chloride. The P total content of the soil was obtained by adding the total content of P obtained in each extractor to the residual P content.
The Prem of the samples was quantified according to Alvarez and Fonseca (1990) using 20 mL of 0.01 mol L-1 CaCl
2 solution containing
60 mg of P in the form of KH2PO4, which remained
in contact with the soil for one night. After this period, we removed an aliquot of the supernatant solution for Prem quantification. Prem contents were used to define the doses of P to be used to quantify the MPAC.
MPAC was determined according to the method described by Alvarez and Fonseca (1990) by placing 2.0 g of TFSA in contact with 20 mL solution of 0.01 mol L-1 CaCl
2, containing 3, 5, 8, 12,
15, 18, and 20 mg kg-1 of P in the form of KH
2PO4,
for 24 hours. The suspension was collected immediately and the P content was quantified in the equilibrium solution. Following this, we proceeded to fit the Langmuir isotherm using the equation below:
(1)
where:
= amount of adsorbed P in the soil in mg kg-1
of soil
a = binding energy (L mg-1)
AC
abC
m
X
1
m
X
The pH values in water, content of Ca, Mg, Na, K, H + Al, P avail (available P), total carbon (C), and the particle size (sand, silt and clay content) were determined according to Silva (2009).
Table 1. Continuation.
Depth (m) pH Ca Mg Na K H + Al Available P C Sand Silt Clay --- cmolc dm-3--- mg dm
-3
--- g kg-1 ---
Sugarcane area
0.6 – 0.8 6.6 0.5 0.5 0.1 0.0 1.2 1.0 6.7 760 100 140 0.8 – 1.0 6.0 0.5 0.5 0.1 0.0 1.5 1.0 0.2 760 130 110
Native forest
b = MPAC (mg kg-1)
C = Concentration of equilibrium (mg L-1)
To estimate the constant b, equation 1 was transformed into its linear form:
(2)
The OM of the soil was determined by the
oxidation of OM with 0.167 mol L-1 potassium
dichromate, in a sulfuric acid medium, and by titration with 0.2 mol L-1 ferrous ammonium sulfate
(SILVA, 2009).
To compare the variables between the areas at each depth, the Student’s t-test was applied using the
statistical program Assistat, version 7.6 beta (SILVA; AZEVEDO, 2002). We also used a multivariate technique of principal components
C
b
ab
m
X
C
1
)
(
1
analysis (PCA) to understand how the different fractions of P, adsorption characteristics, and OM content interact at the same time, taking into consideration the 0−0.025 m and 0.20−0.30 m layers in both areas.
RESULTS AND DISCUSSION
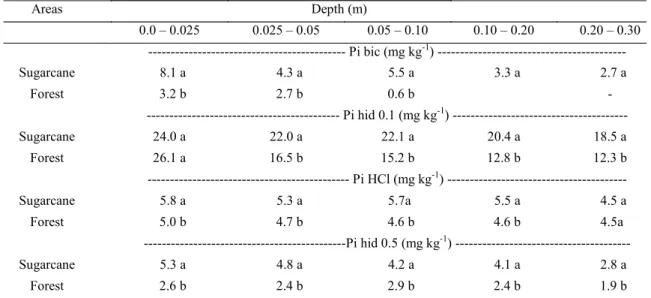
Inorganic P fractions are presented in Table 2. The Pi bic fraction represented the labile or bioavailable inorganic P, which is subjected to adsorption phenomena with the soil mineral matrix and is used by microorganisms and plants. This was present at low concentrations in both areas, highlighting the difficulty of maintaining the Pi content readily available in this soil class. In the sugarcane cultivation areas, higher values of Pi bic were always observed in relation to the control area.
Table 2. Mean content of inorganic phosphorus fractions obtained in the sugarcane and native forest area at different depths.
Means followed by the same letter are not statistically different between the two areas by Student’s t-test at 5%
probability. Pi bic = inorganic phosphorus extracted with 0.5 mol L-1 NaHCO
3; Pi hid 0.1 = inorganic phosphorus
extracted with 0.1 mol L-1 NaOH; Pi HCl = inorganic phosphorus extracted with 1 mol L-1 HCl; Pi hid 0.5 = inorganic phosphorus extracted with 0.5 mol L-1 NaOH. = below quantification level.
Several studies have confirmed the low levels of the Pi bic fraction in the total P soil content. Xavier et al. (2009) evaluated P forms in a Quartzipsamment during organic management in
Ibiapaba-CE and found levels of Pi bic ranging from
6.97 to 38.94 mg kg-1
, with the lowest level found in
the control forest area and the highest level found in an organic system fertilized with cattle manure. Studying the P forms in a Quartzipsamment cultivated with rice, in Minas Gerais, Tokura et al. (2011) quantified values of 5.2 mg kg-1 of Pi bic.
The Pi hid 0.1 fraction represented the highest P content from the remaining inorganic fractions in both areas evaluated. A similar result was observed by Tokura et al. (2011), with reported yields of 12.6 mg kg-1 of P extracted with 0.1 mol L-1 NaOH.
Those authors suggested that the Pi hid 0.1 fraction is the main buffer of the more labile Pi fractions of the soil. This means that, as the most labile forms of P are consumed by plants and microorganisms, a portion of the Pi hid 0.1 fraction is converted into Pi bic, continuing to buffer the P delivery system to the plants.
The Pi hid 0.1 fraction in the sugarcane area was found to be higher in all evaluated layers, with the exception of the first, which presented a similar value to that observed in the forest area. This pattern suggests that in the first layer of native forest, there was reduced consumption of P by plants and microorganisms. This led to the accumulation of Pi hid 0.1 in that layer, without being used to buffer the removal of the most labile P fractions.
Areas Depth (m)
0.0 – 0.025 0.025 – 0.05 0.05 – 0.10 0.10 – 0.20 0.20 – 0.30 --- Pi bic (mg kg-1) --- Sugarcane 8.1 a 4.3 a 5.5 a 3.3 a 2.7 a
Forest 3.2 b 2.7 b 0.6 b -
--- Pi hid 0.1 (mg kg-1) ---
Sugarcane 24.0 a 22.0 a 22.1 a 20.4 a 18.5 a
Forest 26.1 a 16.5 b 15.2 b 12.8 b 12.3 b
--- Pi HCl (mg kg-1) --- Sugarcane 5.8 a 5.3 a 5.7a 5.5 a 4.5 a Forest 5.0 b 4.7 b 4.6 b 4.6 b 4.5a
---Pi hid 0.5 (mg kg-1) --- Sugarcane 5.3 a 4.8 a 4.2 a 4.1 a 2.8 a
Rev. Caatinga
always presenting the highest levels. This fraction represents Pi associated with oxides and silicate clays with the higher binding energy (CONDRON; GOH; NEWMAN, 1985). Thus, in view of the mineralogical conditions of the study soil, with a predominance of quartz mineral, the formation of this P fraction is reduced.
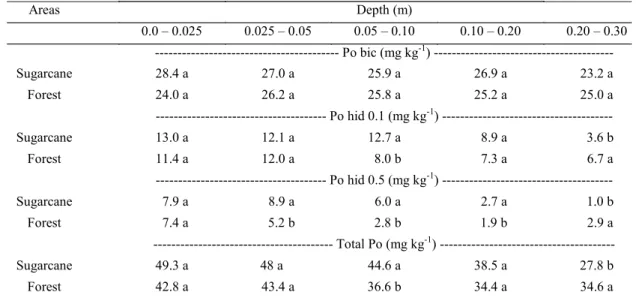
For Po contents (Table 3), the Po bic fraction was more available, but labile, and no significant difference was observed between the areas. As for the Po hid 0.1 fraction, there were significant differences between the areas at depths of 0.05−0.10 and 0.20−0.30 m only. For the Po hid 0.5 fraction, the differences between the areas were more evident, with similarities only observed in the first layer. Pi HCl, which is the P fraction associated
with calcium, forms highly stable calcium phosphate, and was found at very low levels in the two areas evaluated. The content of this fraction was higher in the sugarcane area, except for the last layer, in which similar levels were observed in both areas. The absence of conditions required for the formation of calcium phosphate in the soil, due to poor calcium source material, justifies the low Pi levels found in this fraction. Both Pi HCl and Pi hid 0.1 are the preferred forms of Pi accumulation in soils receiving
mineral fertilizer (CONTE; ANGHINONI;
RHEINHEIMER, 2003; SANTOS et al., 2008; GONÇALVES; MEURER, 2009).
Similar to the pattern observed for the Pi HCl fraction, the content of the Pi hid 0.5 fraction was low in both studied areas, with the sugarcane area
Table 3. Mean content of organic phosphorus fractions in the sugarcane and native forest areas at different depths.
Means followed by the same letters are not statistically different between the two areas according to the Student’s t-test at 5% probability. Po bic = organic phosphorus extracted with 0.5 mol L-1 NaHCO
3; Po hid 0.1 = organic phosphorus extracted with 0.1 mol L-1 NaOH; Po hid 0.5 = organic phosphorus extracted with 0.5 mol L-1 NaOH; Po total = Po bic + Po hid 0.1 + Po hid 0.5.
According to Salcedo (2006), in natural ecosystems, where no external P source is added, nutrient bioavailability is mainly related to its cycling in the soil and the Po content tends to remain stable over time. When the system is disturbed by the introduction of commercial crops, leading to an increase in plant biomass and fertilizer use, there is greater microbial activity, resulting in increased mineralization and a decrease in the more labile P organic fractions of the soil.
The small difference observed in the content of Po fractions between the two study areas suggests that the management adopted in the area cultivated with sugarcane maintained the same Po levels as those found in the control area. The maintenance of Po levels in the system is important as it is a constant source of nutrients for beneficial environmental organisms, which can be readily absorbed by plants
following mineralization.
Results similar to those observed in the present study were shown by Schmitt et al. (2014) when evaluating P forms in vineyard areas subjected to 7 years of phosphate mineral fertilization, when compared to a native control area. The authors suggested that part of the mineral P added annually in the form of fertilizer starts to be used by microorganisms and plants, thus becoming an organic component that returns to the mineral form over time following mineralization.
In general, for the soil total Po content, represented by the sum of organic fractions, significant differences between areas were observed
only in the 0.05−0.10- and 0.20−0.30-m layers. The
Po bic fraction showed the highest concentrations among the other organic fractions, representing 27.8−36.1% of the total P content in the sugarcane
Areas Depth (m)
0.0 – 0.025 0.025 – 0.05 0.05 – 0.10 0.10 – 0.20 0.20 – 0.30 --- Po bic (mg kg-1) ---
area and 26.5−40.1% of the total P content in the forest area. In the forest area and in the area under cultivation, this fraction can be an important source of P for plants, which is not quantified by the usual methods used to determine soil P availability. Therefore, in the same way as the Pi hid 0.1 and Pi hid 0.5 fractions, the Po hid 0.1 and Po 0.5 hid fractions act as a buffer of the more labile P reservoir, ensuring a gradual supply of P following consumption of the Po bic fraction.
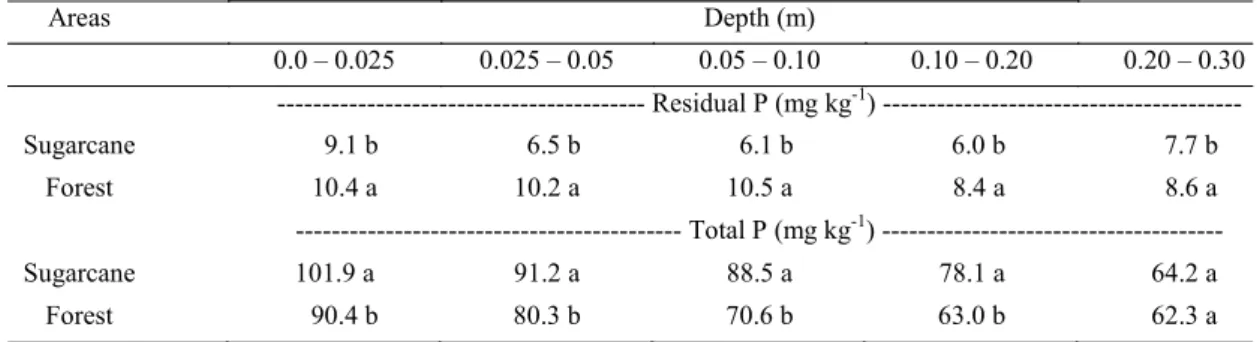
Regarding the residual phosphorus content shown in Table 4, which represents the inorganic and
recalcitrant organic P not available for plants, we observed that the contents of this fraction were higher in the forest area than in the sugarcane area. According to Cross and Schlesinger (1995), this may be the most recalcitrant fraction gained by fractionation, which is obtained only with the use of a strong acid. This represents the P present in highly stable humic structures, which are typical of forest areas. This explains why this fraction is present in greater amounts in the forest area when compared to the sugarcane area.
Table 4. Mean content of residual and total P in the sugarcane area and native forest area at different depths.
Means followed by the same letters are statistical different between the two areas by Student’s t-test at 5%
probability.
The total P content varied widely, from 62.3 to 101.9 mg kg-1, with the highest levels observed in
the sugarcane area surface and the lowest levels observed in the last layer of the forest area. Low levels of total P are due to a reduced P content in soil source material, since quartz is the predominant
primary mineral (JACOMINE; ALMEIDA,
MEDEIROS, 1973).
The total phosphorus content in the area under sugarcane cultivation was higher than that found in the forest area, with the exception of the last layer (0.20− 0.30 m). This pattern is due to the effect of phosphate fertilizer application in the cultivated area over 9 years. However, the fact that P has low mobility in the soil profile favored the accumulation of this nutrient in the upper layers (LEÃO et al., 2007). This explains the low nutrient content in the
last layer of the cultivated area, which presented levels similar to those observed in the same layer of the forest area.
Regarding the adsorption characteristics, there was little variation in the Prem content quantified in this study, from 55.1 to 58.2 mg kg-1,
indicating low potential for P adsorption by the soil (Table 5). Similar results were observed by Boschetti, Quintero, and Benavidez (1998), who quantified 54.5 mg kg-1 of Prem content in the
surface layer of a Quartzipsamment in Entre Rios in Argentina. On the other hand, Corrêa, Nascimento, and Rocha (2011) performed studies in representative soils in the State of Pernambuco and
found 57.8 mg kg-1 of Prem in the surface layer of a
Typic Quartzipsamment.
Table 5. Remaining phosphorus mean content (Prem) and organic matter (OM) in sugarcane cultivated area and adjacent native forest, at different depths evaluated.
Means followed by the same letters show no statistical difference between the two areas, as assessed by the Student’s t-test at 5% probability. OM = organic carbon × 1.724.
Areas Depth (m)
0.0 – 0.025 0.025 – 0.05 0.05 – 0.10 0.10 – 0.20 0.20 – 0.30 --- Residual P (mg kg-1) ---
Sugarcane 9.1 b 6.5 b 6.1 b 6.0 b 7.7 b Forest 10.4 a 10.2 a 10.5 a 8.4 a 8.6 a --- Total P (mg kg-1) --- Sugarcane 101.9 a 91.2 a 88.5 a 78.1 a 64.2 a
Forest 90.4 b 80.3 b 70.6 b 63.0 b 62.3 a
Areas Depth (m)
0.0 – 0.025 0.025 – 0.05 0.05 – 0.10 0.10 – 0.20 0.20 – 0.30 --- Prem (mg kg-1) ---
Sugarcane 58.2 a 57.7 a 57.8 a 57.7 a 55.1 a Forest 55.8 b 55.6 b 55.5 b 55.8 b 55.1 a --- OM (g kg-1) --- Sugarcane 24.9 a 23.2 a 21.7 a 22.0 a 21.7 a
Rev. Caatinga
The highest Prem content was found in the surface layer of the sugarcane area. At all depths, the area under sugarcane cultivation presented a higher Prem content when compared to the area of native forest, with the exception of the last layer, which showed the same content in both areas evaluated.
In the case of OM, there were no significant differences in the surface layers between the areas;
however, in the 0.10−0.20 - and 0.20−0.30-m layers,
higher levels of OM were observed in the sugarcane area to the detriment of the native forest area. According to Pinheiro et al. (2010), at these depths, there is a lot of decaying plant material from the root system of the sugarcane, which may have promoted greater OM content in the area under sugarcane cultivation.
The Prem contents obtained in the present
study preliminary explain the mechanism of P adsorption by this soil. Hence, MPAC was determined using only the 0.0−0.025 m and 0.20−0.30 m layers, in both evaluated areas, which showed a greater difference when compared to the others. It is presumed that in the layers in which Prem contents were similar, MPAC values are also equal.
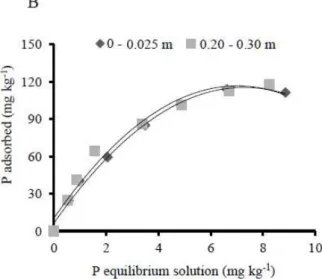
Regarding MPAC, the maximum adsorption in the sugarcane area occurred in the 0.20−0.30-m
layer (101.2 mg kg-1) and the lowest was observed in
the surface layer (53.5 mg kg-1) (Figure 1A). In the
native forest area, similar values were found at the two depths. In the 0−0.025-m layer, the maximum
absorption was 113.8 mg kg-1 and in the
0.20−0.30-m layer the maximum adsorption was
117.7 mg kg-1 (Figure 1B).
Figure 1. P adsorption isotherms in Quartzipsamment cultivated with sugarcane (A) and in the native forest area (B) at depths of 0−0.25 and 0.20−0.30 m.
In a P adsorption study performed in soils under native forest in the state of Ceará, Moreira et al. (2006) observed values of 256.41 mg kg-1 for
MPAC in the surface layer of a Typic
Quartzipsamment in Ibiapaba-CE. On the other hand,
Corrêa, Nascimento, and Rocha (2011) studied a Typic Quartzipsamment under native forest in
Pernambuco, and quantified values of 44.58 mg kg-1
for maximum P adsorption. The difference in P adsorption characteristics between these two soils was due to differences observed in the initial P content, represented by available P, and the different OM content.
To understand the relationship between
organic and inorganic P fractions, their adsorption characteristics, and OM soil content, a PCA was performed using a data matrix consisting of 12 variables. To reduce the number of factors, the Kaiser criterion was used, which considers only eigenvalues higher than the mean value obtained by the set of eigenvalues (FIGUEREDO FILHO; SILVA JUNIOR, 2010). Thus, only components 1 and 2 were selected as meeting this criterion. These two components together explained 84.09% of the variance, representing 60.92 and 23.17% of the variance explained by components 1 and 2, respectively (Table 6).
Table 6. Eigenvalues and percent explained variance by each component.
Component Eigenvalue Explained Variance Explicada Explained Variance
(%) (%)
1 5.48 60.92 60.92
Table 6. Continuation.
Figure 2 shows that MPAC is inversely proportional to the Prem value and inorganic P fractions, especially the most labile, which is represented by Pi bic. This explains the effect of the initial P content in the soil, which is able to influence the reactivity of phosphate ions with the mineral soil matrix. The adsorption of P is reduced since the
adsorption sites are already saturated by the nutrient. As the native forest area was not influenced by fertilizer use, the adsorption of P starts to increase, as the adsorption sites are free for the process to occur. This contributes to increase MPAC values in this area.
Figure 2. Dispersion of organic and inorganic P forms, adsorption characteristics, and soil organic matter in 0−0.025- and
0.20−0.30-m layers in the area of sugarcane and adjacent native forest.
According to the data scattering matrix obtained from the 0−0.025 m and 0.20−0.30 m layers, both in the sugarcane and native forest area, no relationship was observed between OM content and P adsorption characteristics. However, studies reported in the literature have shown that soil OM can behave ambivalently in relation to P adsorption. Some authors have reported that due to the anionic nature of OM, P adsorption may occur via cation bridges, to which aluminum, iron, and calcium are adsorbed (NOVAIS; SMYTH, 1999; MOREIRA et al, 2006). Nevertheless, other studies have shown a negative contribution of OM aimed at reducing P adsorption by means of organic acids that block adsorption sites (GUPPY et al., 2005; FONTANA et
al., 2008; PEREIRA et al., 2010).
Hence, we suggest that the lower adsorption in the superficial layer of the sugarcane area is due to the higher initial phosphate content compared to that in the deepest layer in the same area, and the superficial and deep layers of the native forest area. Soils with higher initial P concentrations may have MPAC values reduced by up to 40% (RHEINHEIMER et al., 2003).
CONCLUSIONS
Cultivation of sugarcane that is harvested
Component Eigenvalue Explained Variance Explicada Explained Variance
(%) (%)
3 0.85 9.44 93.54
4 0.45 5.06 98.61
5 0.07 0.87 99.48
6 0.04 0.47 99.95
7 0.00 0.04 99.99
8 0.00 0.00 100.00
9 0.00 0.00 100.00
Rev. Caatinga
without the cane field being burned does not reduce the Po content of the soil compared to the reference contents observed in the native forest. Only the 0.20−0.30 m layer in the native forest area presented a Po content higher than that observed in the sugarcane area. This pattern indicates that the effect of straw on the soil on Po content is less noticeable in depth.
Po accumulates predominantly in the Po bic fraction in both areas. The mineralization of this fraction may represent a major source of P for the plants, which is not detected by usual methods that determine the availability of this nutrient in the soil. Regarding the Pi content, the Pi hid 0.1 fraction is the most representative in both areas.
The initial P content in different layers of the profile affects the adsorption dynamics of the nutrient by the soil mineral matrix. In this study, no relationship was observed between P adsorption and the content of OM in the soil. In cultivations, the successive use of phosphate fertilizer promotes a reduction in P adsorption sites, increasing Prem values and diminishing the adsorption capacity of the nutrient by the soil mineral matrix.
REFERENCES
ALVAREZ, V. H.; FONSECA, D. M. Definição de doses de fósforo para determinação da capacidade máxima de adsorção de fosfatos e para ensaios em
casa de vegetação. Revista Brasileira de Ciência do
Solo, Viçosa, v. 14, n. 1, p. 49-55, 1990.
BOSCHETTI, A. N. G.; QUINTERO, G. C. E.; BENAVIDEZ, Q. R. A. Caracterização do fator capacidade de fósforo em solos de Entre Rios, Argentina. Revista Brasileira de Ciência do Solo,
Viçosa, v. 22, n. 1, p. 95-99, 1998.
BRASIL. Companhia Nacional de Abastecimento.
Acompanhamentoda safra brasileira de cana-de -açúcar, terceiro levantamento. Disponível em: <http://www.conab.gov.br/OlalaCMS/uploads/
arquivos/15_04_13_08_49_33_boletim_cana_portug ues_-_1o_lev_-_15-16.pdf>. Acesso em: 20 jun.
2016.
CONDRON, L. M.; GOH, K. M.; NEWMAN, R. H. Nature and distribution of soil phosphorus as revealed by a sequential extraction method followed by 31P nuclear magnetic resonance analysis.
European Journal of Soil Science, Malden, v. 36, n. 2, p. 199-207, 1985.
CONTE, E.; ANGHINONI, T.; RHEINHEIMER, D. S. Frações de fósforo acumuladas em Latossolo argiloso pela aplicação de fosfato no sistema plantio
direto. Revista Brasileira de Ciência do Solo,
Viçosa, v. 27, n. 5, p. 893-900, 2003.
CORRÊA, R. M.; NASCIMENTO, C. W. A.; ROCHA, A. T. Adsorção de fósforo em dez solos do Estado de Pernambuco e suas relações com
parâmetros físicos e químicos. Acta Scientiarum.
Agronomy, Maringá, v. 33, n. 1, p. 153 - 159, 2011.
CROSS, A. F.; SCHLESINGER, W. H. A literature review and evaluation of the Hedley fractionation: Applications to the biogeochemical cycle of soil
phosphorus in natural ecosystems. Geoderma,
Amsterdam, v. 64, n. 3, p. 197-214, 1995.
FONTANA, A. et al. Fósforo remanescente e correlação com as substâncias húmicas em um Latossolo Vermelho sob diferentes sucessões de
cultura em plantio direto. Revista Brasileira de
Agrociência, Pelotas, v. 14, n. 1, p. 161-166, 2008.
FIGUEREDO FILHO, D. B.; SILVA JUNIOR, J. A. Visão além do alcance: uma introdução a análise
fatorial. Opinião Pública, Campinas, v. 16, n. 1, p.
160-185, 2010.
GATIBONI, L. C. et al. Biodisponibilidade de formas de fósforo acumuladas em solo sob sistema
plantio direto. Revista Brasileira de Ciência do
Solo, Viçosa, v. 31, n. 4, p. 691-699, 2007.
GONÇALVES, G. K.; MEURER, E. J. Frações de fósforo no solo e sua relação com a absorção pelas plantas de arroz irrigado por alagamento em solos do
Rio Grande do Sul. Revista Brasileira de Ciência
do Solo, Viçosa, v. 33, n. 2, p. 357-362, 2009.
GUPPY, C. N. et al. Competitive sorption reactions between phosphorus and organic matter in soil: A
review. Australian Journal of Soil Research,
Melbourne, v. 43, n. 2, p. 189-202, 2005.
HEDLEY, M. J.; STEWART, J. W. B.; CHAUHAN, B. S. Changes in inorganic and organic soil phosphorus fractions induced by cultivation practices
and by laboratory incubations. Soil Science Society
of America Journal, Madison, v. 46, n. 1, p. 970
-976, 1982.
INSTITUTO DE PESQUISA E ESTRATÉGIA
ECONÔMICA DO CEARÁ – IPECE. Perfil básico
municipal de Paraibapa. Disponível em: <http://
www.ipece.ce.gov.br/perfil_basico_municipal/2013/ Paraipaba.pdf>. Acesso em: 15 set. 2014.
JACOMINE, P. K. T.; ALMEIDA, J. C.;
MEDEIROS, L. A. R. Levantamento exploratório
-reconhecimento de solos do estado do Ceará. 1 ed.
Recife, PE: MAPA, 1973. 376 p.
LEÃO, A. B. et al. Variabilidade espacial de fósforo em solo do perímetro irrigado Engenheiro
Fortaleza, v. 38, n. 1, p. 1-6, 2007.
MOREIRA, F. L. M. et al. Adsorção de fósforo em
solos do Estado do Ceará. Revista Ciência
Agronômica, Fortaleza, v. 37, n. 1, p. 7-12, 2006.
NEGASSA, E.; LEINWEBER, P. How does the Hedley sequential phosphorus fractionation reflect impacts of land use and management on soil
phosphorus: A review. Journal of Plant Nutrition
and Soil Science, Weinheim, v. 172, n. 3, p. 305-325, 2009.
NOVAIS, R. F.; SMYTH, T. J. Fósforo em solo e
planta em condições tropicais. 1. ed, Viçosa, MG:
UFV, 1999, 399 p.
PEREIRA, M. G. et al. Carbono, matéria orgânica leve e fósforo remanescente em diferentes sistemas
de manejo do solo. Pesquisa Agropecuária
Brasileira, Brasília, v. 45, n. 5, p. 508-514, 2010.
PINHEIRO, E. F. M. et al. Impact of pre-harvest
burning versus trash conservation on soil carbon and nitrogen stocks on a sugarcane plantation in the
Brazilian Atlantic Forest region. Plant Soil,
Netherlands, v. 333, n. 1, p. 71-80, 2010.
RESENDE, A. S. et al. Efeito da queima da palhada da cana-de-açúcar e de aplicações de vinhaça e
adubo nitrogenado em características tecnológicas da
cultura. Revista Brasileira de Ciência do Solo,
Viçosa, v. 30, n. 6, p. 937-941, 2006.
RHEINHEIMER, D. S.; ANGHINONI, I. Distribuição do fósforo inorgânico em sistemas de
manejo do solo. Pesquisa Agropecuária Brasileira,
Brasília, v. 36, n. 1, p. 151-160, 2001.
RHEINHEIMER, D. S. et al. Dessorção de fósforo avaliada por extrações sucessivas em amostras de solo provenientes dos sistemas plantio direto e
convencional. Ciência Rural, Santa Maria, v. 33, n.
6, p. 1053-1059, 2003.
RHEINHEIMER, D. S. et al. Fósforo orgânico do
solo. In: SANTOS, G. S. et al. (Eds.). Fundamentos
da matéria orgânica do solo: ecossistemas tropicais e subtropicais. 1. ed. Porto Alegre: Metrópole, 2008. v. 1, cap. 8, p. 419-441.
SALCEDO, I. H. Biogeoquímica do fósforo em solos da região semiárida do nordeste do Brasil.
Revista Geografia, Recife, v. 23, n. 1, p. 108-123, 2006.
SANTOS, H. G. et al. Sistema Brasileiro de
Classificação de Solos. 3. ed. Brasília, DF:
Embrapa, 2013. 353 p.
SANTOS, J. Z. L. et al. Frações de fósforo em solo adubado com fosfatos em diferentes modos de
aplicação e cultivado com milho. Revista Brasileira
de Ciência do Solo, Viçosa, v. 32, n. 2, p. 705-714, 2008.
SCHMITT, D. E. et al. Phosphorus fractions in the vineyard soil of the Serra Gaúcha of Rio Grande do
Sul, Brazil. Revista Brasileira de Engenharia
Agrícola e Ambiental, Campina Grande, v. 18, n. 2, p. 134-140, 2014.
SILVA, F. A. S.; AZEVEDO, C. A. V. Versão do programa computacional Assistat para o sistema
operacional Windows. Revista Brasileira de
Produtos Agroindustriais, Campina Grande, v. 4, n. 1, p. 71-78, 2002.
SILVA, F, C. Manual de análises químicas de
solos, plantas e fertilizantes. 2. ed. Brasília, DF:
Embrapa, 2009, 627 p.
TOKURA, A. M. et al. Dinâmica das formas de fósforo em solos de textura e mineralogia
contrastantes cultivadas com arroz. Acta
Scientiarum. Agronomy, Maringá, v. 33, n. 1, p. 171-179, 2011.
URRUTIA, O. et al. Theoretical chemical
characterization of phosphate-metal-humic
complexes and relationships with their effects on both phosphorus soil fixation and phosphorus availability for plants, Journal of the Science of
Food and Agriculture, London, v. 93, n. 2, p. 293-303, 2013.
XAVIER, F. A. S. et al. Phosphorus fractionation in a Sandy soil under organic agriculture in
Northeastern Brazil. Geoderma, Amsterdam, v. 151,