Pesq. agropec. bras., Brasília, v.48, n.9, p.1254-1259, set. 2013 DOI: 10.1590/S0100-204X2013000900009
Repeatability of adaptability and stability parameters
of common bean in unpredictable environments
Lidiane Kely de Lima(1), Magno Antonio Patto Ramalho(1),
Ricardo Augusto Diniz Cabral Ferreira(1) and Ângela de Fátima Barbosa Abreu(2)
(1)Universidade Federal de Lavras, Departamento de Biologia, Caixa Postal 3.037, CEP 37200‑000 Lavras, MG, Brazil.
E‑mail: lidianekely@yahoo.com.br, magnoapr@dbi.ufla.br, ricardo.cabral.agronomia@gmail.com (2)Embrapa Arroz e Feijão, Caixa Postal 179,
CEP 75375‑000 Santo Antônio de Goiás, GO, Brazil. E‑mail: afbabreu@dbi.ufla.br
Abstract – The objective of this work was to estimate the repeatability of adaptability and stability parameters of common bean between years, within each biennium from 2003 to 2012, in Minas Gerais state, Brazil. Grain yield data from trials of value for cultivation and use common bean were analyzed. Grain yield, ecovalence, regression coefficient, and coefficient of determination were estimated considering location and sowing season per year, within each biennium. Subsequently, a analysis of variance these estimates was carried out, and repeatability was estimated in the biennia. Repeatability estimate for grain yield in most of the biennia was relatively high, but for ecovalence and regression coefficient it was null or of small magnitude, which indicates that confidence on identification of common bean lines for recommendation is greater when using means of yield, instead of stability parameters.
Index terms: Phaseolus vulgaris, biometry, genotype by environment interaction, plant breeding, quantitative genetic.
Repetibilidade dos parâmetros de adaptabilidade e estabilidade
do feijoeiro em ambientes imprevisíveis
Resumo – O objetivo deste trabalho foi estimar a repetibilidade dos parâmetros de adaptabilidade e estabilidade do feijoeiro entre anos, dentro de cada biênio de 2003 a 2012, em Minas Gerais, Brasil. Os dados de produtividade de grãos provenientes de ensaios de valor de cultivo e uso de feijoeiro‑comum foram analisados. A produtividade de grãos, a ecovalência, o coeficiente de regressão e o coeficiente de determinação foram estimados quanto a local e época de semeadura por ano, dentro de cada biênio. Posteriormente, realizou‑se análise de variância destas estimativas, e a repetibilidade foi estimada nos biênios. A estimativa de repetibilidade quanto à produtividade de grãos, na maioria dos biênios, foi relativamente alta, mas, quanto à ecovalência, ao coeficiente de determinação e ao coeficiente de regressão, foi nula ou de pequena magnitude, o que indica maior confiança na identificação de linhagens de feijão a serem recomendadas, quando se usam as medidas de produtividade, em vez dos parâmetros de estabilidade.
Termos para indexação: Phaseolus vulgaris, biometria, interação genótipo por ambiente, melhoramento de
plantas, genética quantitativa.
Introduction
Common bean is grown throughout Brazilian territory over the entire year and, therefore, under diverse environmental conditions. In this situation, the genotype by environment interaction is expected to be expressive, as shown in the literature (Pereira et al., 2010; Silva et al., 2011; Torga et al., 2013). For that reason, the Ministério da Agricultura, Pecuária e Abastecimento (Mapa) requires that the trials of value for cultivation and use (VCU) must be conducted in various environments, including diverse growing
conditions, for the selection of cultivars with greater phenotypic stability (Brasil, 2006).
The term “environment” includes the growing conditions, and this involves locations, sowing seasons, years, and cropping practices, among others, or even a combination of these factors. As to variations
of environments, Allard & Bradshaw (1964) classified
them as predictable and unpredictable. Predictable variations are those which occur in a systematic manner or are under human control. Unpredictable
variations are those which fluctuate in an inconsistent
of common bean between years, within each biennium from 2003 to 2012, in Minas Gerais State, Brazil.
Materials and Methods
Yield data from trials of value for cultivation and use (VCU) carioca (beige grain with brown stripes) common–bean were used. The trials were conducted in Minas Gerais state by Embrapa Arroz e Feijão, Universidade Federal de Lavras, Universidade
Federal de Viçosa, and by the Empresa de Pesquisa
Agropecuária de Minas Gerais, from 2003 to 2012 (four biennia).
Environments were chosen within each biennium in which locations and sowing seasons repeated in the two years (Table 1). The number of common bean lines varied among biennia, with 20 in 2003/2004, 25 in 2005/2006, 26 in 2008/2009, and 25 in 2011/2012.
The experiments were set up following the minimum requirements established by Ministério da Agricultura, Pecuária e Abastecimento (MAPA) (Brasil, 2006) for VCU testing of common bean, as: randomized block design with three replicates, and plots of four four‑meter length rows. Grain yield data were obtained considering the two center rows. No disease or pest control was performed.
Data from each environment, location and sowing season were subjected to analysis of variance, and the mean values were obtained. Then, joint analysis regard to rainfall, temperature, relative humidity, and
other factors.
Different methodologies are shown in the literature with a view towards the study of adaptability and stability (Cruz & Carneiro, 2004; Oliveira et al., 2006; Pereira et al., 2009; Bernardo, 2010; Ramalho et al., 2012b). Nevertheless, it is not enough to simply estimate the stability parameter. It is necessary to verify if it is inheritable, because cultivars are evaluated with the hope that their performance will appear in the future, when their use by farmers will occur under environmental conditions certainly different from those under which they were evaluated (Gauch Júnior & Zobel, 1988).
Information concerning the genetic control of stability parameters is not frequent. One method, sometimes used, makes it possible to estimate the repeatability of the adaptability and stability parameters, for which experiments should be conducted in each environment, with four replicates. Two analyses have to be performed, one with the data from the 1st and 2nd replicates, and the other with data from the 3rd and 4th ones. Thus, two groups of the parameter estimates are obtained in analyses involving the various environments. Analysis of variance in a randomized block design is then carried out, considering the results of each group of observation as replicates.
By this method, some estimates were obtained with common bean and other crops. For mean yield, repeatability (r2
yy') ranged from 0.40 to 0.98; for ecovalence (W2
i%), from ‑0.43 to 0.80; and for coefficient of determination (R2), from 0.41 to 0.83 (Farias et al., 1998; Bruzi et al., 2007). The problem of this method, emphasized by the authors, is that the estimate of variation (VP) that composes the numerator of the expression of repeatability, not only contains the component of genetic deviation, but it also contains permanent environmental variations, which means that temperature and moisture of a single location are common to all the replicates. These estimates are therefore overestimated. In addition, they did not involve years, which is an unpredictable environmental factor. It would be important to obtain information on genetic control of stability parameters mainly involving the effect of years, which is an unpredictable environmental factor.
The objective of this work was to estimate the repeatability of the adaptability and stability parameters
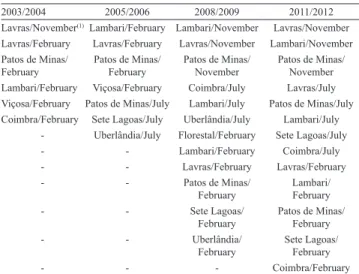
Table 1. Environments used in each biennium for value for cultivation and use testing of common bean from 2003 to 2012, in Minas Gerais state, Brazil.
2003/2004 2005/2006 2008/2009 2011/2012 Lavras/November(1)Lambari/February Lambari/November Lavras/November
Lavras/February Lavras/February Lavras/November Lambari/November Patos de Minas/
February
Patos de Minas/ February
Patos de Minas/ November
Patos de Minas/ November Lambari/February Viçosa/February Coimbra/July Lavras/July
Viçosa/February Patos de Minas/July Lambari/July Patos de Minas/July
Coimbra/February Sete Lagoas/July Uberlândia/July Lambari/July ‑ Uberlândia/July Florestal/February Sete Lagoas/July ‑ ‑ Lambari/February Coimbra/July ‑ ‑ Lavras/February Lavras/February ‑ ‑ Patos de Minas/
February
Lambari/ February ‑ ‑ Sete Lagoas/
February
Patos de Minas/ February ‑ ‑ Uberlândia/
February
Sete Lagoas/ February ‑ ‑ ‑ Coimbra/February
Pesq. agropec. bras., Brasília, v.48, n.9, p.1254‑1259, set. 2013 DOI: 10.1590/S0100‑204X2013000900009
of variance per year was performed using R software (R Foundation for Statistical Computing, Vienna, AT), and Scott‑Knott clustering test, at 5% probability, according to Ramalho et al. (2012a).
The stability parameters for each year were estimated. Eberhart & Russell (1966) stability analysis was carried by the following model: yij=b0i+b1iIj+Vdij+eij, in which: yij is the estimated average for the i cultivar, in the j environment; b0i is the intercept or mean of the i cultivar; b1i is the regression coefficient of the i cultivar; and Ij is the environmental index. The environmental index (Ij) uses the average of each environment (y.j) as a measure of environmental fluctuation, and is determined by the following estimator: Ij= (y.j/t)‑(y../tk)=y.j‑y,in which: y.j is the total of the j environment; t is the number of environments; k is the number of common bean lines; y is the overall total; eij is the experimental, medium error; and Vdij is the regression deviation of the i cultivar in the j environment.
The coefficient of determination (R2
i) was used instead of the regression deviations (Vdi) because they provide essentially the same information and, as R2 ranges from 0 to 100%, it is easier to make comparisons. The ecovalence in percentage W2
i % was estimated (Cruz & Carneiro, 2004). Ecovalence (W2
i %) is a measure of type II agronomic stability, (Becker, 1981); it estimates the contribution of each line to the interaction. Since line x environment
interaction is of a fixed nature, the significance of the
ecovalence estimates (H0:W2i = 0) was tested by the mean square error, using the following expression:
in which: g is number of common bean lines; and a is number of environments.
Pearson’s correlation coefficient was estimated between mean grain yield, ecovalence, coefficient of
determination (R2), and regression coefficient (b i). With the estimates of mean grain yield, and R2 and W2
i % obtained per year, analyses of variance were performed considering each year of the biennium
as a replicate. Considering that the line has a fixed
effect, repeatability (r2
yy') was estimated considering the year y and y’ in each biennium, by the expression r2
yy'=(Q1‑Q2)/Q1=COVyy’/VF=VP/[VP+(VE/2)], in which: Q1 and Q2 are the mean square of common bean line
and error, respectively, by the analysis of variance of each biennium; COVyy' is the covariance between the performance of common bean lines in years y and y’; VF is the variance among line means; VP is the sum of square of genetic deviations between lines; and VE is the environmental variance.
Results and Discussion
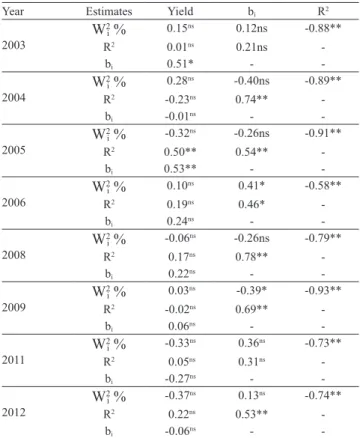
Pearson’s correlation between ecovalence and
coefficient of determination were high and significant
(Table 2). The closer is R2 to 100, more stable is the lineage. Thus, W2
i % and R2 should provide similar results. Estimates of correlation between R2 and b
i were mostly high and significant, except for the years 2003
and 2011, which shows that the greater bi estimate, the better its adjustment to the regression line, and the higher was R2. For W2
i % and bi, all the estimates were low and nonsignificant, except for the years 2006 and
~
Fc = (gW /g-1)/ai
2 -1
MSerror
F ( %;a-1;DF )tab error
Table 2. Pearson’s correlation coefficient between grain
yield, ecovalence (W2
i %), coefficient of determination (R2), and regression coefficient (bi). Data obtained annually for the value for cultivation and use testing of common bean conducted in Minas Gerais state, Brazil, from 2003 to 2012.
Year Estimates Yield bi R2
2003
W2i % 0.15ns 0.12ns ‑0.88**
R2 0.01ns 0.21ns ‑
bi 0.51* ‑ ‑
2004
W2i % 0.28ns ‑0.40ns ‑0.89**
R2 ‑0.23ns 0.74** ‑
bi ‑0.01ns ‑ ‑
2005
W2i % ‑0.32ns ‑0.26ns ‑0.91**
R2 0.50** 0.54** ‑
bi 0.53** ‑ ‑
2006
W2i % 0.10ns 0.41* ‑0.58**
R2 0.19ns 0.46* ‑
bi 0.24ns ‑ ‑
2008
W2i % ‑0.06ns ‑0.26ns ‑0.79**
R2 0.17ns 0.78** ‑
bi 0.22ns ‑ ‑
2009
W2i % 0.03ns ‑0.39* ‑0.93**
R2 ‑0.02ns 0.69** ‑
bi 0.06ns ‑ ‑
2011
W2i % ‑0.33ns 0.36ns ‑0.73**
R2 0.05ns 0.31ns ‑
bi ‑0.27ns ‑ ‑
2012
W2i % ‑0.37ns 0.13ns ‑0.74**
R2 0.22ns 0.53** ‑
bi ‑0.06ns ‑ ‑
2009. Estimates of correlations between W2
i %, R2 or bi and grain yield were of small magnitude, and most of them were nonsignificant. Thus, in principle, it is
possible to identify productive and stable common bean lines. Results similar to these were obtained
under other conditions (Gonçalves et al., 2007; Silva
Filho et al., 2008; Cargnelluti Filho et al., 2009; Rocha et al., 2010).
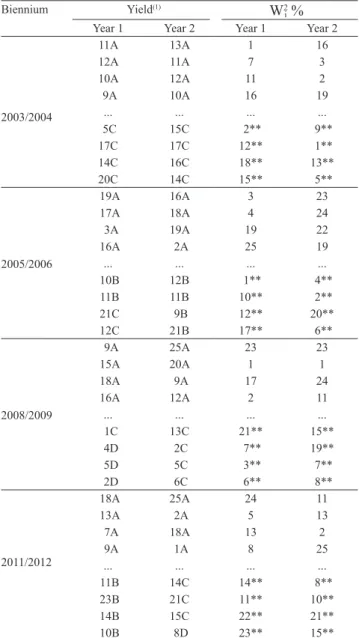
The existence of significant difference among
the evaluated lines was shown by the fact that they grouped in more than one class by Scott‑Knott test (Table 3). However, in each year, the four highest yielding lines always belonged to the same group by the aforementioned test. It is interesting to observe that
coincidence in the lines classified as having better or
worse performance, in the two years, varied according to the biennium. Coincidence was small in the two last biennia (2008/2009 and 2011/2012).
The four lines with W2
i % lowest estimate, in all cases, were nonsignificant, which means they did not
differ from zero, and, therefore, contributed little to the interaction (Tabela 3). In contrast, the four common bean lines with the highest contribution to interaction showed W2
i % estimate different from zero. It was possible to identify common bean lines differing in agronomic stability, since ecovalence (W2
i %) is a measure of the type II agronomic stability, as already mentioned (Becker, 1981).
For mean grain yield, the effect of years did not vary between the biennia, except for the 2011/2012 biennium (Table 4). In principle, the VCU is carried out in two years, presuming that the behavior of each biennium represents the climatic conditions which the future cultivar – recommended to farmers – will confront (Gauch Júnior & Zobel, 1988).
Common bean line source of variation was
significant for grain yield in all the biennia, except
for the 2011/2012 (Table 4), showing that the mean performance of the lines was different in each biennium, which is desirable because breeders will be able to identify lines which may be recommended to farmers by means of this variable. Performance repeatability of common bean lines in the two years of each biennium was relatively high, except for the last biennium. This fact is particularly expressive, considering that year is an unpredictable environmental factor (Allard & Bradshaw, 1964).
As the ecovalence estimate was obtained in percentage within each year, the sum of squares of the year source of variation in the analysis of variance was null (Table 4). Similarly to bi, as for each year the average of bi was one, there was no variation between years. There was no significant difference
among common bean lines for ecovalence. As a result, the repeatability estimate of stability parameters was practically null.
Table 3. Best and worst common bean lines selected by means of grain yield and estimates of ecovalence (W2i %), per year, within each biennium.
Biennium Yield(1)
W2i %
Year 1 Year 2 Year 1 Year 2
2003/2004
11A 13A 1 16
12A 11A 7 3
10A 12A 11 2
9A 10A 16 19
... ... ... ...
5C 15C 2** 9**
17C 17C 12** 1**
14C 16C 18** 13**
20C 14C 15** 5**
2005/2006
19A 16A 3 23
17A 18A 4 24
3A 19A 19 22
16A 2A 25 19
... ... ... ...
10B 12B 1** 4**
11B 11B 10** 2**
21C 9B 12** 20**
12C 21B 17** 6**
2008/2009
9A 25A 23 23
15A 20A 1 1
18A 9A 17 24
16A 12A 2 11
... ... ... ...
1C 13C 21** 15**
4D 2C 7** 19**
5D 5C 3** 7**
2D 6C 6** 8**
2011/2012
18A 25A 24 11
13A 2A 5 13
7A 18A 13 2
9A 1A 8 25
... ... ... ...
11B 14C 14** 8**
23B 21C 11** 10**
14B 15C 22** 21**
10B 8D 23** 15**
(1)Means followed by equal letters, in the columns, belong to the same group by the Scott-Knott test, at 5% probability. **, *Significant at 1 and 5%
Pesq. agropec. bras., Brasília, v.48, n.9, p.1254‑1259, set. 2013 DOI: 10.1590/S0100‑204X2013000900009
Information on genetic control of the estimates of stability parameters is scarce in the literature, mainly
due to the difficulty of obtaining it. Pacheco et al.
(1999) and Cruz & Carneiro (2004) proposed the use of diallel crosses evaluated in various environments to
estimate the general and specific combination capacity of stability parameters. This strategy is very difficult to apply, due to the difficulty of performing all the crosses
of the diallel and, moreover, evaluating them in a large number of environments.
The strategy used in this work can apply to any VCU experiment, since there is a coincidence of locations and sowing dates in both years. It should be emphasized that any study method of interaction can be applied. Repeatability estimates in the literature, as already mentioned, are overestimated because the numerator of the expression of r2
yy' contains not only genetic deviation, but also permanent environmental
variations. The present study confirms the results
found in literature for the estimates ryy’, W2i %, and R2 (Farias et al., 1998; Bruzi et al., 2007).
Grain yield proved to be a character more favorable for selection than the parameters of adaptability and stability, based on r2
yy' estimates, as already mentioned. However, for the parameters ecovalence (W2
i %), coefficient of determination (R2), and regression coefficient (bi), breeders will rarely succeed in the selection, due to low repeatability from one year to another.
Conclusions
1. The estimate of repeatability for grain yield in most of the biennia is relatively high, whereas
for ecovalence, coefficient of determination, and regression coefficient, it is null or of small magnitude.
2. Due to higher repeatability estimates, confidence in identification of common bean lines to be
recommended is greater when based on yield instead of stability parameters.
Acknowledgments
To the professors of the Universidade Federal de
Viçosa (UFV), and to researchers of Empresa de
Pesquisa Agropecuária de Minas Gerais (Epamig) and Embrapa Arroz e Feijão (Cnpaf), who kindly granted the data for undertaking this study; and to Conselho
Nacional de Desenvolvimento Científico e Tecnológico
(CNPq), for scholarships.
References
ALLARD, R.W.; BRADSHAW, A.D. Implications of genotype‑environmental interactions in applied plant breeding.
Crop Science, v.4, p.503‑508, 1964. DOI: 10.2135/cropsci1964.0
011183X000400050021x.
BECKER, H.C. Correlations among some statistical measures of phenotypic stability. Euphytica, v.30, p.835‑840, 1981. DOI: 10.1007/BF00038812.
BERNARDO, R. Breeding for quantitative traits in plants. 2nd ed. Woodbury: Stemma, 2010. 390p.
BRASIL. Ministério da Agricultura, Pecuária e Abastecimento.
Requisitos mínimos para determinação do valor de cultivo e
uso de feijão (Phaseolus vulgaris), para a inscrição no registro
nacional de cultivares – RNC. Brasília: MAPA, 2006. Anexo I.
BRUZI, A.T.; RAMALHO, M.A.P.; ABREU, A. de F.B.; FERREIRA, D.F.; SENA, M.R. Homeostasis of common bean populations with different genetic structures. Crop Breeding and
Applied Biotechnology, v.7, p.111‑116, 2007.
CARGNELUTTI FILHO, A.; STORCK, L.; RIBOLDI, J.;
GUADAGNIN, J.P. Associação entre métodos de adaptabilidade
e estabilidade em milho. Ciência Rural, v.39, p.340‑347, 2009. DOI: 10.1590/S0103‑84782008005000080.
CRUZ, C.D.; CARNEIRO, P.C.S. Modelos biométricos aplicados
ao melhoramento genético. Viçosa: Ed. da UFV, 2004. 480p.
EBERHART, S.A.; RUSSEL, W.A. Stability parameters for comparing varieties. Crop Science, v.6, p.36‑40, 1966. DOI: 10.2135/cropsci1966.0011183X000600010011x.
FARIAS, F.J.C.; RAMALHO, M.A.P.; CARVALHO, L.P. de; MOREIRA, J. de A.N.; COSTA, J.N. da. Repetibilidade dos
Table 4. P‑value of the analysis of variance and estimates of repeatability (W2i %), means of grain yield (kg ha‑1), estimates of ecovalence , and regression coefficient (bi) by biennium. Data obtained for the value for cultivation and use (VCU) trials in Minas Gerais state, Brasil, for common bean, from 2003 to 2012.
Estimate SV Biennia
Years 2003/2004 2005/2006 2008/2009 2011/2012
Lines 0.51 0.11 0.47 0.00
Means of Yield 0.02 0.00 0.00 0.26
r2
yy' 0.62 0.72 0.66 0.23
W2
i % Lines 0.59 0.46 0.26 0.53
r2
yy' 0.00 0.04 0.23 0.00
Years 0.03 0.00 0.01 0.00
R2 Lines 0.58 0.26 0.65 0.64
r2
yy' 0.00 0.23 0.00 0.00
bi
Lines 0.18 0.46 0.27 0.53
r2
parâmetros de estabilidade na cultura do algodoeiro herbáceo.
Pesquisa Agropecuária Brasileira, v.33, p.457‑461, 1998.
GAUCH JÚNIOR, H.G.; ZOBEL, R.W. Predictive and postdictive success of statistical analyses of yield trials. Theoretical and
Applied Genetics, v.76, p.1‑10, 1988. DOI: 10.1007/BF00288824.
GONÇALVES, E.C.P.; DI MAURO, A.O.; CARGNELUTTI
FILHO, A. Adaptabilidade e estabilidade de genótipos de soja
conduzidos em duas épocas de semeadura, na região de Jaboticabal – SP. Científica, v.35, p.61‑70, 2007.
OLIVEIRA, G.V.; CARNEIRO, P.C.S.; CARNEIRO, J.E. de S.; CRUZ, C.D. Adaptabilidade e estabilidade de linhagens de feijão comum em Minas Gerais. Pesquisa Agropecuária Brasileira, v.41, p.257‑265, 2006. DOI: 10.1590/S0100‑204X2006000200010.
PACHECO, C.A.P.; CRUZ, C.D.; SANTOS, M.X. dos. Association
between Griffing’s diallel and the adaptability and stability of
Eberhart and Russel. Genetics and Molecular Biology, v.22, p.451‑456, 1999. DOI: 10.1590/S1415‑47571999000300027.
PEREIRA, H.S.; MELO, L.C.; FARIA, L.C. de; DEL PELOSO,
M.J.; CABRERA DIAZ, J.L.; WENDLAND, A. Indicação de cultivares de feijoeiro-comum baseada na avaliação conjunta
de diferentes épocas de semeadura. Pesquisa Agropecuária
Brasileira, v.45, p.571‑578, 2010. DOI: 10.1590/S0100‑
204X2010000600006.
PEREIRA, P.S.; MELO, L.C.; FARIA, L.C. de; DEL PELOSO, M.J.; COSTA, J.G.C. da; RAVA, C.A.; WENDLAND, A.
Adaptabilidade e estabilidade de genótipos de feijoeiro-comum
com grãos tipo carioca na Região Central do Brasil. Pesquisa
Agropecuária Brasileira, v.44, p.29‑37, 2009. DOI: 10.1590/
S0100‑204X2009000100005.
RAMALHO, M.A.P.; ABREU A. de F.B.; SANTOS J.B. dos; NUNES, J.A.R. Aplicações da genética quantitativa no
melhoramento de plantas autógamas. Lavras: Ufla, 2012b. 522p.
RAMALHO, M.A.P.; FERREIRA, D.F.; OLIVEIRA, A.C. de.
Experimentação em genética e melhoramento de plantas.
Lavras: Ufla, 2012a. 305p.
ROCHA, V.P.C.; MODA‑CIRINO, V.; DESTRO, D.; FONSECA JÚNIOR, N. da S.; PRETE, C.E.C. Adaptabilidade e estabilidade da característica produtividade de grãos dos grupos comerciais carioca e preto de feijão. Semina: Ciências Agrárias, v.31, p.39‑54, 2010.
SILVA FILHO, J.L. da; MORELLO, C. de L.; FARIAS, F.J.C.;
LAMAS, F.M.; PEDROSA, M.B.; RIBEIRO, J.L. Comparação de
métodos para avaliar adaptabilidade e estabilidade produtiva em algodoeiro. Pesquisa agropecuária Brasileira, v.43, p.349‑355, 2008. DOI: 10.1590/S0100‑204X2008000300009.
SILVA, C.A.; ABREU, A. de F.B.; RAMALHO, M.A.P.;
CARNEIRO, J.E. de S. Implicações da origem das linhagens
na magnitude da interação com ambientes. Pesquisa
Agropecuária Brasileira, v.46, p.720‑728, 2011. DOI: 10.1590/
S0100‑204X2011000700007.
TORGA, P.P.; MELO, P.G.S.; PEREIRA, H.S.; FARIA, L.C.; DEL PELOSO, M.J.; MELO, L.C. Interaction of common beans cultivars of the black group with years, locations and sowing seasons. Euphytica, v.189, p.239‑248, 2013. DOI: 10.1007/ s10681‑012‑0793‑y.